Fig. 10
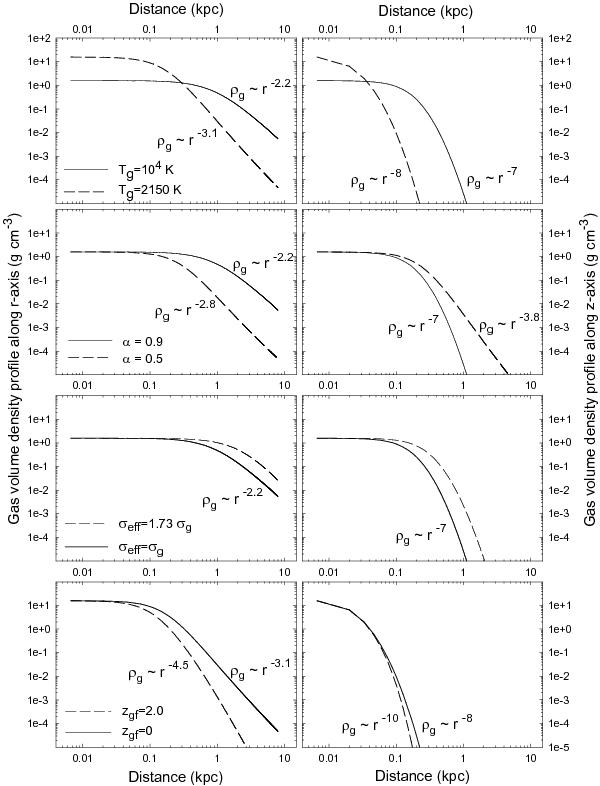
Comparison of the gas volume density profiles along the r-axis (left column) and z-axis (right column). In particular, models in the top row are characterized by different gas temperatures Tg (as indicated), the second top row by different spin parameters α, the third top row by different effective gas dispersions σeff, and the bottom row by different redshift for galaxy formation zgf. All other parameters for every model are the same (see text for more details).
Current usage metrics show cumulative count of Article Views (full-text article views including HTML views, PDF and ePub downloads, according to the available data) and Abstracts Views on Vision4Press platform.
Data correspond to usage on the plateform after 2015. The current usage metrics is available 48-96 hours after online publication and is updated daily on week days.
Initial download of the metrics may take a while.