Fig. A.1
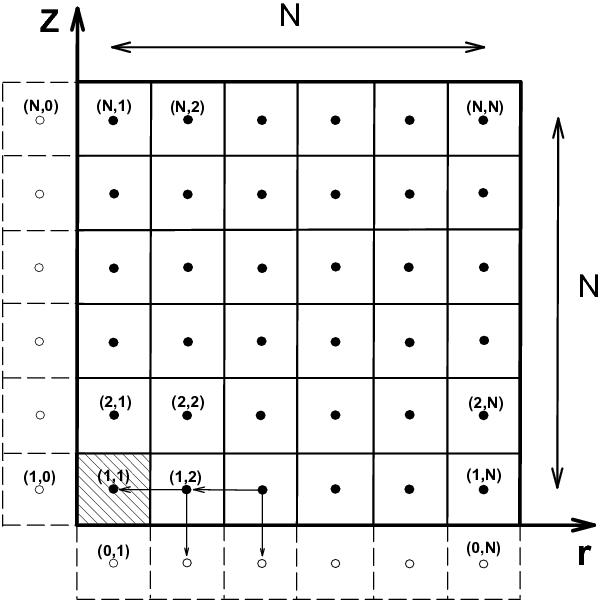
Computational domain in the (r,z) plane showing active and ghost grid zones with solid and dashed lines, respectively. The zone centers are marked with filled/open circles for active/ghost zones. The arrows indicate the backward finite-difference scheme used to discretize spatial derivatives. The innermost grid cell highlighted with a backslash palette refers to the seed value of the gas surface density n0,0.
Current usage metrics show cumulative count of Article Views (full-text article views including HTML views, PDF and ePub downloads, according to the available data) and Abstracts Views on Vision4Press platform.
Data correspond to usage on the plateform after 2015. The current usage metrics is available 48-96 hours after online publication and is updated daily on week days.
Initial download of the metrics may take a while.