Fig. 8
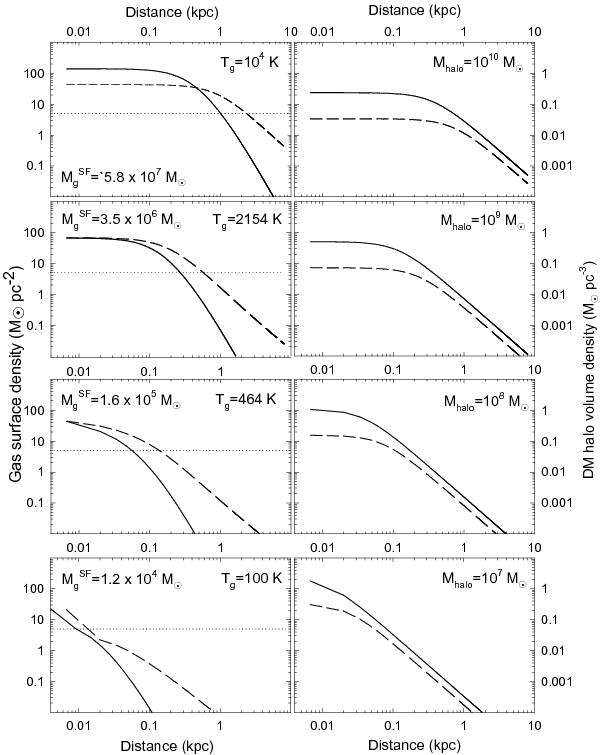
Left column. Comparison of the gas surface density in the reference model (dashed lines) with that of the zgf = 2.0 model (solid lines). The dotted line marks the critical surface density for star formation Σc = 5 M⊙ pc-2. Gas temperature is indicated in every panel and the DM halo mass is shown in the corresponding panels on the right. The gas mass  with number density higher than 1.0 cm-3 is given for the zgf = 2.0 models. Right column. Volume density profiles of the quasi-isothermal DM halos of various mass (as indicated in each panel) at zgf = 0 (dashed lines) and zgf = 2.0 (solid lines).
Current usage metrics show cumulative count of Article Views (full-text article views including HTML views, PDF and ePub downloads, according to the available data) and Abstracts Views on Vision4Press platform.
Data correspond to usage on the plateform after 2015. The current usage metrics is available 48-96 hours after online publication and is updated daily on week days.
Initial download of the metrics may take a while.