| Issue |
A&A
Volume 543, July 2012
|
|
|---|---|---|
| Article Number | A39 | |
| Number of page(s) | 12 | |
| Section | Interstellar and circumstellar matter | |
| DOI | https://doi.org/10.1051/0004-6361/201219007 | |
| Published online | 25 June 2012 | |
Interstellar reddening towards six small areas in Puppis-Vela⋆,⋆⋆
Departamento de Física – ICEx – UFMG, Caixa Postal 702, 30.123-970 – Belo Horizonte – MG, Brazil
e-mail: This email address is being protected from spambots. You need JavaScript enabled to view it.
Received: 9 February 2012
Accepted: 1 May 2012
Abstract
Context. The line-of-sight towards Puppis-Vela contains some of the most interesting and elusive objects in the solar neighbourhood, including the Gum nebula, the IRAS Vela shell, the Vela SNR, and dozens of cometary globules.
Aims. We investigate the distribution of the interstellar dust towards six small volumes of the sky in the region of the Gum nebula.
Methods. New high-quality four-colour uvby and Hβ Strömgren photometry obtained for 352 stars in six selected areas of Kapteyn and complemented with data obtained in a previous investigation for two of these areas, were used to estimate the colour excess and distance to these objects. The obtained colour excess versus distance diagrams, complemented with other information, when available, were analysed in order to infer the properties of the interstellar medium permeating the observed volumes.
Results. On the basis of the overall standard deviation in the photometric measurements, we estimate that colour excesses and distances are determined with an accuracy of  and better than 30%, respectively, for a sample of 520 stars. A comparison with 37 stars in common with the new Hipparcos catalogue attests to the high quality of the photometric distance determination. The obtained colour excess versus distance diagrams testify to the low density volume towards the observed lines-of-sight. Very few stars out to distances of 1 kpc from the Sun have colour excesses larger than
  .
.
Conclusions. In spite of the low density character of the interstellar medium towards the Puppis-Vela direction, the obtained reddening as a function of the distance indicates that two or more interstellar structures are crossed towards the observed lines-of-sight. One of these structures may be associated with the very low density “wall” of the Local Cavity, which has a distance of 100 − 150 pc from the Sun. Another structure might be related to the Gum nebula, and if so, its front face would be located at ~350 pc from the Sun.
Key words: stars: distances / ISM: clouds / dust, extinction / ISM: individual objects: Gum nebula / techniques: photometric
Table 1 is only available at the CDS via anonymous ftp to cdsarc.u-strasbg.fr (130.79.128.5) or via http://cdsarc.u-strasbg.fr/viz-bin/qcat?J/A+A/543/A39
Based on observations collected at the European Southern Observatory (ESO, La Silla, Chile).
© ESO, 2012
1. Introduction
Early investigations proposed that the Sun lies in an irregularly shaped largely evacuated volume of gas with a minimum radius of ~50 pc and a maximum radius of 150–200 pc (known as “the Local Cavity”). A review of the properties of this low density volume may be found in Frisch et al. (2011). Nevertheless, high resolution Na i D absorption line studies (see for instance, Welsh et al. 2010) and photometric analyses (e.g., Reis et al. 2011) have revealed a tunnel of low interstellar gas density towards the Galactic longitude l ~ 260°, extending to at least 250 pc from the Sun. This line-of-sight coincides with the direction of Puppis-Vela (l = 245° to 275°, b = −15° to + 10°), which is known to host some of the most interesting astronomical objects in the solar neighbourhood. A detailed description of the major features observed out to a distance of ~2 kpc is provided by Pettersson (2008). However, since our main interest in this investigation is the nearest 1 kpc, the objects within this volume are briefly introduced.
One of these features is the Gum nebula discovered by Gum (1952) during an Hα survey of the southern Milky Way. It is the largest feature in this region and probably the most controversial of them. The Gum nebula appears as a spherical shell of ionised gas with an apparent diameter of ≈36°, centred on (l,b) = (258°, −2°) (Chanot & Sivan 1983). Slightly to the southeast, but still in the direction of the Gum nebula, Sahu (1992) identified an extended ring-like dust structure in the IRAS emission maps. This structure is known as the IRAS Vela shell (IVS), centred on (l,b) = (263°, −7°), and about 15° in diameter.
The Vela supernova remnant, supposedly one of the closest SNR to us, is another interesting feature. It is found in the same direction as the Gum nebula, centred on (l,b) = ( ,
, ) and is about 8° in diameter.
In addition, a few dozens of cometary globules (CG) have been discovered in the region of the Gum nebula distributed in a nearly circular pattern (Hawarden & Brand 1976; Sandqvist 1976; Zealey et al. 1983; Reipurth 1983). These all have compact dense heads that are opaque to the background starlight. On the side pointing towards the centre of the nebula, they are well-defined with very sharp edges often exhibiting narrow bright rims, while on the opposite side they have protruding slightly luminous tails.
The distances and origins of these interstellar features are controversial and debated issues. For instance, Woermann et al. (2001) suggested that the diffuse gas composing the Gum nebula and the cometary globules system form a single expanding shell with a maximum radius of 14°. These authors also claimed that no evidence was found that the IVS is a separate expanding shell, and suggested that it is a density enhancement in the neutral Gum nebula shell. As the result of their kinematical model, they suggested that the Gum nebula can be more accurately described as a non-uniformly expanding shell in which the front face expands faster than the back face, centred at 500 pc from the Sun. In this model, the front face would be at about 350 pc from us. Other authors have suggested values for the distance to the centre of the Gum nebula that varies from 290 pc (Franco 1990; Knude & Nielsen 2000) to 800 pc (Sahu & Blaauw 1993). Those latter authors proposed that the IVS encompasses the Vela OB2 association at a distance of about 450 pc (more recent estimates locates this association slightly closer to the Sun, see e.g., de Zeeuw et al. 1999; Jeffries et al. 2009). In the Sahu & Blaauw’s scenario, the Gum nebula, and IVS are two independent, but not interacting, entities. The front faces should be at ~390 pc and ~540 pc from the Sun, respectively for the IVS and the Gum nebula.
The distance estimate to the centre of the Vela SNR also suffers from a large uncertainty, ranging from 250 ± 30 pc (Cha et al. 1999) to the assumed 500 pc by Milne (1968), or even more. Nevertheless, the best estimate seems to be the one obtained by VLBI parallax measure (Dodson et al. 2003), which provides a distance of 287 ± 19 pc.
The next structure is less controversial. Behind the Gum nebula, there is a large molecular cloud complex known as the Vela Molecular Ridge (VMR) (May et al. 1988; Murphy & May 1991). This giant molecular complex extends roughly 20° in the sky and comprises four main clouds designated A to D by Murphy & May (1991). These authors suggested distances of about 1 kpc to components A, C, and D, and about 2 kpc to component B. Each of these main clouds have masses exceeding 105 M⊙. Liseau et al. (1992) investigated the distance to this complex, finding that clouds A, C, and D are likely at 700 ± 200 pc, whereas cloud B appears to be at ~2 kpc. These authors also identified dozens of objects that could be classified as Class I sources, reinforcing the suggestion made by Murphy & May (1991) that this large complex is an active region of star formation. Furthermore, Netterfield et al. (2009) found that 2% of the mass of the molecular gas comprising this complex is in cold cores in a range of evolutionary stages. In addition, two dozen embedded stellar clusters are believed to be associated to this giant molecular complex (e.g., Bica et al. 2003; Dutra et al. 2003b).
This paper introduces the analysis of the interstellar reddening obtained from high-quality Strömgren photometry of stars belonging to six selected areas of Kapteyn with lines-of-sight towards the volume encompassing the Gum nebula and its neighbourhood structures.
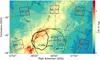 |
Fig. 1 Detail of the investigated region. The reddening image was retrieved from the all-sky extinction map published by Schlegel et al. (1998). The borders of the areas observed photometrically are indicated by the red boxes. The approximate Gum nebula border is indicated by the large (orange) circle of radius ~18° centred at |

2. Observational data
The observations were performed with the Strömgren Automatic Telescope (SAT) of the Copenhagen Astronomical Observatory at La Silla, Chile. The telescope was equipped with a six-channel uvby-β spectrograph-photometer (Florentin Nielsen 1985), which allows simultaneous measurements for the uvby passbands, or simultaneous measurements for the narrow and wide passbands used to define the β index. The procedure used to collect the measurements as well as the method employed to reduce the data, such as extinction correction and transformations to the uvby and to the β standard systems, were previously described by Franco (1994).
The observing list is based on the Potsdam Spektral-Durchmusterung (Becker & Brück 1929–1938). All stars brighter than  , earlier than G0 and belonging to the selected areas SA 147, SA 148, SA 149, and SA 170 were chosen for observation. In addition, the previous observed sample for selected areas SA 171 and SA 173 (Franco 1988) were complemented to fulfil the same spectral coverage as the former four areas. All the observed areas have sizes of 16 square degrees in the Potsdam Spektral-Durchmusterung.
A total of 352 stars were observed at least twice in both modes, uvby and Hβ. The uvby measurements were used to obtain for each star the colour index (b − y), the colour index differences m1 = [(v − b) − (b − y)] and c1 = [(u − v) − (v − b)] on the standard uvby system (Crawford & Barnes 1970; Grønbech et al. 1976), and the visual photometric V magnitude on the Johnson system. The Hβ index is on the standard β system (Crawford & Mander 1966). The obtained results are introduced in Table 1 (available at the CDS). The estimated overall rms errors for one observation of one star are  ,
,  ,
,  ,
,  , and in V, b − y, m1, c1, and Hβ, respectively.
There are 191 stars in the previously observed sample for SA 171 and SA 173 (Franco 1988), which combined with the one introduced here makes a total of 543 stars for the entire set of selected areas.
Figure 1 depicts a portion of the large region containing the Gum nebula. The borders of the six observed selected areas of Kapteyn are superposed on a reddening E(B − V) image retrieved from the all-sky reddening map published by Schlegel et al. (1998, hereafter SFD98). For reference, the approximate borders of the Gum nebula, the IVS, and the Vela SNR are indicated, respectively, by the larger and smaller circles and the irregular contour. Two of these areas, SA 147 and SA 170, are only partially inside the Gum nebula’s border, while SA 171 also probes the line-of-sight towards the IVS. The remaining three areas probe different parts of the Gum nebula’s volume. The “star” signs indicate the lines-of-sight towards six stars for which interstellar Na i D lines spectra are also analysed (see Sect. 4).
3. Data analysis
3.1. Observed colour excesses
Intrinsic colours and absolute stellar magnitudes can be computed in the uvby-β system for stars of spectral types ranging from B to early/mid G-type stars, excluding A1 and A2 stars, following the calibrations suggested by Crawford (1975, 1978, 1979). To obtain intrinsic values with a high degree of confidence, a set of selection criteria were imposed on the observed sample. This procedure has the purpose of avoiding objects with peculiar indices in our final sample (a detailed description of the adopted selection criteria is given by Franco 1989). A total of 520 stars, from the combined samples, fulfilled the imposed selection criteria. About 96% of them belong to the late AF type star group.
 |
Fig. 2 Distribution of the obtained colour excesses for stars closer than 200 pc (bin = |

The standard deviations of the combined sample are slightly larger than the ones obtained for the new data introduced in Table 1, and are  , , ,
, , ,  , and
, and  , for V, (b − y), m1, c1, and Hβ, respectively. The overall accuracy of the obtained colour excesses can be estimated by propagation of the measurements errors into the calibrations. On the basis of the above-mentioned standard deviations, the mean accuracy of the colour excesses was estimated to be better than .
Figure 2 displays the obtained distribution of colour excesses for stars having estimated distances closer than 200 pc from the Sun. A total of 157 stars are found within this distance limit. For purpose of comparison, a standard normal (Gaussian) distribution centred on  and standard deviation
  is given by the shadowed area. The left side of the obtained distribution of colour excesses seems to be rather well-represented by the normal distribution, an indication that the estimated mean accuracy (
 ) is close to the true value for the investigated sample. The distribution of colour excesses clearly show a number of reddened stars that cannot be explained by measurement uncertainties alone, in particular, for the bin around
  . This reddening is likely to be associated with the absorption due to single small diffuse clouds. The reddening in a single cloud, eo, and the number of these clouds per unit length, ν, can be deduced by applying the method proposed by Münch (1952), which, in the present case, provides
  and ν = 4.1 clouds per kpc. These values are slightly smaller than the ones obtained by Knude (1979) for the solar vicinity, mainly the number of clouds per kpc, which in his case is about one and a half to two times larger than the value found here. This is understandable because the volume probed here seems to be more depleted than the average solar neighbourhood.
For a density of four clouds per kpc, it is expected that some observed lines-of-sight traverse a single diffuse cloud within the 200 pc distance interval, and that a few might even traverse two clouds, which would explain the small peak observed close to the  bin. The observed excess of stars with reddening around
  , however, remains unexplained.
3.2. Stellar distances
The accuracy of the photometric distance determination depends on the stellar spectral type. For the A- and F-type stars, it is estimated that the distances have, in average, an accuracy of better than 30%, while distances for late B-type stars are better than 20% and for early B-type stars better than 40%. An independent test of this accuracy can be obtained by comparing with parallactic distances obtained by the Hipparcos satellite. By searching in the new Hipparcos catalogue (van Leeuwen 2007) we discovered 37 stars in common with the photometric sample. The comparison between both estimated distances is shown in Fig. 3. In spite of the moderate trend for the photometric distances to be slightly underestimated compared to the parallactic one, the agreement for most stars is very good, testifying to the high quality of the photometric distance determination.
 |
Fig. 3 Comparison between the trigonometric distances obtained from the new Hipparcos catalogue (van Leeuwen 2007) and the photometric distances based on uvby-β data. The errors indicated for the photometric distances were estimated by propagating the measured photometric uncertainties into the calibrations of each star. The diagonal dashed-line is shown for reference only. |
3.3. Colour excess versus distance diagrams
The obtained colour excess versus distance diagrams for each observed area are given in Fig. 4. A common characteristic noted for all of these areas is the rather low level of interstellar absorption experienced by most of the observed stars, not only for the nearest of them, but out to about 1 kpc from the Sun.
As already mentioned, two of the observed areas have a line-of-sight that is partially outside the assumed rim of the Gum nebula. SA 170 seems to be the volume with the lowest interstellar density. The obtained colour excesses for this selected area do not exceed  and yield a mean colour excess of
 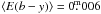 . All observed stars in SA 170 are basically closer than 400 pc from the Sun. Beyond that, there are only two other stars with estimated distances ranging from 700 pc to 800 pc and colour excesses not exceeding
  . The other area is SA 147, which is located about 15° to the north of SA 170. Taking into account only stars closer than 200 pc, except for one, the obtained mean colour excess for SA 147 is also . The excluded star is SA147.1218 (HD 55447). From the photometry, we estimated a colour excess
  and a distance of 153 ± 27 pc (the estimated parallactic distance is
  pc, van Leeuwen 2007). Beyond 200 pc, it is possible to note the effect of some interstellar absorption – the colour excess as a function of the distance shows a tendency to increase and the lower envelope of the data points distribution gets slightly higher.
While the two former selected areas have lines-of-sight through directions of rather low interstellar extinction (see Fig. 1), SA 148 probes a volume that is expected to have a higher absorption. Nevertheless, the obtained colour excess versus distance diagram for this area resembles those obtained for these areas. Out to about 320 pc, the derived colour excess does not exceed , with a mean colour excess of 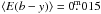 . Beyond the distance of 200 pc, there is clearly a slight increase in the value of the lower envelope of the data points, although, the maximum value remains constant up to about the aforementioned distance of ~ 320 pc, after what, some absorption sets up. Beyond ~ 400 pc the observed minimum colour-excess seems to increase. Although one star has a colour excess of
  at a distance of ~ 550 pc, the general behaviour of the colour excess seems to continue the same, that is, around
  up to about 800 pc. Our entire photometric sample contains eight stars with estimated distances larger than 1.0 kpc, five of then belonging to SA 148. The estimated colour excess for these stars are in the range from
  to
to  .
.
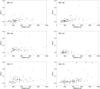 |
Fig. 4 Colour excess vs. distance diagrams obtained for each of the observed selected area. Three stars belonging to SA 173 present colour excess larger than |

SA 149 displays an interesting colour excess versus distance diagram. The eight closest stars (d < 170 pc) have  . Beyond this distance, the colour excess suffers a steep transition, which is clearly shown in terms of both an increase in the maximum absorption and the value of the lower envelope. Nevertheless, the maximum colour excess does not exceed
  , except in two cases (
 at d = 370 pc and
  at d = 590 pc).
The remaining two selected areas, SA 171 and SA 173, were previously analysed by Franco (1990), and the colour excess versus distance diagrams presented there are pretty similar to the ones given in the present work. Nevertheless, it is instructive to return to these areas, first of all, because new data have been incorporated into the observational sample (nine stars in SA 171 and thirty-two in SA 173). We note that the analysis conducted in the previous investigation was done prior to the knowledge of IVS towards the same line-of-sight.
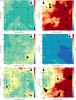 |
Fig. 5 SFD98 reddening images of the six selected areas: a) SA 147; b) SA 148; c) SA 149; d) SA 170; e) SA 171; and f) SA 173. The lines-of-sight for which colour excesses have been estimated are overlaid upon the images. The sizes of the symbols scale with the estimated value of E(b − y) according to the scale shown in the upper corner inset, the negative colour excesses being assumed to be null. The stellar sample was subdivided into three ranges of distances: d ≤ 200 pc (open circle), 200 < d ≤ 400 pc (filled upper half circle), and d > 400 pc (filled circle). (A colour version of this figure is available in the online journal.) |
The new distribution of colour excess as a function of the distance for SA 173 strengthens the previous result by the inclusion of about 50% more data points. Although four of the six most reddened stars in the observed stellar sample belong to SA 173, the observed colour excess towards this line-of-sight is, in general, rather low, averaging  . SA 173 is also the only area where stars with colour excess larger than
  have been detected at distances smaller than 1 kpc. One of these stars is SA173.0022, which at an estimated distance of 710 ± 80 pc and
  , is the most reddened star in the analysed sample. Two other stars with a rather large reddening and an estimated distance smaller than 1 kpc are SA173.0164, at 480 ± 90 pc and
  , and SA173.0970, at 860 ± 300 pc and
  . These rather large reddenings may be related to the interstellar material belonging to the outskirts of the VMR.
As a common characteristic of the observed selected areas, one notes that the lower envelope of the derived colour excesses increases with distance at distances greater than 200 pc from the Sun. Nevertheless, some lines-of-sight have quite low colour excesses ( ) even at distances larger than ~ 800 pc, characterising the low volume density of this region of the sky.
3.4. A comparison with SFD98’s interstellar reddening
An instructive comparison can be made between the estimated uvby-β colour excesses for the observed selected areas and the interstellar reddening map obtained by SFD98. This comparison is depicted in the panels shown in Fig. 5, where the estimated colour excess for the observed stars are overlaid upon the reddening maps. The size of the symbols scales with the measured colour excess according to the scale shown in the upper corner of the panels. To provide an idea of the distribution of the obtained colour excess as a function of the distance, the stellar sample was subdivided into three distance groups, which are represented by different symbols: open circles (the nearest group, d ≤ 200 pc); filled upper half circles (the intermediate group, 200 < d ≤ 400 pc); and filled circles (the farthest group, d > 400 pc). Moreover, to make the comparison between both results more quantitative, the SFD98 colour excess, E(B − V), was converted into E(b − y). This conversion was done assuming a “standard” interstellar medium, where E(b − y) ≈ 0.721 E(B − V).
The SFD98 reddening map provides an integrated colour-excess along the line-of-sight, while the measured stellar colour-excess provides the reddening out to the star’s distance. In addition, many authors (e.g., Arce & Goodman 1999; Dutra et al. 2003a; Cambrésy et al. 2005) agree that SFD98 may overestimate the reddening by a factor of 1.3 − 1.5 when E(B − V) exceeds values of about 0 2–03. However, a visual inspection of Fig. 5 suggests that there is, in general, a good correlation between both estimates of the interstellar absorption towards the analysed areas.
In particular, we note the good agreement obtained for SA 170 (Fig. 5 – panel d), which is the observed area with the lowest level of interstellar reddening. When the stellar lines-of-sight are used to retrieve the predicted SFD98 colour excess, E(B − V), one obtains values ranging from about 004 to 012, corresponding to approximately  . These values are a few hundredths of magnitude larger than the ones provided by the Strömgren photometry, although this may again be due to the predicted SFD98’s reddening providing the total column density, while the stellar sample probes the volume out to a distance of about 800 pc.
Despite the good agreement observed for the surveyed areas, a special word of caution seems appropriate regarding SA 148 and SA 173 (Fig. 5 – panels b and f, respectively). Both areas are located at low Galactic latitudes where most contaminating sources have not been removed from SFD98’s maps, meaning that their predicted interstellar reddening should not be fully trusted. Nevertheless, even for these areas the comparison between the estimated uvby-β colour excesses and SFD98’s reddening seems reasonable. These are the areas where one finds the stars with the largest reddening in the whole sample.
Selected area 171 (Fig. 5 – panel e) has the most interesting line-of-sight, not only because it is along the IVS, but also because it contains some cometary globules within its volume. There are twenty-two stars in the nearest group (d ≤ 200 pc) and the estimated colour excess is, in general, smaller than  , with only three exceptions. One exception is the star SA171.0550 (α2000 = 7h41m18s, δ2000 = −43°37′05′′), which has an excess of
  at an estimated distance of 144 ± 42 pc. Inspection of the area (Fig. 5 – panel e) shows that this line-of-sight coincides with a portion of relatively large reddening, suggesting that at least part of the absorption detected by SFD98 in this direction is due to dust material located nearer than 150 pc from the Sun.
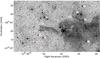 |
Fig. 6 Optical (DSS) image of the CG 4 and CG 6 region. The estimated data (colour excess and distance) for the identified stars are given in Table 2. |
3.5. Cometary globules
3.5.1. CG 4/CG 6
Figure 6 is an optical counterpart detail of the bottom right corner of Fig. 5 (panel e) and displays the region surrounding CG 4 and CG 6. The former, which is shown just to the left of the centre, has an impressive intricate structure. About half of a degree to the west of CG 4, there is a larger diffuse cloud known as Sa101, and north of this cloud one finds the other cometary globule, CG 6.
This region has been identified as a star-forming site. Reipurth & Pettersson (1993) found seven Hα emission objects, which are supposedly young stars related to these interstellar structures, and more recently Rebull et al. (2011) extended this number by identifying another 16 candidate young stars.
Colour excesses and distances have been obtained for eight stars in the region, as identified in Fig. 6 and shown in Table 2. Among these stars, four are supposedly closer than 200 pc, and have colour excesses of smaller than  . The remaining four stars, d > 200 pc, seem to be reddened by rather large colour excesses,
  . Unfortunately, the object with the largest reddening, SA171.0025, has a quite large uncertainty in its Hβ measurement (
 ), which causes a large inaccuracy in its distance determination. Nevertheless, the data listed in Table 2 suggest that there is a relatively large interstellar absorption around 200 pc from the Sun. It is, however, impossible to assure that this increase is related to the dust associated with CG 4/Sa101/CG 6. Rebull et al. (2011) proposed a yet greater distance (~500 pc) to ensure that the young objects in this region to have age comparable to those in Taurus. We note, however, that 200 pc is the distance suggested by Knude & Nielsen (2000) to the cometary globule complex, CG 30/31/38, which is also a low-mass star-formation site located about 12° to the north of the present complex.
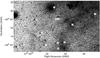 |
Fig. 7 Optical (DSS) image of the CG 5 region. The estimated data (colour excess and distance) for the identified stars are given in Table 3. |
Selected stars in the region of CG 4 and CG 6.
3.5.2. CG 5
CG 5 is not so impressive as CG 4, or even CG 6, and appears to be relatively small in the optical image displayed in Fig. 7, with dimensions of only about 4 arcmin. Table 3 gives the derived colour excess and distance to eleven stars with lines-of-sight around CG 5. One of these stars is SA171.0550, already discussed in the previous Section, which has a colour excess of almost  at a distance smaller than 200 pc. The other two stars closer than that have quite small reddenings (), while three stars located at distances ranging from 200 pc to 270 pc have reddenings similar that of SA171.0550 (
 ). Once more, it seems that there is some interstellar absorption around 200 pc from the Sun. Nevertheless, it is noteworthy mentioning that SFD98 predict quite larger colour excesses towards this line-of-sight than those obtained for these stars (see Fig. 5 – panel e, upper centre), suggesting that even if part of the reddening is produced at distances smaller than 200 pc, most of it has its origin beyond ≈ 1 kpc. The low density character of this volume is once again testified by the farthest object in this region, a B-type star (SA171.0314), which has a quite small reddening (
 ) for its estimated distance (d ≈ 2 kpc).
Selected stars in the region of CG 5.
4. Na i D lines
Spectra for six bright early-type stars in the Vela region were gathered as a by-product of an observational mission designed to observe the sodium D1 and D2 lines at 5896 Å and 5890 Å for stars towards the Southern Coalsack. The observations were performed at ESO (La Silla, Chile) in 1989 April by means of the Coudé spectrograph (CES) fed by the 1.4 m telescope. The spectra were extracted and calibrated using standard IRAF routines, as described in a previous paper (Franco 2000). Gaussian fits to the calibration spectral lines yielded an actual instrumental resolution (full width at half-maximum, FWHM) of 0.095 Å (or 4.8 km s-1), corresponding to a resolving power R ≈ 60 000. The spectral region surrounding the Na i D lines coincides with a strong concentration of telluric lines, notably of atmospheric water vapour. To remove these atmospheric lines from the stellar spectra, a synthetic telluric spectrum was constructed using the data listed by Lundström et al. (1991), that was then convolved with the instrumental resolution of the CES, and scaled to provide the corresponding intensity after correction for the air mass of the observations. Applying the synthetic spectrum proved to produce more accurate results than using the obtained spectrum of a lightly reddened early-type star (λ Sco) on the same nights that the programme stars were observed.
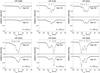 |
Fig. 8 Observed normalised interstellar Na i D absorption-line profiles (dots). The solid line shows the adopted fitted profile obtained with the parameters given in Table 4. The locations of the identified components are indicated by the tick marks. Telluric lines have been removed from the normalised profiles by applying a synthetic telluric spectrum (see text). The new Hipparcos stellar distance (van Leeuwen 2007) is given in the right-hand bottom of each panel. |
Theoretical absorption-line profiles were fitted to the observed spectra using the method described by Welty et al. (1994). In this analysis, each cloud component was characterised by a radial velocity, v, column density of absorbers, N, and velocity dispersion parameter, b. The calculated profiles were convolved with the instrumental resolution to enable comparison with the observations. The parameters v, b and N were adjusted by trial and error until a satisfactory fit was achieved for each one of the Na i D absorption lines. The best obtained fit for each star is shown in Fig. 8, and the derived parameters are given in Table 4. The radial velocities are referenced to the Local Standard of Rest (LSR) frame. To the Sun was assigned a velocity of 16.5 km s-1 in the direction l = 53°, b = + 25° as defined by Mihalas & Binney (1981), which is in close agreement to the value more recently obtained by Coşkunoǧlu et al. (2011) based on the kinematical analysis of almost 20 000 high-probability thin-disk dwarfs within 600 pc of the Sun.
HR 3089 is the nearest of the six observed stars. According to the latest reduction of the Hipparcos astrometric data (van Leeuwen 2007), this star is at a distance of  pc. In contrast to the observations of the other five stars, the Na i D lines have only one rather weak component. It is interesting to compare this result with the one obtained using photometric measurements. Adopting the relation between N(Na i) and N(H) proposed by Ferlet et al. (1985) and the one proposed by Knude (1978) to convert N(H) into E(b − y), the estimated Na i column density was used to infer a colour excess of
  , showing, once again, the low-density volume character towards this direction out to at least 200 pc. The Strömgren uvby-β photometric measurements obtained for HR 3089 (Grønbech & Olsen 1976, 1977), provide a colour excess
  and a distance of 378 ± 55 pc. Both estimates of colour excesses are consistent, however, the estimated photometric distance is about 60% larger than the one obtained by astrometric measurements.
The obtained column density (log N(Na i) = 10.91 cm-2) and equivalent width (Wλ(D2) = 13.87 mÅ), for this star, are slightly smaller than the value usually assumed for the “dense wall” of neutral gas that surrounds the Local Cavity (e.g., Welsh et al. 2010). However, from this measurement alone, it is impossible to determine whether this absorption is caused by either a large-scale interstellar structure or a single very diffuse cloudlet.
The multi-component Na i D line spectra observed for the remaining five stars attest to the complexity of the interstellar structure towards the Gum nebula direction. After excluding HR 3165, the other four stars seem to contain at least five or six interstellar components. These multi-component structure were found by previous investigations of the region (e.g., Cha et al. 1999; Cha & Sembach 2000).
Obtained Na i absorption-line parameters for the six stars observed spectroscopically towards the Vela region.
Adopting the aforementioned method to convert a sodium column-density to a colour excess, the measured total Na i column densities for these stars provide values that are in rather good agreement with the ones estimated from uvby-β photometry (Grønbech & Olsen 1976, 1977). Figure 9 compares both results. We note that the measured Hβ value for HR 3165 excludes this object from the range for which the Strömgren calibration is valid; for this reason, the colour excess was estimated from its UBV photometric data (Cousins 1972) and, in the case of HR 3294 the value estimated for the photometric colour excess is only obtained when the quite broad component (#5 in Table 4) is included to compute the total column density. For HR 3358, the estimated total Na i column density yields a colour excess that is about four times larger than the one obtained from photometric measurements. Since the line-of-sight to HR 3358 traverses the Vela SNR, a possible reason for this apparent dust depletion could be dust destruction by the action of the supernova’s shock wave.
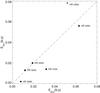 |
Fig. 9 Comparison between the estimated colour excess obtained by converting the measured Na i column density into reddening and the value provided by Strömgren photometry (see text for detail). The diagonal dashed-line is shown for reference only. |
Some of the fitted components are quite weak, and as for the component obtained for HR 3089, may be associated with the Local Cavity’s neutral wall, if it exists towards this line-of-sight. For instance, the component #1 in HR 3204 has characteristics that are very similar to the one observed for the former star. This could also be the case for component #1 in HR 3165.
On the basis of the estimated distances to the six observed stars, it is likely that the material constituting the front interface of the Gum nebula’s expansion shell is acting on the stellar light, except for the case of HR 3089, which is supposed to be a foreground object. HR 3358 may also be affected by the back interface. In the non-uniformly expanding model proposed by Woermann et al. (2001) for the Gum nebula, expansion velocities along the line-of-sight within the interval from − 13 to + 9 km s-1 are expected for the material composing the nebula’s shell. The component along the line-of-sight to the differential Galactic rotation towards this direction and at a distance ranging from 300 pc to 500 pc would contributes within the range 1 − 2 km s-1. None of the diffuse (log N(Na i) < 11 cm-2) components have velocities within the interval expected for the expansion shell, suggesting that they are probably due to single diffuse cloudlets. Some of the “more dense” components (log N(Na i) > 11 cm-2) may be associated with the expansion shell, although many of them are difficult to explain in a simple scenario.
Moreover, it is interesting to compare the results obtained for these six stars with the ones from previous investigations. Cha et al. (1999) and Cha & Sembach (2000) analysed the Ca ii and Na i absorption line profiles of 68 stars in the direction of the Vela SNR. These authors report, for some of the observed objects, the detection of high-velocity absorption components and, in some cases, line profile variabilities, which were both attributable to the shocked gas associated with the supernova remnant. Among the six stars discussed here, either the Ca ii, Na i, or both lines of four were studied by Cha & Sembach (2000). Although the number of components used to fit the observed spectra are not exactly the same, in general, the estimated component’s velocities agree to within about 1 km s-1. Cha & Sembach (2000) report the detection of weak high-velocity absorption components in the spectra of three of these four stars. According to those authors, the Ca ii spectrum gathered for HR 3250 (HD 69302) has a component at vlsr = + 40 km s-1, and the one collected for HR 3358 (HD 72108) a component at vlsr = −111 km s-1. None of these components were detected in the Na i D spectra introduced here, either because the sodium column densities for these components were much smaller than the one for the ionised calcium, or due to the variable character observed for some of the line profiles produced by shocked gas. The exception is HR 3294 (HD 70930), for which the reported component at vlsr = + 37 km s-1 observed in their Ca ii spectrum corresponds to component #1 of the Na i spectrum introduced here.
5. Discussion
Figure 10 gives the obtained colour excess versus distance diagram when the six observed selected areas are combined. To make the analysis easier, different symbols were used for each selected area. Some interface distances of interest are marked in this diagram. Each of them are related to a proposed scenario, as in the case of the dotted line, which gives the distance to the front face of the Gum nebula as suggested by Franco (1990) and Knude & Nielsen (2000); the dot-dashed line, which indicates the distance to the combined front face of the Gum nebula and the IVS proposed by Woermann et al. (2001); and the dashed lines that indicate, respectively, the distances to the front faces of the IVS and Gum nebula as suggested by Sahu & Blaauw (1993). The coloured band indicates the range of distances proposed for the Vela Molecular Ridge.
The combined diagram shows that very few stars have colour excesses larger than , none of which are closer than 200 pc. The derived mean colour excess for stars out to that distance is  , which corresponds to a hydrogen column-density of N(H) ≈ 1020 cm-2, that is basically the column density usually associated with the Local Cavity. An inspection of Fig. 10 suggests that there is a slight rise in the colour excess at a distance of ~100 pc, followed by a steep increase at ~150 pc, caused by one star belonging to SA 147 and two to SA 171, the former star being the one already mentioned in Sect. 3.3 for which the parallactic distance is about 250 pc. Stars belonging to SA 149 indicate that there is absorbing material at ~180 pc, but the level of the reddening is smaller than that observed for SA 171.
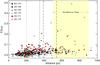 |
Fig. 10 Colour excess versus distance diagram obtained when all observed selected areas are combined. The symbols identify the selected area from where the data come from, according to the legend given in the left-hand upper part of the diagram. The vertical lines mark the distances proposed in previous investigations for: (a) the front face of the Gum nebula (dotted line, Franco 1990; Knude & Nielsen 2000); (b) the combined front face of the Gum nebula and IVS (dot-dashed line, Woermann et al. 2001); and (c) the front face of the IVS and Gum nebula, respectively, the left and right lines (dashed lines, Sahu & Blaauw 1993). The coloured band indicates the range of distances proposed for the Vela Molecular Ridge. (A colour version of this figure is available in the online journal). |
Apart from one star (SA173.0079), the colour excesses do not exceed up to ~350 pc. Beyond that distance, one finds three stars with reddenings in the range from to  at basically the same distance, d ≈ 370 pc. Nevertheless, one of these stars is SA171.0025 (star #1 in Table 2), which as already mentioned in Sect. 3.5.1, has a large uncertainty in its distance determination. The distances to the two other stars (SA149.0272 and SA173.0716) are estimated with an accuracy of about 25%. Since each one of these stars is located in a different selected area, it suggests that the experienced reddening may be due to an extended layer of absorbing material, which might be related to the front interface of the Gum nebula and the IVS, at the distance proposed by Woermann et al. (2001).
In an earlier investigation, Reiz & Franco (1998) obtained UBV linear polarisation data for stars distributed in 35 selected areas of Kapteyn. There are 71 stars measured polarimetrically in their sample belonging to the selected areas analysed here. As expected, the observed degrees of polarisation for these stars are usually low, although the mean signal-to-noise ratio of the data obtained in the B-band is rather good, ⟨ p/σp ⟩ ≃ 4.5. Figure 11 displays the unbiased value of the linear polarisation (i.e., po = 0 if p < σp or  if p ≥ σp), obtained for the B-band, versus the distance to these stars. Most of the stars out to ~200 pc have virtually null or low (<0.1%) linear polarisation. The exceptions are nine stars belonging to SA 148 (one star), SA 171 (two stars), and SA 173 (six stars), among which one of them is SA171.0195 (star #5 in Table 2). Beyond ~250 pc, the obtained minimum degree of polarisation rises sharply to po ≈ 0.1%, which is a clear indication that there is an extended diffuse interstellar structure at a distance of about 200–250 pc from the Sun towards this region of the sky. We note the quite high degree of polarisation presented by the stars that belong to SA 149 and are located farther away than ~200 pc from the Sun. This polarisation is probably due to the interstellar material responsible for causing the steep rise observed in the colour excesses of stars beyond about 150 pc (see left middle panel in Fig. 4).
Unfortunately, none of the three stars mentioned earlier, that have rather large colour excesses around 150 pc (see Fig. 10) have been observed polarimetrically. From the diagram of the colour excess, the selected area least affected by the interstellar medium is SA 170, which contains only one star with a degree of polarisation higher than 0.1% and many stars appear to be essentially unpolarised.
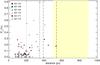 |
Fig. 11 Same as Fig. 10 for the unbiased B-band linear polarisation (Reiz & Franco 1998) versus distance diagram. (A colour version of this figure is available in the online journal.) |
6. Conclusions
We have analysed colour excess and distance obtained for 520 stars distributed in six small areas with lines-of-sight towards the Puppis-Vela direction. The main conclusions of this analysis are:
-
1.
The obtained colour excess versus distance diagram for stars belonging to these six selected areas confirms the low density character of the probed volume, out to a distance of ~1 kpc. The estimated colour excess for the analysed stellar sample rarely exceeds
. -
2.
Two of the observed selected areas, SA 147 and SA 170, have lines-of-sight almost tangent to the proposed rim of the Gum nebula. Most of the surveyed volume within these areas is supposed to be outside the nebula. Both volumes have very low levels of reddening, in particular SA 170, for which the mean colour excess out to a distance of 800 pc from the Sun is only
. For SA 147, the same low reddening was obtained
for stars closer than 200 pc. Beyond that, the reddening appears to increase,
indicating that a medium with slightly higher density has been reached. -
3.
High resolution Na i D-line spectra obtained for six stars with lines-of-sight towards the IVS consist of at least five or six interstellar components out to a distance of about 650 pc from the Sun. The exception is the nearest star, HR 3089, at a parallactic distance of ~230 pc, which contains only a single very diffuse component.
-
4.
Colour excess, polarisation, and absorption Na i D lines, all delineate a diffuse interstellar structure at a distance of about 200 − 250 pc from the Sun. The effects of this structure are more clearly evident in the diagram of colour excess versus distance obtained for SA 149 and by the quite high degree of polarisation observed for stars beyond 200 pc in this area.
-
5.
Although the data clearly show that there is absorbing interstellar material towards the investigated line-of-sight, that may consist of structures at different distances from the Sun, it is impossible to guarantee which one is associated with the Gum nebula’s front interface. Colour excesses obtained for three stars suggest that this interface may be at an approximate distance of 350 pc.
Acknowledgments
The author thanks the anonymous referee for a constructive and thorough review. The Danish Board for Astronomical Research and the ESO (European Southern Observatory) are thanked for allocating the observing periods at the Strömgren Automatic Telescope (Danish 50 cm). The Na i D lines profile fittings were performed with the help of a computer code kindly provided by Dr Daniel E. Welty, who is gratefully acknowledged. The author is grateful to the Brazilian agencies CNPq and FAPEMIG for partially supporting this investigation. This research has made use of the new Hipparcos catalogue, the Digitized Sky Survey produced at the Space Telescope Science Institute under US Government grant NAG W-2166, and the NASA/IPAC Infrared Science Archive operated by the Jet Propulsion Laboratory, California Institute of Technology, under contract with the National Aeronautics and Space Administration. This research has made extensive use of NASA’s Astrophysics Data System (NASA/ADS) and the SIMBAD database, operated at CDS, Strasbourg, France.
References
- Arce, H. G., & Goodman, A. A. 1999, ApJ, 512, L135 [NASA ADS] [CrossRef] [Google Scholar]
- Becker, F., & Brück, H. 1929–1938, Potsdam Spektral-Durchmusterung, 27–28 (Publ. Astrophys. Obs. Potsdam) [Google Scholar]
- Bica, E., Dutra, C. M., & Barbuy, B. 2003, A&A, 397, 177 [NASA ADS] [CrossRef] [EDP Sciences] [Google Scholar]
- Cambrésy, L., Jarrett, T. H., & Beichman, C. A. 2005, A&A, 435, 131 [NASA ADS] [CrossRef] [EDP Sciences] [Google Scholar]
- Cha, A. N., & Sembach, K. R. 2000, ApJS, 126, 399 [NASA ADS] [CrossRef] [Google Scholar]
- Cha, A. N., Sembach, K. R., & Danks, A. C. 1999, ApJ, 515, L25 [NASA ADS] [CrossRef] [Google Scholar]
- Chanot, A., & Sivan, J. P. 1983, A&A, 121, 19 [NASA ADS] [Google Scholar]
- Coşkunoǧlu, B., Ak, S., Bilir, S., et al. 2011, MNRAS, 412, 1237 [NASA ADS] [Google Scholar]
- Cousins, A. W. J. 1972, MNASSA, 31, 69 [NASA ADS] [Google Scholar]
- Crawford, D. L. 1975, AJ, 80, 955 [NASA ADS] [CrossRef] [Google Scholar]
- Crawford, D. L. 1978, AJ, 83, 48 [NASA ADS] [CrossRef] [Google Scholar]
- Crawford, D. L. 1979, AJ, 84, 1858 [NASA ADS] [CrossRef] [Google Scholar]
- Crawford, D. L., & Barnes, J. V. 1970, AJ, 75, 978 [NASA ADS] [CrossRef] [Google Scholar]
- Crawford, D. L., & Mander, J. 1966, AJ, 71, 114 [NASA ADS] [CrossRef] [Google Scholar]
- de Zeeuw, P. T., Hoogerwerf, R., de Bruijne, J. H. J., Brown, A. G. A., & Blaauw, A. 1999, AJ, 117, 354 [NASA ADS] [CrossRef] [Google Scholar]
- Dodson, R., Legge, D., Reynolds, J. E., & McCulloch, P. M. 2003, ApJ, 596, 1137 [NASA ADS] [CrossRef] [Google Scholar]
- Dutra, C. M., Ahumada, A. V., Clariá, J. J., Bica, E., & Barbuy, B. 2003a, A&A, 408, 287 [NASA ADS] [CrossRef] [EDP Sciences] [Google Scholar]
- Dutra, C. M., Bica, E., Soares, J., & Barbuy, B. 2003b, A&A, 400, 533 [NASA ADS] [CrossRef] [EDP Sciences] [Google Scholar]
- Ferlet, R., Vidal-Madjar, A., & Gry, C. 1985, ApJ, 298, 838 [NASA ADS] [CrossRef] [Google Scholar]
- Florentin Nielsen, R. 1985, A 6-channel uvby-β spectrophotometer for the Danish 50 cm telescope, Copenhagen Univ. Obs. Internal Report 9 [Google Scholar]
- Franco, G. A. P. 1988, A&AS, 73, 347 [NASA ADS] [Google Scholar]
- Franco, G. A. P. 1989, A&A, 215, 119 [NASA ADS] [Google Scholar]
- Franco, G. A. P. 1990, A&A, 227, 499 [NASA ADS] [Google Scholar]
- Franco, G. A. P. 1994, A&AS, 104, 9 [NASA ADS] [Google Scholar]
- Franco, G. A. P. 2000, MNRAS, 315, 611 [NASA ADS] [CrossRef] [Google Scholar]
- Frisch, P. C., Redfield, S., & Slavin, J. D. 2011, ARA&A, 49, 237 [NASA ADS] [CrossRef] [Google Scholar]
- Grønbech, B., & Olsen, E. H. 1976, A&AS, 25, 213 [NASA ADS] [Google Scholar]
- Grønbech, B., & Olsen, E. H. 1977, A&AS, 27, 443 [NASA ADS] [Google Scholar]
- Grønbech, B., Olsen, E. H., & Strömgren, B. 1976, A&AS, 26, 155 [NASA ADS] [Google Scholar]
- Gum, C. S. 1952, The Observatory, 72, 151 [NASA ADS] [Google Scholar]
- Hawarden, T. G., & Brand, P. W. J. L. 1976, MNRAS, 175, 19 [Google Scholar]
- Hoffleit, D. 1982, The Bright Star Catalogue, 4. rev. edn. (New Haven: Yale Univ. Obs.) [Google Scholar]
- Houk, N. 1978, in Michigan Spectral Survey, Ann Arbor, Dep. Astron., Univ. Michigan, 2 [Google Scholar]
- Houk, N. 1982, in Michigan Spectral Survey, Ann Arbor, Dep. Astron., Univ. Michigan, 3 [Google Scholar]
- Jeffries, R. D., Naylor, T., Walter, F. M., Pozzo, M. P., & Devey, C. R. 2009, MNRAS, 393, 538 [NASA ADS] [CrossRef] [Google Scholar]
- Knude, J. 1978, in Astronomical Papers Dedicated to Bengt Stromgren. (Copenhagen: Copenhagen Univ. Obs.), ed. A. Reiz, & J. Andersen, 273 [Google Scholar]
- Knude, J. 1979, A&A, 71, 344 [NASA ADS] [Google Scholar]
- Knude, J., & Nielsen, A. S. 2000, A&A, 362, 1138 [NASA ADS] [Google Scholar]
- Liseau, R., Lorenzetti, D., Nisini, B., Spinoglio, L., & Moneti, A. 1992, A&A, 265, 577 [NASA ADS] [Google Scholar]
- Lundström, I., Ardeberg, A., Maurice, E., & Lindgren, H. 1991, A&AS, 91, 199 [NASA ADS] [Google Scholar]
- May, J., Murphy, D. C., & Thaddeus, P. 1988, A&AS, 73, 51 [NASA ADS] [Google Scholar]
- Mihalas, D., & Binney, J. 1981, Galactic astronomy: Structure and kinematics, 2nd edn. (San Francisco: W. H. Freeman and Co.) [Google Scholar]
- Milne, D. K. 1968, Austr. J. Phys., 21, 201 [Google Scholar]
- Münch, I. G. 1952, ApJ, 116, 575 [Google Scholar]
- Murphy, D. C., & May, J. 1991, A&A, 247, 202 [NASA ADS] [Google Scholar]
- Netterfield, C. B., Ade, P. A. R., Bock, J. J., et al. 2009, ApJ, 707, 1824 [NASA ADS] [CrossRef] [Google Scholar]
- Pettersson, B. 2008, Handbook of Star Forming Regions, Volume II: The Southern Sky, ed. B. Reipurth (ASP Monograph), 43 [Google Scholar]
- Rebull, L. M., Johnson, C. H., Hoette, V., et al. 2011, AJ, 142, 25 [NASA ADS] [CrossRef] [Google Scholar]
- Reipurth, B. 1983, A&A, 117, 183 [NASA ADS] [Google Scholar]
- Reipurth, B., & Pettersson, B. 1993, A&A, 267, 439 [NASA ADS] [Google Scholar]
- Reis, W., Corradi, W., de Avillez, M. A., & Santos, F. P. 2011, ApJ, 734, 8 [NASA ADS] [CrossRef] [Google Scholar]
- Reiz, A., & Franco, G. A. P. 1998, A&AS, 130, 133 [Google Scholar]
- Sahu, M. S. 1992, Ph.D. Thesis, Rijksuniversiteit Groningen, The Netherlands [Google Scholar]
- Sahu, M., & Blaauw, A. 1993, in Massive Stars: Their Lives in the Interstellar Medium, ed. J. P. Cassinelli, & E. B. Churchwell, ASP Conf. Ser., 35, 278 [Google Scholar]
- Sandqvist, A. 1976, MNRAS, 177, 69 [Google Scholar]
- Schlegel, D. J., Finkbeiner, D. P., & Davis, M. 1998, ApJ, 500, 525 [NASA ADS] [CrossRef] [Google Scholar]
- van Leeuwen, F. 2007, A&A, 474, 653 [NASA ADS] [CrossRef] [EDP Sciences] [Google Scholar]
- Welsh, B. Y., Lallement, R., Vergely, J.-L., & Raimond, S. 2010, A&A, 510, A54 [NASA ADS] [CrossRef] [EDP Sciences] [Google Scholar]
- Welty, D. E., Hobbs, L. M., & Kulkarni, V. P. 1994, ApJ, 436, 152 [NASA ADS] [CrossRef] [Google Scholar]
- Woermann, B., Gaylard, M. J., & Otrupcek, R. 2001, MNRAS, 325, 1213 [NASA ADS] [CrossRef] [Google Scholar]
- Zealey, W. J., Ninkov, Z., Rice, E., Hartley, M., & Tritton, S. B. 1983, ApJ, 23, L119 [Google Scholar]
All Tables
Obtained Na i absorption-line parameters for the six stars observed spectroscopically towards the Vela region.
All Figures
|
Fig. 1 Detail of the investigated region. The reddening image was retrieved from the all-sky extinction map published by Schlegel et al. (1998). The borders of the areas observed photometrically are indicated by the red boxes. The approximate Gum nebula border is indicated by the large (orange) circle of radius ~18° centred at |
| In the text | |
|
Fig. 2 Distribution of the obtained colour excesses for stars closer than 200 pc (bin = |
| In the text | |
|
Fig. 3 Comparison between the trigonometric distances obtained from the new Hipparcos catalogue (van Leeuwen 2007) and the photometric distances based on uvby-β data. The errors indicated for the photometric distances were estimated by propagating the measured photometric uncertainties into the calibrations of each star. The diagonal dashed-line is shown for reference only. |
| In the text | |
|
Fig. 4 Colour excess vs. distance diagrams obtained for each of the observed selected area. Three stars belonging to SA 173 present colour excess larger than |
| In the text | |
|
Fig. 5 SFD98 reddening images of the six selected areas: a) SA 147; b) SA 148; c) SA 149; d) SA 170; e) SA 171; and f) SA 173. The lines-of-sight for which colour excesses have been estimated are overlaid upon the images. The sizes of the symbols scale with the estimated value of E(b − y) according to the scale shown in the upper corner inset, the negative colour excesses being assumed to be null. The stellar sample was subdivided into three ranges of distances: d ≤ 200 pc (open circle), 200 < d ≤ 400 pc (filled upper half circle), and d > 400 pc (filled circle). (A colour version of this figure is available in the online journal.) |
| In the text | |
|
Fig. 6 Optical (DSS) image of the CG 4 and CG 6 region. The estimated data (colour excess and distance) for the identified stars are given in Table 2. |
| In the text | |
|
Fig. 7 Optical (DSS) image of the CG 5 region. The estimated data (colour excess and distance) for the identified stars are given in Table 3. |
| In the text | |
|
Fig. 8 Observed normalised interstellar Na i D absorption-line profiles (dots). The solid line shows the adopted fitted profile obtained with the parameters given in Table 4. The locations of the identified components are indicated by the tick marks. Telluric lines have been removed from the normalised profiles by applying a synthetic telluric spectrum (see text). The new Hipparcos stellar distance (van Leeuwen 2007) is given in the right-hand bottom of each panel. |
| In the text | |
|
Fig. 9 Comparison between the estimated colour excess obtained by converting the measured Na i column density into reddening and the value provided by Strömgren photometry (see text for detail). The diagonal dashed-line is shown for reference only. |
| In the text | |
|
Fig. 10 Colour excess versus distance diagram obtained when all observed selected areas are combined. The symbols identify the selected area from where the data come from, according to the legend given in the left-hand upper part of the diagram. The vertical lines mark the distances proposed in previous investigations for: (a) the front face of the Gum nebula (dotted line, Franco 1990; Knude & Nielsen 2000); (b) the combined front face of the Gum nebula and IVS (dot-dashed line, Woermann et al. 2001); and (c) the front face of the IVS and Gum nebula, respectively, the left and right lines (dashed lines, Sahu & Blaauw 1993). The coloured band indicates the range of distances proposed for the Vela Molecular Ridge. (A colour version of this figure is available in the online journal). |
| In the text | |
|
Fig. 11 Same as Fig. 10 for the unbiased B-band linear polarisation (Reiz & Franco 1998) versus distance diagram. (A colour version of this figure is available in the online journal.) |
| In the text | |
Current usage metrics show cumulative count of Article Views (full-text article views including HTML views, PDF and ePub downloads, according to the available data) and Abstracts Views on Vision4Press platform.
Data correspond to usage on the plateform after 2015. The current usage metrics is available 48-96 hours after online publication and is updated daily on week days.
Initial download of the metrics may take a while.