Fig. 10

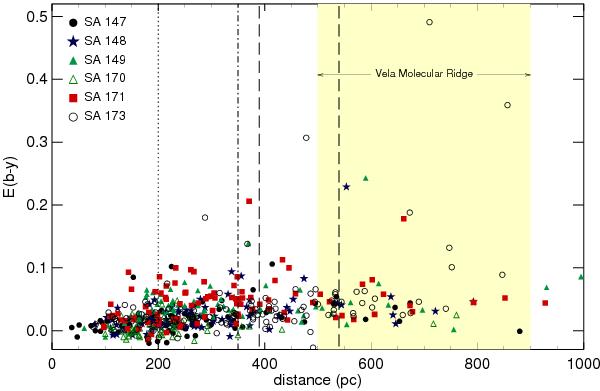
Colour excess versus distance diagram obtained when all observed selected areas are combined. The symbols identify the selected area from where the data come from, according to the legend given in the left-hand upper part of the diagram. The vertical lines mark the distances proposed in previous investigations for: (a) the front face of the Gum nebula (dotted line, Franco 1990; Knude & Nielsen 2000); (b) the combined front face of the Gum nebula and IVS (dot-dashed line, Woermann et al. 2001); and (c) the front face of the IVS and Gum nebula, respectively, the left and right lines (dashed lines, Sahu & Blaauw 1993). The coloured band indicates the range of distances proposed for the Vela Molecular Ridge. (A colour version of this figure is available in the online journal).
Current usage metrics show cumulative count of Article Views (full-text article views including HTML views, PDF and ePub downloads, according to the available data) and Abstracts Views on Vision4Press platform.
Data correspond to usage on the plateform after 2015. The current usage metrics is available 48-96 hours after online publication and is updated daily on week days.
Initial download of the metrics may take a while.


