Free Access
Fig. 2
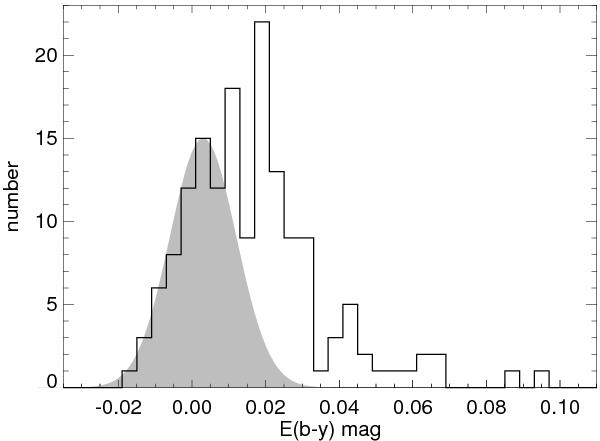
Distribution of the obtained colour excesses for stars closer than 200 pc (bin =  ). The shadowed area represents a standard normal (Gaussian) distribution centred on
  and a standard deviation
  , which is basically equal to the computed mean accuracy of the estimated colour excess (
 ).
).
Current usage metrics show cumulative count of Article Views (full-text article views including HTML views, PDF and ePub downloads, according to the available data) and Abstracts Views on Vision4Press platform.
Data correspond to usage on the plateform after 2015. The current usage metrics is available 48-96 hours after online publication and is updated daily on week days.
Initial download of the metrics may take a while.