Fig. 1
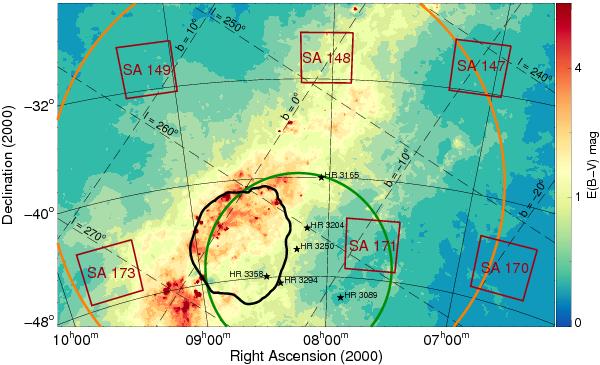
Detail of the investigated region. The reddening image was retrieved from the all-sky extinction map published by Schlegel et al. (1998). The borders of the areas observed photometrically are indicated by the red boxes. The approximate Gum nebula border is indicated by the large (orange) circle of radius ~18° centred at  ,
,  (l = 258°, b = −2°), while the small (green) circle indicates the IRAS-Vela shell border, with a radius of
  , centred at
  ,
,  (l = 263°, b = −7°) (adopted from Sahu 1992), and the black contour indicates the approximate border of the Vela SNR (adopted from Cha & Sembach 2000). The most intense absorption regions (255° ≤ l ≤ 275°, b = ± 5°) are likely associated with the Vela Molecular Ridge. The “stars” indicate the lines-of-sight to six stars observed spectroscopically, which are respectively identified by their HR numbers (Hoffleit 1982). (A colour version of this figure is available in the online journal.)
Current usage metrics show cumulative count of Article Views (full-text article views including HTML views, PDF and ePub downloads, according to the available data) and Abstracts Views on Vision4Press platform.
Data correspond to usage on the plateform after 2015. The current usage metrics is available 48-96 hours after online publication and is updated daily on week days.
Initial download of the metrics may take a while.