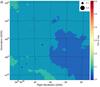
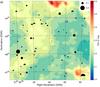
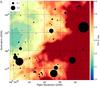
Fig. 5
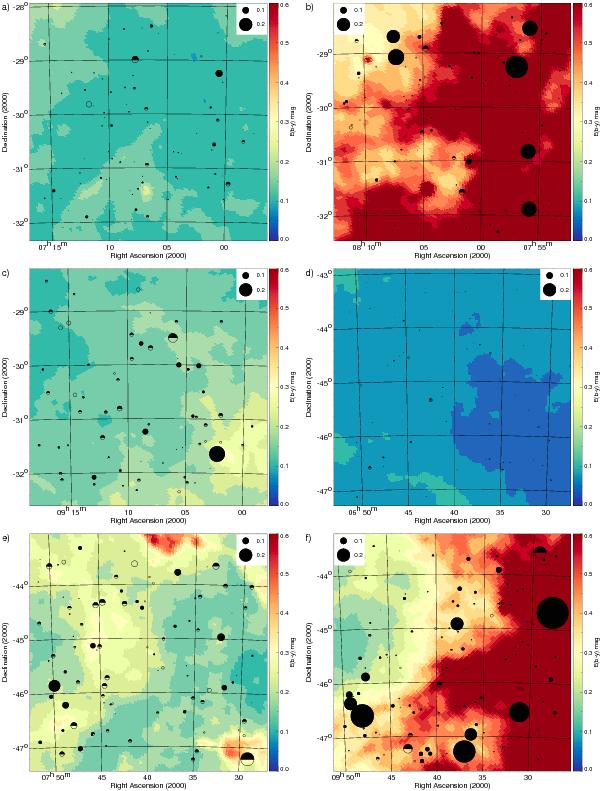
SFD98 reddening images of the six selected areas: a) SA 147; b) SA 148; c) SA 149; d) SA 170; e) SA 171; and f) SA 173. The lines-of-sight for which colour excesses have been estimated are overlaid upon the images. The sizes of the symbols scale with the estimated value of E(b − y) according to the scale shown in the upper corner inset, the negative colour excesses being assumed to be null. The stellar sample was subdivided into three ranges of distances: d ≤ 200 pc (open circle), 200 < d ≤ 400 pc (filled upper half circle), and d > 400 pc (filled circle). (A colour version of this figure is available in the online journal.)
Current usage metrics show cumulative count of Article Views (full-text article views including HTML views, PDF and ePub downloads, according to the available data) and Abstracts Views on Vision4Press platform.
Data correspond to usage on the plateform after 2015. The current usage metrics is available 48-96 hours after online publication and is updated daily on week days.
Initial download of the metrics may take a while.