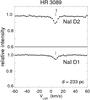
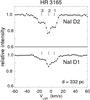
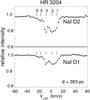
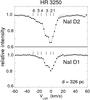
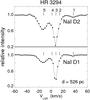
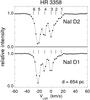
Fig. 8
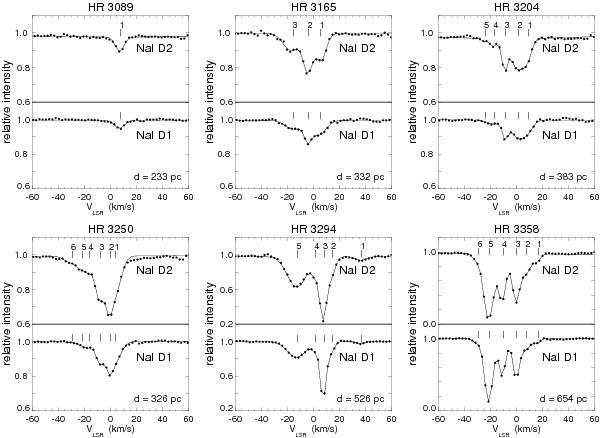
Observed normalised interstellar Na i D absorption-line profiles (dots). The solid line shows the adopted fitted profile obtained with the parameters given in Table 4. The locations of the identified components are indicated by the tick marks. Telluric lines have been removed from the normalised profiles by applying a synthetic telluric spectrum (see text). The new Hipparcos stellar distance (van Leeuwen 2007) is given in the right-hand bottom of each panel.
Current usage metrics show cumulative count of Article Views (full-text article views including HTML views, PDF and ePub downloads, according to the available data) and Abstracts Views on Vision4Press platform.
Data correspond to usage on the plateform after 2015. The current usage metrics is available 48-96 hours after online publication and is updated daily on week days.
Initial download of the metrics may take a while.