| Issue |
A&A
Volume 541, May 2012
|
|
|---|---|---|
| Article Number | A152 | |
| Number of page(s) | 9 | |
| Section | Interstellar and circumstellar matter | |
| DOI | https://doi.org/10.1051/0004-6361/201219005 | |
| Published online | 22 May 2012 | |
A population of isolated hard X-ray sources near the supernova remnant Kes 69
1
INAF – Osservatorio Astronomico di Palermo, Piazza del Parlamento
1, 90134
Palermo, Italy
e-mail: This email address is being protected from spambots. You need JavaScript enabled to view it.
2
A.F. Ioffe Institute for Physics and Technology,
194021
St. Petersburg,
Russia
e-mail: This email address is being protected from spambots. You need JavaScript enabled to view it.
3
Department of Astronomy, Nanjing University,
210093
Nanjing, PR
China
4
Key Laboratory of Modern Astronomy and Astrophysics (Nanjing
University), Ministry of
Education, PR China
5
St. Petersburg State Polytechnical University,
195251
St. Petersburg,
Russia
6
Dipartimento di Fisica, Università di Palermo,
Piazza del Parlamento 1,
90134
Palermo,
Italy
7
525 Davey Laboratory, Pennsylvania State University,
University Park, PA
16802,
USA
e-mail: This email address is being protected from spambots. You need JavaScript enabled to view it.
8
Purple Mountain Observatory, CAS, 2 West Beijing Road, 210008
Nanjing, PR
China
Received:
9
February
2012
Accepted:
5
April
2012
Abstract
Recent X-ray observations of the supernova remnant (SNR) IC 443 interacting with molecular clouds detected a new population of hard X-ray sources related to the remnant itself, which has been proposed to be fast ejecta fragments propagating within the dense environment. Encouraged by these studies, we obtained a deep XMM-Newton observation of the SNR Kes 69, which also shows signs of a shock-cloud interaction. We report on the detection of 18 hard X-ray sources in the field of Kes 69, which is a number sognificantly higher than expected for the Galactic source population in the field. The sources are spatially correlated with CO emission from the cloud in the remnant environment. The spectra of 3 of the 18 sources can be described as hard power-laws with photon indices smaller than two plus line emission associated with K-shell transitions. We discuss the two most promising scenarios for the interpretation of the sources, namely fast ejecta fragments (as in IC 443) and cataclysmic variables. While most of the observational evidence is consistent with the former interpretation, we cannot rule out the latter.
Key words: ISM: supernova remnants / X-rays: ISM / ISM: individual objects: Kes 69
© ESO, 2012
1. Introduction
High-resolution X-ray imaging of supernova remnants (SNRs) interacting with dense ambient matter has shown that a population of previously unknown compact sources are sometimes present in the field of view and visible at high X-ray energies (above ~2 keV). These are the X-ray shrapnels – the ballistically moving isolated fragments of ejected material radiating both thermal and non-thermal X-rays (Bykov et al. 2005, 2008).
Ejecta fragments have been known to exist for a long time (Aschenbach et al. 1995; Miyata et al. 2001; Laming & Hwang 2003). When they reach a dense cloud, they may become bright and compact sources in the infrared (IR, Bykov et al. 2008) and X-rays, with luminosities LX > 1031 erg s-1 (Bykov 2002, 2003). Since the fragment lifetime in the cloud is about a few hundred years, a few of these isolated sources are expected to be visible in the field of an SNR entering a molecular cloud. The shrapnel-type sources produce multicomponent X-ray spectra consisting of: (i) a relatively faint thermal continuum with kT ≲ 1 keV; (ii) a power-law nonthermal continuum with photon index ~1.5; and (iii) non-thermal line emission due to K-shell ionization produced by an intense flux of electrons (accelerated at the bow-shock) that collide with a metal-rich ejecta fragment.
The ballistically moving clumps are potentially an important source of information about the explosive supernova (SN) event. They presumably correspond to the initial ejecta inhomogeneities, located in the faster outer layers, and their chemical composition may be indicative of the nucleosynthesis processes that occurred at early stages of the SN evolution. Therefore, they provide information complementing that derived from the rest of the X-ray emitting ejecta. It should be noted, however, that a firm detection of an ejecta fragment is a challenging task, because the fragment lifetime is only a few hundred years, and the brighter the fragment, the shorter the lifetime.
Supernova remnants interacting with molecular clouds are the natural sites for studying the physics of fast fragments. One of the clearest example of this is IC 443, which emits bright molecular lines of OH, CO, and H2, excited by a shock. IC 443 is an extended object (about 45′ in size at a distance of about 1.5 kpc) and a bright GeV gamma-ray emitting SNR shell (Abdo et al. 2010). It is also a source of TeV gamma-rays (Albert et al. 2007). Hard X-ray sources in IC 443 related to shocked clumps have been detected by Bocchino & Bykov (2000) and studied in greater detail by Bocchino & Bykov (2003), Bykov et al. (2005), Bocchino et al. (2008), and Bykov et al. (2008).
Motivated by the results obtained in the SNR IC 443, we started an observational campaign to detect fast fragments in SNRs interacting with molecular clouds. A suitable target for this study was the SNR G21.8−0.6 (Kes 69), which is an extended incomplete radio shell of about 20′ in size (e.g., Shaver & Goss 1970) at an estimated distance of about 5.2 kpc (e.g., Tian & Leahy 2008; Zhou et al. 2009). The Imaging Proportional Counter aboard the Einstein Observatory was used by Seward (1990) to obtain a noisy X-ray image of Kes 69. Using ROSAT/PSPC observations, Yusef-Zadeh et al. (2003) estimated an absorbing column of NH = 2.4 × 1022 cm-2.
Spitzer observations of Kes 69 by Reach et al. (2006) and Hewitt et al. (2009) revealed the bright molecular emission lines of OH, CO, and H2, excited by a shock. In particular, the SNR contains a filament along the bright southern radio shell of ~15′ extension seen with Spitzer IRAC in the 4.5 μm band and attributed to the molecular hydrogen emission line, as well as an extended OH (1720 MHz) emission region that indicates the presence of a molecular shock (see Hewitt et al. 2009,and references therein). Millimeter band observations of CO and HCO+ lines toward Kes 69 performed by Zhou et al. (2009) provided strong evidence of an association between Kes 69 and the ~+85 km s-1 component of molecular gas.
The established interaction of Kes 69 with a molecular cloud makes this SNR a promising target for a search of shrapnel X-ray sources. Since the size of the remnant (about 20′) is comparable to that of the field of view of XMM-Newton EPIC cameras, we conducted XMM-Newton observations of the field to study the faint population of hard compact X-ray sources and look for the signature of fast ejecta fragments. Here we report the detection of 18 sources in the field of Kes 69, significantly in excess of that expected for Galactic field sources of the same flux. We have found some of these sources to emit hard power-law spectra with possible Kα X-ray lines of Si, Fe, Ca, and Ti. These spectra support the suggested shrapnel nature of the sources.
2. XMM-Newton observations and data analysis
The field of Kes 69 was observed with the XMM-Newton observatory (Jansen et al. 2001) on 2009 October 8 (ObsID 0605480101, PI: M. Miceli) for 60 ks with both the EPIC-MOS camera (Turner et al. 2001) in the full frame mode and the EPIC-PN camera (Strüder et al. 2001) in the extended full frame Mode (the medium filter was used for all the cameras). In the course of the XMM-Newton data reduction, we selected EPIC events with FLAG = 0, patterns 0−4 for EPIC-PN camera, and patterns 0−12 for EPIC-MOS cameras.
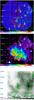 |
Fig. 1 Upper panel: EPIC PN count map of Kes 69 obtained in the 3−10 keV band. The bin size is 4′′. The white circles indicate point-like sources detected in this image; the red contours denote intensity of the 1.4 GHz emission from the NVSS survey (Condon et al. 1998); the green contours denote the 12CO (J = 1−0) intensity in the 80−81 km s-1 velocity range (see lower panel). The yellow cross denotes the position of the hard X-ray excess seen with INTEGRAL ISGRI. Middle panel: adaptively smoothed (to a signal-to-noise ratio of 16) and vignetting-corrected EPIC count-rate image (MOS-equivalent counts per second per bin) of Kes 69 in the 1−3 keV band. The black rectangle is the region used to extract the spectrum of the diffuse emission. The superimposed hard X-ray sources and the radio contours are the same as in the upper panel. Lower panel: 12CO (J = 1−0) intensity map in the velocity interval 80−81 km s-1 (linearly interpolated to a resolution of 0 |

To filter out periods of enhanced particle background, the original event lists were screened by using the sigma-clipping algorithm of the ESAS software1. After the filtering, the net good time exposure of the field was reduced to about 54 ks. SAS v9.0.0 was used for EPIC data processing, and the HEASOFT 6.3 suite, including XSPEC v.12.3.1, was used for spectral fitting.
List of sources detected in the 3−10 keV band in the field of view of the XMM-Newton observation of the Kes 69 SNR.
3. Results
3.1. Diffuse emission
Hard (3–10 keV) and soft (1−3 keV) X-ray maps of Kes 69 are shown in Fig. 1. Diffuse X-ray emission is clearly seen in the latter map. The diffuse emission region is bordered by the radio emission contours obtained from the 1.4 GHz NVSS survey (Condon et al. 1998). No significant diffuse emission is found on the hard X-ray map, while several point-like sources are present. We verified that the brightest fluctuation of the residual diffuse emission in the hard X-ray map is only 3σ above the background. The faint fluctuations generally correlate with the bright soft X-ray emission, so we argue that the very faint hard diffuse emission is the tail of the thermal emission visible in the soft X-ray map, and we do not consider it any further.
The spectral analysis of the diffuse extended emission of a mixed morphology SNR requires a thorough modeling of multiple components, both thermal (with possibly overionized plasma) and nonthermal. Such a detailed analysis of the diffuse soft X-ray emission of Kes 69 is beyond the scope of this work. However, to estimate the absorption column toward this remnant and compare it to the absorption of the compact sources, a spectrum of the extended diffuse emission region in the southern shell (shown as black rectangle in the middle panel of Fig. 1) has been extracted and fitted with the absorbed thermal plasma mekal model. For the spectral fitting, a channel binning with at least 15 counts per bin was used. The fitting yielded NH = (2.8 ± 0.4) × 1022 cm-2, T = (0.8 ± 0.2) keV (errors are at the 99% confidence level). The absorption column depth is consistent with that derived previously from the Einstein and ROSAT observations. The higher temperature in the ROSAT fit derived by Yusef-Zadeh et al. (2003) is most likely due to the contribution of the point sources unresolved by ROSAT in the wide region analyzed. The postshock temperature T ≈ 0.8 keV corresponds to the estimated age of about 10 000 years, assuming the Sedov stage solution. The forward shock velocity can be estimated as ~1000 km s-1. The velocities of the isolated ejecta fragments in the vicinity of the shell should be comparable to the shock velocity.
3.2. Hard X-ray sources detection and spectroscopy
The SAS task edetect_chain was applied to the 3−10 keV image to detect and study the population of point-like sources in the field of Kes 69 and to identify the sources likely associated with this remnant. The thermal emission from the SNR makes almost no contribution in the energy band chosen. Eighteen sources, whose properties are listed in Table 1, were detected with the likelihood above 30σ (marked in Fig. 1). The positions of the hard X-ray sources are remarkably well correlated with the 12CO emission at the velocity associated with the SNR (80−81 km s-1, Zhou et al. 2009), whose image and contours are shown in Fig. 1. This correlation can be more clearly seen in Fig. 2, which shows that the average brightness CO temperature at the location of the 18 sources is higher than the average cloud brightness temperature, which means that the hard X-ray sources tend to be preferentially found in dense regions indicated by their bright CO emission (see Appendix A for details about this method). The general correlation between the source position and the molecular cloud that is interacting with the remnant ensures that these sources are good candidates for X-ray emitting ejecta fragments.
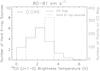 |
Fig. 2 Histogram of brightness temperature values in the 12CO maps in the 80−81 km s-1 velocity range (solid line, Zhou et al. 2009, also visible in the lower panel of Fig. 1) which shows the molecular cloud interacting with the remnant. On this, we superimpose the histogram of the same temperatures at the location of the 18 hard X-ray sources detected in the XMM-Newton observation (dashed line). The r value is the Pearson correlation coefficient, which indicates that there is a positive correlation (see Appendix A for details). The source peak is offset toward higher values than the cloud mean value, indicating that X-ray sources cluster at brighter-than-average CO map points. |
We extracted the EPIC spectra for all the sources rebinned to achieve a signal-to-noise ratio greater than four per bin, and fitted simultaneously both MOS and PN spectra. The ancillary response files were produced with the SAS ARFGEN task, and the EVIGWEIGHT task (Arnaud et al. 2001) was used to correct for vignetting effects. An empty area in the northeastern part of the image was used as a background region. Parameters of our power-law fits to the spectra of the point-like hard sources are listed in Table 1.
The sources (hereafter Srcs) 3, 5, and 18 were selected for a detailed study based on the possible presence of X-ray emission lines in their spectrum, which are similar to those expected in fast moving ejecta knot according to Bykov (2002). The lines in sources 3 and 5 can be interpreted as the Fe line complex and traces of the 1.8 keV Si line. The observed line features at 3.5 keV and 4.7 keV in Src 13 could originate from 40Ca and 48Ti, respectively.
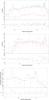 |
Fig. 3 XMM-Newton EPIC-PN (black) and MOS2 (red) spectra of Src 5 (upper panel), Src 3 (middle panel), and Src 13 (lower panel) with best-fit models (power law plus two narrow Gaussians) and residuals. |
The spatial count distributions of Srcs 3, 5, and 13 are consistent with that of a point source. We note here that with the few arcsec resolution of XMM-Newton the upper limit to a point-like source extension at the estimated distance of 5.2 kpc is about 1017 cm.
Two circular regions of 16′′ radius centered at Srcs 3 and 5 were chosen for spectral analysis. Unfortunately, both sources were projected onto the damaged MOS1 CCD6 chip; therefore only PN and MOS2 events were taken into account. For spectral analysis of Src 13 a circular region of 20′′ radius containing 160 PN counts was chosen. A ten counts per bin PN spectrum was used to locate the positions of line features in the spectrum.
3.2.1. Source 5
Source 5 was first detected by Hands et al. (2004) in the XMM-Newton Galactic Plane Survey (XGPS). This source is brighter than Srcs 3 and 13, and its spectrum is shown in the upper panel of Fig. 3. A simple absorbed power-law model provides χ2 = 63.9 (at 46 d.o.f.), but it does not fit the bright line-like features visible at about 1.8 keV and 6.5 keV. The quality of the fit improves significantly by adding two narrow Gaussians to describe the lines2. We found that the line energies are  keV and
  keV, respectively, the photon index is
  , and the improved χ2 is 47.8 (at 43 d.o.f.). Confidence contours for the line normalization coefficients and line energies are shown in the upper panels of Fig. 4. The line features can be associated with the K-shell transitions of Si (at 1.85 keV) and Fe (at 6.64 keV) originating from a metal-rich ejecta knot. Assuming that the source is at the same distance of 5.2 kpc as Kes 69, the line luminosities are ~6 × 1039 photons s-1 for the Si line, and ~3 × 1039 photons s-1 for the Fe line (with relatively large uncertainties, as shown in Fig. 4, upper panels). Both these values and the ratio of the Si to Fe line luminosities agree with those predicted for fast (~2700 km s-1) and small (size of 3 × 1016 cm) ejecta knots of mass 10-3 M⊙ moving inside a dense (~103 cm-3) molecular cloud (see Table 1 in Bykov 2002, where luminosities for a fragment are shown).
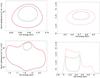 |
Fig. 4 Confidence contours of the line centroid and normalization for the Fe (upper left) and Si (lower left) lines in Src 5, and for the 48Ti (upper right) and Ca (lower right) lines in Src 13. The contours correspond to the 68% and 90% confidence levels. |
We investigate a possible thermal origin of Src 5 by fitting its spectrum with an absorbed thermal model. Although the probable Si line is not well described by this model, the quality of the fit is still acceptable (χ2 = 52.3 at 46 d.o.f.). The best-fit parameter values for the thermal fit are kT =  keV and NH = (
 ) × 1022 cm-2. Since in the thermal scenario the column density is higher than that found for Kes 69, a lower limit to the distance to Src 5 is 5.2 kpc (i.e. the distance to the remnant), and its X-ray luminosity is >1033 erg/s. These extreme values can be indicative of a very energetic coronal flare, since X-ray luminosities of up to ~1033 erg s-1 and temperatures up to 10 keV have been observed in the most energetic flares of active stars (e.g., Favata et al. 2005). Another possible source of such a high temperature and luminosity could be a cataclysmic variable star (CV). Nevertheless, we point out that by comparing the source count-rate in our observation with that observed by Hands et al. (2004) in the XGPS observations (17.1 ± 0.7 PN counts/ks and 19.3 ± 3.8 PN counts/ks, for Srcs 3 and 5, respectively, in the 0.4−6 keV band), we found that the source luminosity is consistent with being constant. In addition, the hardness ratio of 0.75 obtained by Hands et al. (2004) is very similar to the value of 0.70 ± 0.05 obtained in our new observation. The stationarity of the X-ray luminosity and hardness ratio both concur to ensure that a coronal flaring or a CV origin of Src 5 is unlikely, though still not excluded (see also Sect. 5).
3.2.2. Source 3
The background-subtracted spectrum of Src 3 is shown in the middle panel of Fig. 3. This spectrum is substantially absorbed (model NH values are about 1022 cm-2 – consistent with that of the soft diffuse emission from the remnant), and contains line-like features at about 1.8 keV and 6.7 keV. As in Src 5, we fixed the NH to 4 × 1022 cm-2, and found that a power-law model with Γ =  and two narrow Gaussians3 describes the spectra significantly better than a simple power-law model (χ2 = 20.4 at 21 d.o.f., and χ2 = 28.5 at 22 d.o.f., respectively). Assuming that Src 3 is at 5.2 kpc, the Fe line luminosity is (1.6 ± 0.9) × 1039 photons s-1 and the Si line luminosity is <6 × 1039 photons s-1. The best-fit values are in good agreement with those predicted by Bykov (2002) for a supersonic ejecta fragment propagating in a molecular cloud, the only difference from Src 5 being a smaller best-fit velocity (~1000 km s-1). We investigated a possible thermal origin of Src 3 by fitting its spectrum with an absorbed thermal model and found that, with such a model, we can only constrain the temperature to be above 7 keV.
3.2.3. Source 13
A background-subtracted spectrum of Src 13 is shown in the lower panel of Fig. 3. The spectrum contains line-like features at about 3.5 keV and 4.7 keV. Confidence contours for the line normalization coefficients and line energies are shown in the lower panels of Fig. 4. A power-law model with Γ =  and two narrow Gaussians at fixed energies fits the spectrum (χ2 = 11.0 at 31 d.o.f.). The line luminosities at 5.2 kpc are about 7.3 × 1038 photons s-1 and 1.7 × 1039 photons s-1 for the 3.5 keV and 4.7 keV lines, respectively, in agreement with the range of values predicted for an ejecta fragment in a molecular cloud. Unlike the spectra of Src 3 and 5, the spectrum of Src 13 does not show Fe complex line features, a fit with a thermal model is much worse than the non-thermal one.
Fluxes of possible infrared counterparts to Srcs 3, 5, and 13.
4. Hard X-ray INTEGRAL ISGRI data of Kes 69
The field of Kes 69 was a target of Galactic plane scans performed by the INTEGRAL gamma-ray observatory. The archival data obtained with the ISGRI camera during the scans comprise about 1700 ks of fully coded field of view observations in the years 2002−2010.
A weak hard X-ray source is marginally seen in the central part of the remnant (see the upper panel of Fig. 1). The source position is close to the projected center of an imaginary triangle with vertices in Srcs 3, 5, and 13. The HEAVENS4 survey (Walter et al. 2010) provides 3σ detections in the 18−50 keV and 50−150 keV bands (see the lower right panel of Fig. 3). To estimate the hard X-ray flux of the sources, intercalibration with a bright nearby SNR G21.5−0.9 (e.g., Krivonos et al. 2007) was performed to yield 5.7 × 10⁻¹² erg cm-2 s-1 in the 18−60 keV band, and 1.2 × 10⁻¹² erg cm-2 s-1 in the 60−120 keV band.
The highest plasma temperatures consistent with the XMM-Newton data, discussed in Sect. 3, are too low to yield an ISGRI detection above 60 keV. Thus, the detection of the INTEGRAL source associated with Kes 69 is evidence in favor of a non-thermal origin of the emission from (at least some of) the compact sources of this remnant. The power-law models for Srcs 3, 5, and 13 fitted to the XMM-Newton data yield (1−5) × 10-12 erg cm-2 s-1 in the 18−60 keV band, which is compatible with the flux detected by ISGRI in the same band. The extrapolation of the power-law model of the three sources to the 60−120 keV band would yield a flux higher than the flux observed by ISGRI in that band. Therefore, if the sources were indeed the X-ray counterparts to the ISGRI emission, a spectral break would be required around 60 keV.
5. Infrared imaging and photometry of Kes 69
The field of Kes 69 was the target of Spitzer MIPS observations r15602176, r15584768, r15621120, r15634432, and r15627008, performed on 2005 Sep. 30 (PI: S. Carey) and Spitzer IRAC observations r12103680, r12107264, and r12110592, performed on 2004 Oct. 07 (PI: E. Churchwell).
The standard MOPEX 18.4.9 software (Makovoz et al. 2006) was used to construct mosaic images and detect point sources from the archival BCD-level data pre-processed by the S18.7.0 (IRAC) and S18.12.0 (MIPS) pipelines. The net exposure of the mosaic maps was equal to 2−5 frames of 1.2 s (IRAC) and 10−18 frames of 2.62 s (MIPS).
Two point-like sources were found in the immediate vicinity of Src 3 (see the upper panels of Fig. 5) at  , δ = −10°13′49′′ (source o31, 6.2″ from the X-ray source) and at
  , δ = −10°13′53′′ (source o32, at 4.7″). Two point-like sources were found in the immediate vicinity of Src 5 (see the lower panel of Fig. 5) at
  , δ = −10°11′45′′ (source o51, at <1″ from the X-ray source) and
  , δ = −10°11′46′′ (source o52, at 4.3″). All these positions are in the J2000 reference frame. Another point-like source is clearly seen at about 2′′ from Src 13 (see Fig. 6) at
  , δ = −10°00′48′′ (source o13).
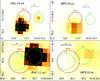 |
Fig. 5 Environments of Src 3 (top panels) and Src 5 (bottom panels) as seen by Spitzer IRAC camera at 3.6 and 4.5 μm, and MIPS at 24 μm. The sources 3 and 5 detected by XMM-Newton are shown as solid red circles, while the IR sources are shown as dashed green circles, both with labels with names referred to in the text. |
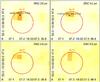 |
Fig. 6 Close environments of Src 13 as seen with Spitzer IRAC at 3.6, 4.5, 5.8, and 8.0 μm. The red circle marks the position of the XMM-Newton detected source. |
The source o52, listed in the USNO-B1.0 catalog (Monet et al. 2003), has B = 17.7, R = 14.1, which means that it is most likely a foreground star. The other four sources can be treated as the possible infrared counterparts of Srcs 3, 5, and 13. Med-IR fluxes of these sources measured with MOPEX and near-IR fluxes listed in the 2MASS survey (Skrutskie et al. 2006) are summarized in Table 2 along with extinction factors.
As no specific data can be found in the available catalogs to estimate the distances and velocities or somehow indicate the nature of the IR sources that are possibly connected with Srcs 3, 5, and 13, it is useful to compare the IR colors of sources o51, o31, o32, and o13with those typical of various classes of objects, paying particular attention to ejecta fragment candidates and CVs, which have been pointed out as plausible interpretations of Srcs 3, 5 and 13.
The FI1/FI3 and FI2/FI4 flux ratios of sources o51, o31, o32, and o13are larger than those in Fig. 2 of Reach et al. (2006), which contains examples of IRAC flux ratios of shock-excited zones in SNRs. The mI1 − mI2 and mI2 − mI3 colors of sources o51, o31, o32, and o13 are well within the range of IRAC colors reported by Stolovy et al. (2006) and Gezari et al. (2006) for faint X-ray sources in the Galactic center region, which are usually interpreted as accreting binaries. The IR spectral energy distribution of a CV source AE Aqr reported by Dubus et al. (2007) is similar to that of source o32, but the 24 μm flux of source o32 rescaled to the distance of AE Aqr (102 pc) appears much lower. Thus, the assumption that the potential IR counterparts of Srcs 3 and 5 are CVs seems unlikely, although there is also no firm evidence for detection of an ejecta fragment in the IR bands. However, it should be noted that the ~1034 erg s-1 IR luminosities of the possible counterparts to Srcs 3, 5, and 13 are within the range predicted for IR emission of ejecta fragments interacting with molecular clouds (see e.g. Bykov et al. 2008).
6. Discussion
6.1. Interpretation as ejecta fragments
The apparent correlation of the location of the hard X-ray sources detected in the field of Kes 69 with the CO emission of molecular material associated with the remnant, in addition to the consistent values of absorbing columns obtained from X-ray spectra of the sources, naturally leads to an SNR-related interpretation. Moreover, there is an apparent excess of sources with 2−10 keV fluxes above (2−3) × 10-14 erg cm-2 s-1 within a region of about 15′ × 20′ in size where the SNR is interacting with the molecular cloud (shown in Fig. 1). The log (N) − log (S) statistics of X-ray sources in the XGPS by Motch et al. (2010) predicts about 40 sources of 2−10 keV flux above 3 × 10-14 erg cm-2 s-1 per square degree. Therefore, only about 3−4 Galactic field sources are expected in the region on statistical grounds. The X-ray luminosities of the sources are LX ≳ 1031 erg s-1 if they are located at the estimated distance of Kes 69.
If the source are related to Kes 69, then isolated “shrapnels” or “knots”, associated with fast moving ejecta fragments, form an interesting explanation of hard X-ray sources in the field of SNRs. A massive individual fragment moving supersonically through a molecular cloud would have a luminosity LX ≳ 1031 erg s-1 in the 1−10 keV band and be observable with XMM-Newton and Chandra from a few kpc distance. Such fragments have indeed been detected in hard X-rays inside the IC 443 SNR (Bocchino et al. 2008; Bykov et al. 2008, and references therein), and the X-ray sources in Kes 69, which is also interacting with molecular material (Zhou et al. 2009), can also be interpreted in the same way.
The model of fast supernova fragments predicts two X-ray emission components (Bykov 2003). The first one is thermal X-ray emission from a hot shocked ambient gas behind the fragment bow shock, with the spectrum of an optically thin thermal shocked plasma of interstallar medium abundance. The second emission component is nonthermal. Interaction of the fast electrons (accelerated at the fragment bow-shock) with the fragment body produces both hard continuum and X-ray and IR line emission, including the K-shell lines of the Si and Fe group elements (Bykov 2002)5.
As mentioned in Sect. 3.2, the upper limit to a point-like source extension at the estimated distance of 5.2 kpc is about 1017 cm. Individual compact fragments of scale sizes below ~1017 cm would be optically thick to the K-shell X-ray line absorption if the metal content in the source exceeded about 10-4 M⊙. For Li-like to F-like ions, the probability of auto-ionization by a Kα photon (i.e., the resonant Auger destruction) is indeed significantly larger than that of photon re-emission (see, e.g., Liedahl 2005), resulting in the true line photon absorption. The line optical depth τX with respect to the resonant absorption of a Kα line of energy EX (in keV) for an element X (of atomic weight A) can be estimated as ![Mathematical equation: \begin{equation} \tau_{X} \!\simeq\! 3\cdot {f_{lu} \over 0.5} \cdot {\xi_{X^i} \over 0.4} \cdot A^{0.5} \cdot {N}_{X,17} \left[ T_6 \!+\! A \cdot (2.3\!\times\!10^3 \beta_{\sigma_v})^2 \right]^{-0.5} E_{X}^{-1}, \label{depth} \end{equation}](/articles/aa/full_html/2012/05/aa19005-12/aa19005-12-eq185.png) (1)where ξXi is the relative abundance of the ion i of the element X, NX,17 is the column density of the element X in the source along the line of sight in units of 1017 cm-2, and flu is the relative line oscillator strength of the Kα line. The characteristic line width is assumed to be equal to the Doppler full width at half maximum, in which both the thermal ion velocity for temperature T = 106·T6 K and the micro-turbulent velocity (βσv = σv/c) are accounted for (see, e.g., Nicastro et al. 1999).
(1)where ξXi is the relative abundance of the ion i of the element X, NX,17 is the column density of the element X in the source along the line of sight in units of 1017 cm-2, and flu is the relative line oscillator strength of the Kα line. The characteristic line width is assumed to be equal to the Doppler full width at half maximum, in which both the thermal ion velocity for temperature T = 106·T6 K and the micro-turbulent velocity (βσv = σv/c) are accounted for (see, e.g., Nicastro et al. 1999).
This implies, in particular, that the line fluxes of these fragments are expected to be about 1031 erg s-1 for most of the X-ray lines, and that, for example, 40Ca and 48Ti line fluxes are expected to be comparable, even though the 40Ca abundance typically exceeds that of 48Ti in supernova ejecta (line saturation effect). The maximal model yields of 48Ti in core-collapsed SNe range from about 4 × 10⁻⁵ M⊙ (Woosley & Weaver 1995) to 2 × 10⁻⁴ M⊙ (Thielemann et al. 1996), and are subject to rather substantial model uncertainties. Although core-collapsed SNe are naturally associated with molecular cloud environments (see e.g. Jiang et al. 2010, and reference therein), a SN Ia type origin cannot be excluded for Kes 69, since it has never been found to contain a compact remnant. According to the models of SN Ia nucleosynthesis developed by Maeda et al. (2010), the yield of 48Ti can exceed 10-3 M⊙ in SN Ia ejecta. Therefore, one may conclude that some ejecta fragments can have line emission of 48Ti at the level estimated at 68% significance in Src 13 without any signs of 44Ti, which is expected to decay at the estimated age of Kes 69. In conclusion, both the location, the X-ray spectra and the infrared counterpart of Srcs 3, 5, and 13 are consistent with the expectations for supernova ejecta fragments interacting with a dense ambient medium.
6.2. Alternative explanations
The X-ray spectra of Srcs 3, 5, and 13 may also be fitted with a very hot thermal component. We have therefore explored other explanations for the detected sample of hard X-ray sources. Accreting dwarfs and stars with active coronae can be sources of hard X-ray emission (e.g. Fabian et al. 1976; Cordova et al. 1981; Patterson & Raymond 1985) and are therefore an interesting possibility. The X-ray luminosity of some CVs can reach up to LX ~ 1034 erg s-1 (see e.g. Stacey et al. 2011), but the majority of CVs are much fainter. The integrated emission of CVs, especially of intermediate polars, is considered to be the dominant component at both the Galactic center (see e.g. Muno et al. 2009) and of the Galactic ridge emission (see e.g. Sazonov et al. 2006; Revnivtsev et al. 2009). Individual spectra of magnetic CVs, obtained with ASCA by Ezuka & Ishida (1999), show the Fe Kα emission lines, both the fluorescent emission at ~6.4 keV and that from highly ionized Fe ions. The spectra can be attributed to the hot postshock plasma emission behind the accretion shock standing above the white dwarf surface. The X-ray reflection from the white dwarf surface can account for the observed fluorescent Fe Kα line. Hard X-rays in the 17−60 keV band have been detected by INTEGRAL/IBIS (see Lebrun et al. 2003; Ubertini et al. 2003) from 37 CVs (see, e.g., Krivonos et al. 2010). Thus, CVs could be alternative candidate sources for Srcs 3 and 5, but not for Src 13, owing to the putative presence of Ca and 48Ti lines along with the absence of Fe lines in its spectrum. However, while the ejecta shrapnel model can account for the emission in the 60−120 keV band with the flux of about 1.2 × 10⁻¹² erg cm-2 s-1 detected by INTEGRAL ISGRI from Kes 69 field, the CVs most likely can not. Since the ejecta shrapnels are expected to be extended, dedicated Chandra observations can constrain the spatial extensions of Srcs 3, 5, and 13 to distinguish between the two interpretations.
7. Summary and conclusions
We have performed a study of the SNR Kes 69 to search for compact hard X-ray sources. This and similar studies carried out in remnants that are interacting with molecular clouds may reveal a new population of fast ejecta fragments, which, in turn, may provide useful hints for the remnant progenitors. We detected 18 sources in the 3−10 keV band, which is about three times the expected number of Galactic sources in this area of the sky. Moreover, the position of the source are not random, but correlated with the CO emission of the cloud interacting with the remnant. We selected three of the sources for a more in-depth spectral analysis based on the brightness and visual inspection of their spectra (Srcs 3, 5, and 13 in Table 1). The spectra can be fitted with a non-thermal model plus a few emission lines corresponding to the K-shell transition of Si and Fe. We also analyzed the Spitzer IRAC and MIPS image of the field, finding possible IR counterparts for Srcs 3, 5, and 13. The X-ray spectra and IR flux ratio are consistent with a model of a fast ejecta fragment propagating inside the molecular cloud, making Kes 69 the second SNR for which there is evidence of this new population of hard X-ray sources.
Uncertainties in the X-ray modeling ensure that an alternative explanation in terms of Galactic cataclysmic variables is also possible, but the excess with respect of log (N) − log (S) counts, the location of the sources, the detection of the remnant by INTEGRAL/IBIS, and some of the IR flux ratios make this interpretation less probable then the other. Further data are needed befrore we will be able to draw stronger conclusions about the nature of the sources.
Since the absorbing column NH =  × 1022 cm-2 is consistent with that found for the whole remnant, we fixed it here to 4 × 1022 cm-2 to obtain more restricted estimations of the other model parameters.
Because of the lower quality of these statistics, we fixed the line energies to those found for Src 5.
As for the radio emission, the electrons accelerated at the fragment bow shock in most cases are in the MeV regime, well below GeV. Hence, synchrotron radio emission is not expected to be observable for small fragments. However, an HII region may be created owing to the gas ionization produced by the powerful soft X-ray – far UV emission of the fragment bow shock. Bykov et al. (2008) performed some simple modeling of the radio continuum from such an HII region that is expected to be produced by a fast ejecta fragment moving through dense ambient matter. The scale size of the radio-emitting HII region is smaller than an arcmin if the distance to Kes 69 is about 5 kpc and its flux at 1.4 GHz is likely about 30 mJy (scaling from the IC 443 case).
Acknowledgments
This study has been supported by Ministry of Education and Science of Russian Federation (contract 11.G34.31.0001) and by the RFBR grants 11-02-12082-ofi-m-2011 and 11-02-00253. Support from P-21 and OFN-16 programs of RAS is acknowledged as well. A.M.K. and Yu.A.U. acknowledge support from scientific school NSh-4035.2012.2. G.G.P. acknowledges partial support from NASA grant NNX09AC84G. Y.C. acknowledges support from the NSFC grant 10725312 and the 973 Program grant 2009CB824800. This work has been partially supported by ASI-INAF agreement No. I/009/10/0.
References
- Abdo, A. A., Ackermann, M., Ajello, M., et al. 2010, ApJ, 712, 459 [NASA ADS] [CrossRef] [Google Scholar]
- Albert, J., Aliu, E., Anderhub, H., et al. 2007, ApJ, 664, L87 [NASA ADS] [CrossRef] [Google Scholar]
- Arnaud, M., Neumann, D. M., Aghanim, N., et al. 2001, A&A, 365, L80 [NASA ADS] [CrossRef] [EDP Sciences] [Google Scholar]
- Aschenbach, B., Egger, R., & Trümper, J. 1995, Nature, 373, 587 [NASA ADS] [CrossRef] [Google Scholar]
- Bocchino, F., & Bykov, A. M. 2000, A&A, 362, L29 [NASA ADS] [Google Scholar]
- Bocchino, F., & Bykov, A. M. 2003, A&A, 400, 203 [NASA ADS] [CrossRef] [EDP Sciences] [Google Scholar]
- Bocchino, F., Krassilchtchikov, A. M., Kretschmar, P., et al. 2008, Adv. Space Res., 41, 396 [NASA ADS] [CrossRef] [Google Scholar]
- Bykov, A. M. 2002, A&A, 390, 327 [NASA ADS] [CrossRef] [EDP Sciences] [Google Scholar]
- Bykov, A. M. 2003, A&A, 410, L5 [NASA ADS] [CrossRef] [EDP Sciences] [Google Scholar]
- Bykov, A. M., Bocchino, F., & Pavlov, G. G. 2005, ApJ, 624, L41 [NASA ADS] [CrossRef] [Google Scholar]
- Bykov, A. M., Krassilchtchikov, A. M., Uvarov, Y. A., et al. 2008, ApJ, 676, 1050 [NASA ADS] [CrossRef] [Google Scholar]
- Condon, J. J., Cotton, W. D., Greisen, E. W., et al. 1998, AJ, 115, 1693 [NASA ADS] [CrossRef] [Google Scholar]
- Cordova, F. A., Mason, K. O., & Nelson, J. E. 1981, ApJ, 245, 609 [NASA ADS] [CrossRef] [Google Scholar]
- Dubus, G., Taam, R. E., Hull, C., Watson, D. M., & Mauerhan, J. C. 2007, ApJ, 663, 516 [NASA ADS] [CrossRef] [Google Scholar]
- Ezuka, H., & Ishida, M. 1999, ApJS, 120, 277 [NASA ADS] [CrossRef] [Google Scholar]
- Fabian, A. C., Pringle, J. E., & Rees, M. J. 1976, MNRAS, 175, 43 [NASA ADS] [CrossRef] [Google Scholar]
- Favata, F., Flaccomio, E., Reale, F., et al. 2005, ApJS, 160, 469 [NASA ADS] [CrossRef] [Google Scholar]
- Gezari, D. Y., Arendt, R. G., Smith, R., et al. 2006, J. Phys. Conf. Ser., 54, 171 [NASA ADS] [CrossRef] [Google Scholar]
- Hands, A. D. P., Warwick, R. S., Watson, M. G., & Helfand, D. J. 2004, MNRAS, 351, 31 [NASA ADS] [CrossRef] [Google Scholar]
- Hewitt, J. W., Rho, J., Andersen, M., & Reach, W. T. 2009, ApJ, 694, 1266 [NASA ADS] [CrossRef] [MathSciNet] [Google Scholar]
- Jansen, F., Lumb, D., Altieri, B., et al. 2001, A&A, 365, L1 [NASA ADS] [CrossRef] [EDP Sciences] [Google Scholar]
- Jiang, B., Chen, Y., Wang, J., et al. 2010, ApJ, 712, 1147 [NASA ADS] [CrossRef] [Google Scholar]
- Krivonos, R., Revnivtsev, M., Lutovinov, A., et al. 2007, A&A, 475, 775 [NASA ADS] [CrossRef] [EDP Sciences] [Google Scholar]
- Krivonos, R., Tsygankov, S., Revnivtsev, M., et al. 2010, A&A, 523, A61 [NASA ADS] [CrossRef] [EDP Sciences] [Google Scholar]
- Laming, J. M., & Hwang, U. 2003, ApJ, 597, 347 [NASA ADS] [CrossRef] [Google Scholar]
- Lebrun, F., Leray, J. P., Lavocat, P., et al. 2003, A&A, 411, L141 [NASA ADS] [CrossRef] [EDP Sciences] [Google Scholar]
- Liedahl, D. A. 2005, in X-ray Diagnostics of Astrophysical Plasmas: Theory, Experiment, and Observation, ed. R. Smith, AIP Conf. Ser., 774, 99 [Google Scholar]
- Maeda, K., Röpke, F. K., Fink, M., et al. 2010, ApJ, 712, 624 [NASA ADS] [CrossRef] [Google Scholar]
- Makovoz, D., Roby, T., Khan, I., & Booth, H. 2006, in SPIE Conf. Ser., 6274 [Google Scholar]
- Miyata, E., Tsunemi, H., Aschenbach, B., & Mori, K. 2001, ApJ, 559, L45 [NASA ADS] [CrossRef] [Google Scholar]
- Monet, D. G., Levine, S. E., Canzian, B., et al. 2003, AJ, 125, 984 [NASA ADS] [CrossRef] [Google Scholar]
- Motch, C., Warwick, R., Cropper, M. S., et al. 2010, A&A, 523, A92 [NASA ADS] [CrossRef] [EDP Sciences] [Google Scholar]
- Muno, M. P., Bauer, F. E., Baganoff, F. K., et al. 2009, ApJS, 181, 110 [NASA ADS] [CrossRef] [Google Scholar]
- Nicastro, F., Fiore, F., & Matt, G. 1999, ApJ, 517, 108 [NASA ADS] [CrossRef] [Google Scholar]
- Patterson, J., & Raymond, J. C. 1985, ApJ, 292, 535 [NASA ADS] [CrossRef] [Google Scholar]
- Reach, W. T., Rho, J., Tappe, A., et al. 2006, AJ, 131, 1479 [NASA ADS] [CrossRef] [Google Scholar]
- Revnivtsev, M., Sazonov, S., Churazov, E., et al. 2009, Nature, 458, 1142 [NASA ADS] [CrossRef] [PubMed] [Google Scholar]
- Sazonov, S., Revnivtsev, M., Gilfanov, M., Churazov, E., & Sunyaev, R. 2006, A&A, 450, 117 [NASA ADS] [CrossRef] [EDP Sciences] [Google Scholar]
- Seward, F. D. 1990, ApJS, 73, 781 [NASA ADS] [CrossRef] [Google Scholar]
- Shaver, P. A., & Goss, W. M. 1970, Aust. J. Phys. Astrophys. Supp., 14, 133 [Google Scholar]
- Skrutskie, M. F., Cutri, R. M., Stiening, R., et al. 2006, AJ, 131, 1163 [NASA ADS] [CrossRef] [Google Scholar]
- Stacey, W. S., Heinke, C. O., Elsner, R. F., et al. 2011, ApJ, 732, 46 [NASA ADS] [CrossRef] [Google Scholar]
- Stolovy, S., Ramirez, S., Arendt, R. G., et al. 2006, J. Phys. Conf. Ser., 54, 176 [NASA ADS] [CrossRef] [Google Scholar]
- Strüder, L., Briel, U., Dennerl, K., et al. 2001, A&A, 365, L18 [NASA ADS] [CrossRef] [EDP Sciences] [Google Scholar]
- Thielemann, F.-K., Nomoto, K., & Hashimoto, M.-A. 1996, ApJ, 460, 408 [NASA ADS] [CrossRef] [Google Scholar]
- Tian, W. W., & Leahy, D. A. 2008, MNRAS, 391, L54 [NASA ADS] [Google Scholar]
- Turner, M. J. L., Abbey, A., Arnaud, M., et al. 2001, A&A, 365, L27 [NASA ADS] [CrossRef] [EDP Sciences] [Google Scholar]
- Ubertini, P., Lebrun, F., Di Cocco, G., et al. 2003, A&A, 411, L131 [NASA ADS] [CrossRef] [EDP Sciences] [Google Scholar]
- Walter, R., Rohlfs, R., Meharga, M. T., et al. 2010, in Proc. 8th INTEGRAL Workshop The Restless Gamma-ray Universe (INTEGRAL 2010), September 27−30, Dublin Castle, Dublin, Ireland, http://pos.sissa.it/cgi-bin/reader/conf.cgi?confid=115 [Google Scholar]
- Woosley, S. E., & Weaver, T. A. 1995, ApJS, 101, 181 [NASA ADS] [CrossRef] [Google Scholar]
- Yusef-Zadeh, F., Wardle, M., Rho, J., & Sakano, M. 2003, ApJ, 585, 319 [NASA ADS] [CrossRef] [Google Scholar]
- Zhou, X., Chen, Y., Su, Y., & Yang, J. 2009, ApJ, 691, 516 [NASA ADS] [CrossRef] [Google Scholar]
Appendix A: A simple method to assess the spatial correlation between a set of point-like source and the CO diffuse emission maps
Figure 1, upper panel, shows the detected hard X-ray sources and the 12CO contour emission in the 80−81 km s-1 range, which is the range of velocities associated with the Kes 69 remnant (Zhou et al. 2009). By eye, the source seem to be correlated with the cloud emission, but one needs to assess this correlation in more detail. A simple way of doing this is described below.
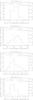 |
Fig. A.1 From top to bottom: as in Fig. 2 but for 8−10, 50−60, 53−55, and 68−70 km s-112CO brightness temperature maps. |
We computed the histogram of the 80−81 km s-112CO brightness temperature map shown in Fig. 1, lower panel. This histogram is plotted as a solid line in Fig. 2 and has a peak around 2−2.5 K. We also computed the brightness temperature at the locations of the 18 detected hard X-ray sources in the same map, we computed its histogram and overplotted it as a dashed line in Fig. 2. We stress that in the case of a uniform distribution of hard X-ray sources, their histogram should match the cloud histogram. If the sources were instead found to be located preferentially outside the cloud, the peak of their histogram should lie to the left of the peak of the cloud. Conversely, if the sources were predominatly within the cloud, their peak should fall at a higher temperature than the cloud temperature, which means that the sources tend to be located in regions of high brightness temperature. This is exactly what happens in the case of the histograms computed using the 80−81 km s-112CO brightness temperature map (Fig. 2).
To further strengthen this argument, we also computed the histogram using the 8−10, 50−60, 53−55, and 68−70 km s-112CO brightness temperature maps, using the data of Zhou et al. (2009), and we show them in Fig. A.1. These velocity ranges are not associated with the remnant, hence the sources should be in foreground. The plots indeed show that the source histogram either has a peak at the same brightness temperature as the cloud histogram, or at a lower brightness level, indicating that there is either little or a negative correlation.
We also calculated the Pearson’s correlation coefficient r between the CO image and the hard X-ray sources image (an artificial image with pixel values of one at the source position and zero elsewhere). This coefficient is one if the images are identical, greater than zero if the two images are correlated, zero if they are completely uncorrelated, and less than zero if they are anti-correlated. The correlation coefficient r is shown in the upper-left corner of each image. The 80−81 km s-1 histogram is the only one with positive r, i.e. the only one for which there is a possible correlation between the sources and the 12CO map.
All Tables
List of sources detected in the 3−10 keV band in the field of view of the XMM-Newton observation of the Kes 69 SNR.
All Figures
|
Fig. 1 Upper panel: EPIC PN count map of Kes 69 obtained in the 3−10 keV band. The bin size is 4′′. The white circles indicate point-like sources detected in this image; the red contours denote intensity of the 1.4 GHz emission from the NVSS survey (Condon et al. 1998); the green contours denote the 12CO (J = 1−0) intensity in the 80−81 km s-1 velocity range (see lower panel). The yellow cross denotes the position of the hard X-ray excess seen with INTEGRAL ISGRI. Middle panel: adaptively smoothed (to a signal-to-noise ratio of 16) and vignetting-corrected EPIC count-rate image (MOS-equivalent counts per second per bin) of Kes 69 in the 1−3 keV band. The black rectangle is the region used to extract the spectrum of the diffuse emission. The superimposed hard X-ray sources and the radio contours are the same as in the upper panel. Lower panel: 12CO (J = 1−0) intensity map in the velocity interval 80−81 km s-1 (linearly interpolated to a resolution of 0 |
| In the text | |
|
Fig. 2 Histogram of brightness temperature values in the 12CO maps in the 80−81 km s-1 velocity range (solid line, Zhou et al. 2009, also visible in the lower panel of Fig. 1) which shows the molecular cloud interacting with the remnant. On this, we superimpose the histogram of the same temperatures at the location of the 18 hard X-ray sources detected in the XMM-Newton observation (dashed line). The r value is the Pearson correlation coefficient, which indicates that there is a positive correlation (see Appendix A for details). The source peak is offset toward higher values than the cloud mean value, indicating that X-ray sources cluster at brighter-than-average CO map points. |
| In the text | |
|
Fig. 3 XMM-Newton EPIC-PN (black) and MOS2 (red) spectra of Src 5 (upper panel), Src 3 (middle panel), and Src 13 (lower panel) with best-fit models (power law plus two narrow Gaussians) and residuals. |
| In the text | |
|
Fig. 4 Confidence contours of the line centroid and normalization for the Fe (upper left) and Si (lower left) lines in Src 5, and for the 48Ti (upper right) and Ca (lower right) lines in Src 13. The contours correspond to the 68% and 90% confidence levels. |
| In the text | |
|
Fig. 5 Environments of Src 3 (top panels) and Src 5 (bottom panels) as seen by Spitzer IRAC camera at 3.6 and 4.5 μm, and MIPS at 24 μm. The sources 3 and 5 detected by XMM-Newton are shown as solid red circles, while the IR sources are shown as dashed green circles, both with labels with names referred to in the text. |
| In the text | |
|
Fig. 6 Close environments of Src 13 as seen with Spitzer IRAC at 3.6, 4.5, 5.8, and 8.0 μm. The red circle marks the position of the XMM-Newton detected source. |
| In the text | |
|
Fig. A.1 From top to bottom: as in Fig. 2 but for 8−10, 50−60, 53−55, and 68−70 km s-112CO brightness temperature maps. |
| In the text | |
Current usage metrics show cumulative count of Article Views (full-text article views including HTML views, PDF and ePub downloads, according to the available data) and Abstracts Views on Vision4Press platform.
Data correspond to usage on the plateform after 2015. The current usage metrics is available 48-96 hours after online publication and is updated daily on week days.
Initial download of the metrics may take a while.