Fig. 2
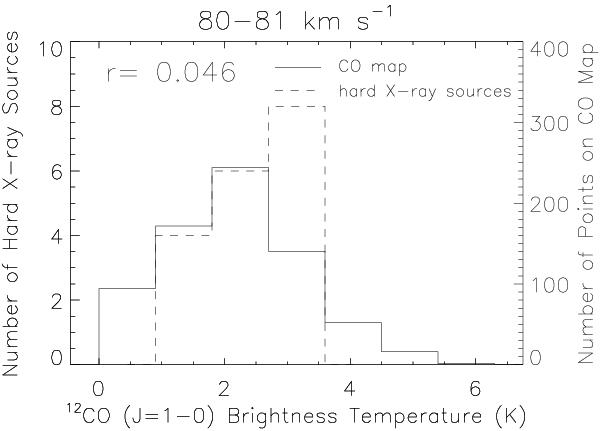
Histogram of brightness temperature values in the 12CO maps in the 80−81 km s-1 velocity range (solid line, Zhou et al. 2009, also visible in the lower panel of Fig. 1) which shows the molecular cloud interacting with the remnant. On this, we superimpose the histogram of the same temperatures at the location of the 18 hard X-ray sources detected in the XMM-Newton observation (dashed line). The r value is the Pearson correlation coefficient, which indicates that there is a positive correlation (see Appendix A for details). The source peak is offset toward higher values than the cloud mean value, indicating that X-ray sources cluster at brighter-than-average CO map points.
Current usage metrics show cumulative count of Article Views (full-text article views including HTML views, PDF and ePub downloads, according to the available data) and Abstracts Views on Vision4Press platform.
Data correspond to usage on the plateform after 2015. The current usage metrics is available 48-96 hours after online publication and is updated daily on week days.
Initial download of the metrics may take a while.