Fig. 1
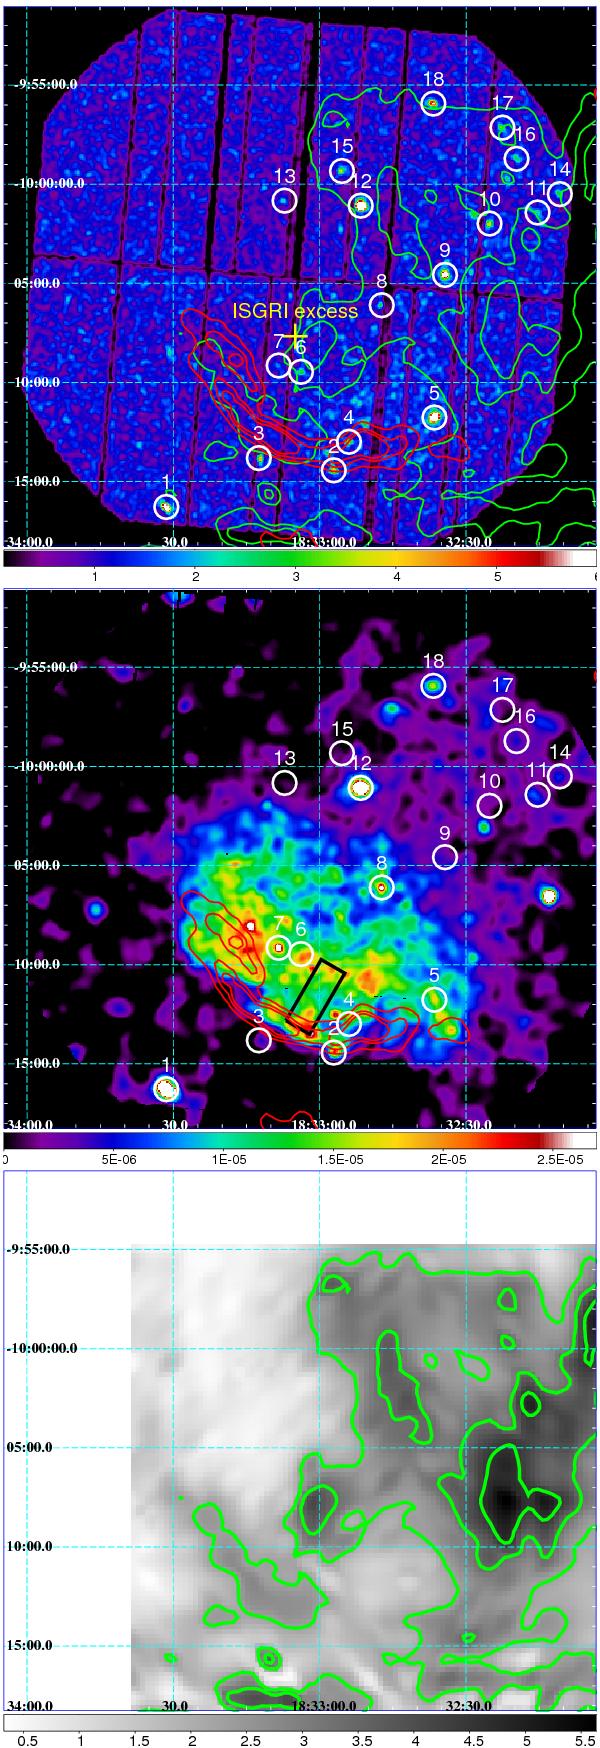
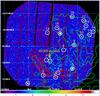
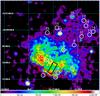
Upper panel: EPIC PN count map of Kes 69 obtained in the 3−10 keV band. The bin size is 4′′. The white circles indicate point-like sources detected in this image; the red contours denote intensity of the 1.4 GHz emission from the NVSS survey (Condon et al. 1998); the green contours denote the 12CO (J = 1−0) intensity in the 80−81 km s-1 velocity range (see lower panel). The yellow cross denotes the position of the hard X-ray excess seen with INTEGRAL ISGRI. Middle panel: adaptively smoothed (to a signal-to-noise ratio of 16) and vignetting-corrected EPIC count-rate image (MOS-equivalent counts per second per bin) of Kes 69 in the 1−3 keV band. The black rectangle is the region used to extract the spectrum of the diffuse emission. The superimposed hard X-ray sources and the radio contours are the same as in the upper panel. Lower panel: 12CO (J = 1−0) intensity map in the velocity interval 80−81 km s-1 (linearly interpolated to a resolution of 0 24 (see Zhou et al. 2009). The contour levels are at 40%, 60%, and 80% of the maximum.
Current usage metrics show cumulative count of Article Views (full-text article views including HTML views, PDF and ePub downloads, according to the available data) and Abstracts Views on Vision4Press platform.
Data correspond to usage on the plateform after 2015. The current usage metrics is available 48-96 hours after online publication and is updated daily on week days.
Initial download of the metrics may take a while.