| Issue |
A&A
Volume 540, April 2012
|
|
|---|---|---|
| Article Number | A6 | |
| Number of page(s) | 12 | |
| Section | Interstellar and circumstellar matter | |
| DOI | https://doi.org/10.1051/0004-6361/201118296 | |
| Published online | 14 March 2012 | |
The effect of local optically thick regions in the long-wave emission of young circumstellar disks
1 European Southern Observatory, Karl-Schwarzschild-Strasse 2, 85748 Garching, Germany
e-mail: This email address is being protected from spambots. You need JavaScript enabled to view it.
2 Division of Physics, Mathematics and Astronomy, California Institute of Technology, MC 249-17, Pasadena, CA 91125, USA
3 INAF – Osservatorio Astrofisico di Arcetri, Largo Fermi 5, 50125 Firenze, Italy
4 School of Cosmic Physics, Dublin Institute for Advanced Studies, 31 Fitzwilliam Place, Dublin 2, Ireland
5 Harvard-Smithsonian Center for Astrophysics, 60 Garden Street, Cambridge, MA 02138, USA
Received: 18 October 2011
Accepted: 1 February 2012
Abstract
Multi-wavelength observations of protoplanetary disks in the sub-millimeter continuum have measured spectral indices values which are significantly lower than what is found in the diffuse interstellar medium. Under the assumption that mm-wave emission of disks is mostly optically thin, these data have been generally interpreted as evidence for the presence of mm/cm-sized pebbles in the disk outer regions.
In this work we investigate the effect of possible local optically thick regions on the mm-wave emission of protoplanetary disks without mm/cm-sized grains. A significant local increase of the optical depth in the disk can be caused by the concentration of solid particles, as predicted to result from a variety of proposed physical mechanisms. We calculate the filling factors and implied overdensities these optically thick regions would need to significantly affect the millimeter fluxes of disks, and we discuss their plausibility.
We find that optically thick regions characterized by relatively small filling factors can reproduce the mm-data of young disks without requesting emission from mm/cm-sized pebbles. However, these optically thick regions require dust overdensities much larger than what predicted by any of the physical processes proposed in the literature to drive the concentration of solids. We find that only for the most massive disks it is possible and plausible to imagine that the presence of optically thick regions in the disk is responsible for the low measured values of the mm spectral index. For the majority of the disk population, optically thin emission from a population of large mm-sized grains remains the most plausible explanation. The results of this analysis further strengthen the scenario for which the measured low spectral indices of protoplanetary disks at mm wavelengths are due to the presence of large mm/cm-sized pebbles in the disk outer regions.
Key words: protoplanetary disks
© ESO, 2012
1. Introduction
Planets around solar-like stars are thought to originate from the material contained in a circumstellar “protoplanetary” disk. Observations of protoplanetary disks around pre-main sequence (PMS) stars at optical and infrared wavelengths have provided evidence for the presence of dust grains as large as at least a few μm in many of these systems. Since these grains are larger than the submicron-sized grains found in the interstellar medium (ISM, e.g. Mathis et al. 1977), these observational results have been interpreted in terms of dust grain growth from an original ISM-like dust population in the disk. These are the first steps of growth of solid particles which may potentially lead to the formation of planetesimals and then planetary bodies.
In order to investigate the presence of larger grains in the disk, observations at longer wavelengths are needed. Furthermore, since the dust opacity decreases at longer wavelengths, whereas infrared observations are sensitive to emission from the disk surface layers, observations in the millimeter probe the denser disk midplane, where the whole process of planetesimal formation is supposed to occur.
In the last two decades several authors measured relatively shallow slopes α of the spectral energy distribution (SED; Fν ~ να with α ~ 2−3) of protoplanetary disks at sub-mm and mm wavelengths (e.g. Beckwith & Sargent 1991; Wilner et al. 2000; Testi et al. 2001; 2003; Natta et al. 2004; Wilner et al. 2005; Andrews et al. 2005; Rodmann et al. 2006; Ricci et al. 2010a). Under the assumption of completely optically thin emission and if the emitting dust is warm enough to make the Rayleigh-Jeans approximation hold true at these wavelengths, the SED spectral index α is directly linked to the spectral index β of the dust opacity coefficient κν1 through β = α − 2. In this way, the measured low values of α translate into values of β ≲ 1 which are significantly lower than the value of 1.5−2 associated to the ISM (Mathis et al. 1977). For all the reasonable models of dust analyzed so far, the obtained values of β for young disks can be interpreted only if grains have grown to sizes of at least a few millimeters in the outer disk regions (see e.g. Draine 2006; Natta et al. 2007).
The presence of mm/cm-sized solid particles in the outer disk poses serious problems to the models of dust evolution in young circumstellar disks. Because of pressure, gas moves with sub-keplerian velocity, and thus it is slower than the solid component which is rotating at keplerian velocity. This generates a gas headwind felt by the solid particles, causing them to lose angular momentum and spiral inward in the disk. Dynamical models of solids in protoplanetary disks show that mm/cm-sized particles in the outer regions of disks are expected to rapidly drift toward the inner disk (Weidenschilling 1977). As a consequence, these particles should not be present in the disk outer regions. This expectation is challenged by the observations of mm-slope of protoplanetary disks, if interpreted as due to large grains emission. Furthermore, Birnstiel et al. (2010a) have recently shown that even if radial drift is completely halted by some physical mechanisms, the low mm-spectral indices (≈2−2.5) measured for the faintest disks cannot be reproduced by models of dust evolution in disks with low masses. This is because for these disks the gas densities in the outer regions are so low that mm/cm grains should be never formed there through sticking after mutual grain collision.
Another a priori possible scenario for the interpretation of the measured low values of the mm-spectral indices is that a significant fraction of emission at these wavelengths come from optically thick regions in the disk. In this case, the spectral index of the SED would reflect only the spectral index of the Planck function, which is 2 for emission in the Rayleigh-Jeans regime. This value is consistent with that measured for a large population of young circumstellar disks (e.g. Rodmann et al. 2006; Ricci et al. 2010a).
Under the assumption of smooth disks, the innermost regions of typical T Tauri disks (R ≲ 10 − 20 AU) can be dense enough to be optically thick even at long mm-wavelengths (e.g. Beckwith et al. 1990; Testi et al. 2001). However, interferometric observations of disks can constrain the physical structure of disks and quantify the impact of this optical-depth effect. The general conclusion of these studies is that disks are typically found to be relatively large, with outer radii of the order of ~100 AU or more. By modelling the mm-wave emission one finds that the typical contribution of the optically thick innermost regions to the total fluxes is nearly insignificant at wavelengths ≳ 1 mm (see e.g. Testi et al. 2003; Wilner et al. 2005; Isella et al. 2009; Guilloteau et al. 2011).
In the last years several different physical processes with the potential of concentrating particles in disks have been proposed as possible triggering mechanisms for the formation of planetesimals (see Chiang & Youdin 2010). These all lead to a local increase of the particle density in some regions of the disk. If the density gets high enough, these regions might become optically thick even at mm wavelengths. Where in the disk these particle concentrations are supposed to occur depends on the particular physical mechanism driving the process, but they are not necessarily expected only in the innermost disk regions.
If this scenario was viable, the spectral index of the SED would not carry the information on the grain sizes (through β) and no constraints on that property could be derived from the observations. Therefore it is important to investigate the potential effect of optically thick disk regions on the disk total emission at millimeter wavelengths to understand whether the measured fluxes can be really used to test models of dust evolution in protoplanetary disks. With this work we want to answer the following questions: 1) could the observed low values of the (sub-)millimeter spectral indices of disks be explained by local concentrations of small particles (sizes < 1 mm) rather than by the widespread presence of mm/cm-sized pebbles? 2) If yes, which characteristics do they need to have? 3) Are the required local concentrations of small particles in disks physically plausible?
In Sect. 2 we present the sample of protoplanetary disks that we will use for our analysis. Section 3 outlines the disk and dust models considered for the analysis. The results are described in Sect. 4, whereas a discussion on the impact of the optically thick regions on high-angular resolution observations of disks in the sub-millimeter, and on the physical plausibility of the required structures are presented in Sect. 5. The main conclusions of this work are summarized in Sect. 6.
2. Sample
We describe here the sample of disks that we will consider in the following analysis. This is made of the samples of low-mass young stellar objects (YSOs) in the Taurus, Ophiuchus and Orion Nebula SFRs by Ricci et al. (2010a,b, 2011a,b, respectively). These sources have been selected (1) by being low-mass Class II YSOs with no evidence of extended emission from a parental envelope, (2) by having known sub-mm/mm SED, through at least one detection in the 0.45 ≤ λ ≤ 1.3 mm spectral range and a detection at λ ≈ 3 mm, (3) as well as no evidence of any stellar companion at spatial separations of about 10 − 400 AU that would likely affect the structure of the disk outer regions, to which observations at sub-mm/mm wavelengths are most sensitive to.
In addition to these 47 sources, we consider here also the disks around BP Tau, DQ Tau, V836 Tau for which we obtained new CARMA observations and which satisfy the selection criteria described above, as detailed in Appendix A.
For a detailed discussion on the completeness of the selected samples we refer to the Ricci et al. (2010a,b, 2011a,b) papers. Here, we note that the second selection criterion listed above implies that the selected disks are relatively bright in the sub-mm and therefore relatively massive. A list of the disk mass constrained from the sub-mm/mm SED of each disk is reported in Appendix B. As can been seen from Table 6, disks with masses as low as about 10-5 M⊙ in dust, or ~10-3 M⊙ in gas (given a dust-to-gas mass ratio of 0.01), are included in our sample.
3. Analysis
In this section we present the method adopted to explore the impact of optically thick regions in the total emission of a disk at sub-mm/mm wavelengths. Section 3.1 describes the disk model used in our analysis and how the optically thick regions are included in the disk structure. Section 3.2 describes the main properties of the dust models used to derive the dust opacities.
3.1. Disk structure
We start by defining an “unperturbed” disk structure on the top of which we will add the contribution of optically thick disk regions. For a disk with midplane temperature Tmid(r) and dust mass surface density Σ(r) between an inner and outer radius Rin and Rout, respectively, the sub-mm/mm SED can be modelled as the sum of the contribution by infinitesimal annuli with radius r (in cylindrical coordinate system): 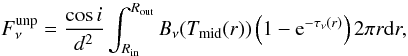 (1)where i is the disk inclination, i.e. the angle between the disk axis and the perpendicular to the plane of the sky2, d is the distance of the disk from the observer, and Bν is the Planck function. In Eq. (1) the optical depth τν(r) is defined as
 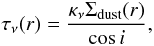 (2)where κν is the dust opacity coefficient3 (Sect. 3.2), and Σdust(r) is the dust surface density.
In this work we adopted a modified version of the two-layer models of passively irradiated flared disks developed by Dullemond et al. (2001; which follows the schematization by Chiang & Goldreich 1997) to derive the disk structure. In order for these models to calculate the temperature of the disk midplane, a surface density profile has to be given as input.
For the radial profile of the dust surface density we consider here the self-similar solution for a viscous disk (Lynden-Bell & Pringle 1974): ![Mathematical equation: \begin{equation} \Sigma_{\rm{dust}}(r)=\Sigma_{0}\left(\frac{r}{r_{\rm c}}\right)^{-\gamma}\exp\left[-\left(\frac{r}{r_{\rm c}}\right)^{2-\gamma}\right], \label{eq_sigma} \end{equation}](/articles/aa/full_html/2012/04/aa18296-11/aa18296-11-eq35.png) (3)with values of the Σ0, γ, rc parameters in the ranges observationally constrained by sub-arcsec angular resolution imaging of young protoplanetary disks in the sub-mm (Isella et al. 2009; Andrews et al. 2009, 2010; see Sect. 4).
(3)with values of the Σ0, γ, rc parameters in the ranges observationally constrained by sub-arcsec angular resolution imaging of young protoplanetary disks in the sub-mm (Isella et al. 2009; Andrews et al. 2009, 2010; see Sect. 4).
After setting the dust surface density, the properties of the dust grains and of the central star (see below), the temperature profile Tmid(r) is derived by balancing the heating due to the reprocessed stellar radiation by the disk surface layers with cooling due to the dust thermal emission. Here we consider a PMS star with a mass of 0.5 M⊙, bolometric luminosity of 0.9 L⊙ and effective temperature of 4000 K, which are typical values for the sample of low-mass PMS stars studied in Ricci et al. (2010a,b, 2011a,b) in the Taurus, Ophiuchus and Orion Nebula Cluster forming regions.
On the top of the “unperturbed” disk structure just defined, we add the contribution of optically thick regions in the disk, i.e. regions where the optical depth τν ≫ 1 even at sub-mm and mm wavelengths. By noticing that for a completely optically thick disk Eq. (1) for the flux density reduces to 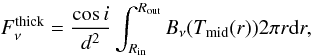 (4)we modify Eq. (1) by adding at each radius r a fraction f of the area of the disk that is optically thick, so that the total flux density becomes:
 ![Mathematical equation: \begin{eqnarray} F_{\nu}^{f} &=& \frac{\cos i}{d^{2}}\int_{R_{\rm{in}}}^{R_{\rm{out}}}B_{\nu}(T_{\rm{mid}}(r))\left[ f+(1-f)\left( 1-{\rm e}^{-\tau_{\nu}(r)}\right)\right] \nonumber \\ && {}\times 2\pi r {\rm d}r. \label{eq_disk_flux} \end{eqnarray}](/articles/aa/full_html/2012/04/aa18296-11/aa18296-11-eq45.png) (5)The “filling factor” f can thus be read as the fraction of area in the disk which is optically thick at all the wavelengths considered in the analysis. In general f = f(r), i.e. the filling factor is a function of radius. If f = 0 at all radii, Eq. (5) reduces to Eq. (1), i.e. no optically thick regions are added to the flux density of an unperturbed disk. If f = 1 at all radii, Eq. (5) reduces to Eq. (4) for the flux density of a completely optically thick disk.
(5)The “filling factor” f can thus be read as the fraction of area in the disk which is optically thick at all the wavelengths considered in the analysis. In general f = f(r), i.e. the filling factor is a function of radius. If f = 0 at all radii, Eq. (5) reduces to Eq. (1), i.e. no optically thick regions are added to the flux density of an unperturbed disk. If f = 1 at all radii, Eq. (5) reduces to Eq. (4) for the flux density of a completely optically thick disk.
In Sect. 4.1 we will treat firstly the simplest case of f(r) constant with radius, then we will consider for f(r) a family of step functions which are non-zero only within specified regions in the disk in Sect. 4.3.
Note that in Eqs. (4) and (5) we assumed for simplicity that the temperature of the optically thick regions at a stellocentric radius r is equal to the one of the unperturbed disk calculated by the two-layer disk model at the same radius. Although not strictly correct, this is a very good approximation. The temperature of the disk is roughly proportional to the ratio between the optical depth in the optical (where the disk absorbs most of the radiation energy) and the optical depth in the infrared (where the disk emits most of its radiation; see Dullemond et al. 2001). Therefore, at first order, the dust temperature does not depend on the absolute value of the optical depth.
Since for nearly all the disks imaged at high angular resolution in the sub-mm γ is larger than 0 (Andrews et al. 2009, 2010; Isella et al. 2009), Eq. (3) implies that the dust surface density typically decreases with distance from the central star. This means that the innermost regions of unperturbed disks can be dense enough to be optically thick at long mm wavelengths, as it was recognized since the very first analyses of sub-mm observations of YSOs (e.g. Beckwith et al. 1990). Testi et al. (2001) quantified the impact of optically thick emission from inner disk regions by showing how the predicted mm-fluxes change when considering different parameters for the disk structure. To visualize their main results, they used the Fmm vs. αmm diagram, where Fmm is the flux-density at a given mm-wavelength and αmm is the mm-spectral index. In this paper we will extensively use this diagram. The main difference with this and other previous works is that our attention will mostly focus on the impact of possible optically thick regions throughout the disk, rather than only on the optically thick inner regions in the unperturbed disk structure. A parametric study of the effect of these local optically thick regions on the mm-SED, and of their properties is presented in Sect. 4. The physical origin of these regions is discussed in Sect. 5.2.
3.2. Dust opacity
The only physical quantity present in Eqs. (1), (2), (5) which is left to be described is the frequency-dependent dust opacity coefficient κν. This term, which at long wavelengths represents the level of emissivity of the disk per unit dust mass, can be specified only when a model for the dust grain chemical composition, porosity, shape and size is considered (see e.g. Natta et al. 2004).
In this paper we adopt the same dust grain model as in Birnstiel et al. (2010a), Ricci et al. (2010a,b), i.e. porous composite spherical grains made of astronomical silicates, carbonaceous materials and water ice (optical constants from Weingartner & Draine 2001; Zubko et al. 1996; Warren 1984, respectively). The refractive indices of the different species have been combined by using the Bruggeman mixing theory. We use the fractional abundances estimated by Semenov et al. (2003). After setting the chemical composition, porosity and shape of the grain, a grain size distribution n(a) has to be specified in order to determine the dust opacity coefficient κν of the dust model. We adopt a power-law grain size distribution with power-law exponent q (6)
truncated between the minimum and maximum grain sizes amin and amax, respectively. Since in this work we want to investigate the impact of local optically thick regions in the outer disk on the slope of the mm-SED without invoking the presence of large mm-sized grains, we consider here a size distribution which does not contain mm-grains, i.e. with amax ≈ 0.1 mm. Note that, for any given grain chemical composition, as long as amax ≲ 0.1 mm the dust opacity coefficient κν at mm wavelengths stays unchanged and does not even depend on q (see Fig. 3 in Ricci et al. 2010a). Therefore, the dust model adopted here refers to a more general dust population in which only grains smaller than ~0.1 mm are present.
(6)
truncated between the minimum and maximum grain sizes amin and amax, respectively. Since in this work we want to investigate the impact of local optically thick regions in the outer disk on the slope of the mm-SED without invoking the presence of large mm-sized grains, we consider here a size distribution which does not contain mm-grains, i.e. with amax ≈ 0.1 mm. Note that, for any given grain chemical composition, as long as amax ≲ 0.1 mm the dust opacity coefficient κν at mm wavelengths stays unchanged and does not even depend on q (see Fig. 3 in Ricci et al. 2010a). Therefore, the dust model adopted here refers to a more general dust population in which only grains smaller than ~0.1 mm are present.
4. Results
In this section we present the results of our analysis. In particular, in Sects. 4.1 and 4.3 we compare the mm-flux densities as derived by our disk models for different values of parameters related to the disk structure, with those measured by Ricci et al. (2010a,b, 2011a,b) for 49 disks in the Taurus, Ophiuchus and Orion star forming regions.
4.1. Case of a constant f: the F1 mm-α1−3 mm diagram
We start by considering a f(r)-function which is constant for stellocentric radii lower than 300 AU4 and equal to 0 outside 300 AU. Each panel in Fig. 1 shows the prediction of our disk models for different values of the filling factor f and of the dust mass for a given couple of the (γ, rc) parameters for the disk unperturbed structure5. The values of the parameters considered in this work for the unperturbed disk, i.e. γ = 0,1 and rc = 20,200 AU (see Eq. (3)), lay at the limits of the ranges for these parameters as recently constrained by a high-angular resolution survey of about 30 protoplanetary disks in the sub-mm (Isella et al. 2009; Andrews et al. 2009, 2010).
In each panel the points with f = 0 represent the emission of the unperturbed disk, i.e. without any addition of optically thick regions. The dependence of the flux density at 1 mm on the dust mass is due to the fact that the bulk of the material reside in the outer disk regions where the surface density is relatively low and the emission optically thin. In terms of the spectral index α1−3 mm the points with f = 0 lay at relatively large values of about 3−3.5. This is due to the adopted dust model made of small grains (Sect. 3.2), for which the value of the spectral slope β of the dust opacity coefficient is about 1.5. The slight decrease of α1−3mm with increasing dust mass is given by the fact that for disks that are massive enough the innermost disk regions (r < 10−20 AU) are so dense that the emission from these regions becomes optically thick in the sub-mm, and this has the effect of making the SED shallower.
Note however that the points with f = 0 do not get into the area of the F1 mm-α1−3mm diagram which contains the bulk of the observational data. In particular the models presented here with f = 0 overpredict the observed spectral index α1−3 mm.
The effect of increasing the filling factor f of optically thick regions has always the same kind of signature in the (F1 mm, α1 − 3 mm)-plane: the absolute flux in the (sub-)mm increases because more and more optical depth is added into the system, whereas the spectral index tends to decrease and approach the value of about 2, as expected for completely optically thick emission in the Rayleigh-Jeans regime6.
The main result shown in Fig. 1 is that, for most of the unperturbed disk structures, relatively low values of the filling factor (f ≲ 0.05) are required to explain the bulk of the data. The most significant variation of the mm-fluxes with the properties of the unperturbed disk comes when the characteristic radius changes from 20 to 200 AU (see left and right panels, respectively). With rc = 20 AU the surface density is more concentrated in the inner disk than in the rc = 200 AU case. As a consequence of this the impact of the optically thick inner regions to the total emission is more evident (see e.g. the low α1−3mm-value of the model with f = 0 and a dust mass of 10-3 M⊙ for the unperturbed disk structure). However, the fluxes of the disks with f > 0 do not dramatically depend on the structure of the unperturbed disk. This is due to the fact that in most of the cases already for f ≈ 0.05 the total disk emission becomes dominated by the added optically thick regions.
What varies strongly with the unperturbed disk structure at a given f is the mass which has to be included in these added regions in order to make them optically thick. This is discussed in the next section.
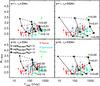 |
Fig. 1 Flux density at 1 mm vs. spectral index between 1 and 3 mm. In each panel red, blue and green points represent observational data of disks in Class II YSOs in Taurus (Ricci et al. 2010a, and this work), Ophiuchus (Ricci et al. 2010b), and Orion Nebula Cluster (Ricci et al. 2011a,b), respectively. The 1 mm-fluxes in the Orion Nebula Cluster have been multiplied by a factor of (420 pc/140 pc)2 to compensate for the different distances estimated for the Orion (~420 pc, Menten et al. 2007) and Taurus/Ophiuchus regions (~140 pc, Bertout et al. 1999; Wilking et al. 2008). Red empty circles are the three Class II YSOs observed with CARMA and discussed in Appendix A. Black symbols show the model predictions for different unperturbed dust mass: triangles for 10-5 M⊙, stars for 10-4 M⊙, and squares for 10-3 M⊙. Solid lines connect disk models with the same unperturbed dust mass, whereas dashed lines connect models with the same constant filling factor f for the optically thick regions, with values indicated in the bottom right side of each panel. In each panel a given couple of the (γ, rc)-parameters has been assumed for the unperturbed disk structure, with values indicated in the top left corner. |
4.2. Case of a constant f: required masses in optically thick regions
So far we have considered the emission of our modelled disks without considering how much mass has to be added to the disk in order to make a fraction of the disk surface optically thick even at millimeter wavelengths. A simple way to do this is to calculate the surface density which has to be present in the added regions to give them an optical depth of about 1 at the longest wavelength considered in this work, i.e. 3 mm, and then integrate over the disk area covered by the filling factor f. This represents actually a lower limit for the mass which has to be present in the added regions to make them optically thick: if more mass is put onto those regions this does not have a significant effect onto the SED.
Therefore, the surface density of dust in the optically thick regions  is given by the condition
  (7)which implies that does not depend on the stellocentric radius. As a consequence of this the total amount of dust in these regions
 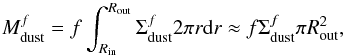 (8)i.e. the total dust mass in the optically regions depends quadratically on the largest radius in which these regions are present in the disk, namely 300 AU in this simulation. For the dust considered in Sect. 3.2, κ3mm ≈ 0.45 cm2/g and
  . This means that even in the case of the model with the largest unperturbed mass in dust (10-3 M⊙) and with the lowest value of the filling factor f considered here (0.01), the optically thick regions contain at least 70% of the mass in the unperturbed disk. This ratio then increases linearly with f and decreases with increasing the dust mass of the unperturbed disk. This argument clearly shows that in order to have optically thick regions of the kind discussed so far in the outer disk a very strong redistribution of dust particles has to occur in the disk (see Sect. 5).
As shown in Eq. (8), the dust mass in the optically thick regions depends quadratically on the disk outer radius. An idea to reduce the amount of dust required in these optically thick regions is therefore to reduce the area in the disk where they are located. This is the topic of the next section.
4.3. Case of f(r) as a step function: the F1 mm-α1−3 mm diagram
We consider here the result of optically thick regions localized in smaller areas of the disk. In particular, we discuss four cases in which f(r) is a step function with values greater than 0 between 10 and 20 AU, 30 and 40 AU, 50 and 60 AU, 80 and 90 AU, respectively. We consider annuli with a width of 10 AU because the physical mechanisms proposed so far to concentrate particles locally in the disk typically act on these length scales or smaller (see Sect. 5.2). The different central radii chosen for the annuli allow us to investigate how the location of the optically thick regions in the disk can affect its total sub-mm emission.
The four panels in Fig. 2 show the model predictions on the F1 mm − α1 − 3 mm diagram for disks with such localized optically thick regions and an unperturbed disk structure with γ = 0.5 and rc = 60 AU, which are approximately the median values for disks imaged at high-angular resolution.
The optically thick regions can have a signficant impact onto the global mm-SED even if they are concentrated in rings with the relatively small width of 10 AU. The effect is stronger for the disk with lower masses because of the higher constrast in optical depth between the unperturbed disk and the optically thick regions. For the same reason, i.e. the contrast with the unperturbed disk structure, and for the fact that the area of an annulus of a given width scales linearly with the central radius of the annulus, at a given filling factor f inside the ring, the effect of the optically thick regions is the largest in the ring which is the furthest from the star, i.e. between 80 and 90 AU. Note that to reproduce the bulk of the data, larger fractions f are needed than in the f(r) = const. case. This is because in the case of optically thick emission, apart for the temperature, it is the surface area of the emitting material that determines the amount of its emission. Therefore, if these regions are distributed over a smaller area of the disk, they need to occupy a larger fraction of that area, which is what we find with our analysis. This argument justifies our choice of dealing with very simple structures for the optically thick regions: even if optically thick regions in real disks would likely have more complex structures than modelled here, our analysis is meaningful in terms of the fractional area covered by such regions throughout the disk.
4.4. Case of f(r) as a step function: required overdensities
As done in Sect. 4.2 for the case of a constant f within 300 AU, we analize here the dust mass which has to be present in the optically thick regions. This can be calculated by using the first equality in Eq. (8) with the inner and outer radii of the ring for Rin and Rout, respectively.
For the case of the ring between 10 and 20 AU the total dust mass in the optically thick regions is  , and rises to ≈ f × 5.5 × 10⁻⁴ M⊙, ≈ f × 8.7 × 10⁻⁴ M⊙ and ≈ f × 1.3 × 10⁻³ M⊙ when the ring is moved outward to 50−60 AU and 80−90 AU, respectively, because of the increased area of the ring itself. To explain the left end of the F1 mm-α1−3 mm diagram (Fig. 2) filling factors f ≳ 0.1 on the top of the lowest mass disk (Mdust,unpert = 10-5 M⊙) are needed. However, the mass in the optically thick regions is larger than the one in the unperturbed structure for all the rings considered here. This would require an extremely strong concentration of particles in those regions which are not seen in the results of the numerical simulations run so far (see discussion in Sect. 5.2). For the disk with Mdust,unpert = 10-4 M⊙ a significant decrease of the spectral index α1 − 3 mm, i.e. down to about 2.5 and lower is obtained only for f ≳ 0.3 (Fig. 2). These filling factors require dust masses in the optically thick regions as large as at least 70% of the unperturbed disk mass. Finally, the added optically thick regions in the most massive disk considered here, with Mdust,unpert = 10-3 M⊙, contain relatively low dust mass as compared with the unperturbed disk mass. For example, in the case of f = 0.5 the ratio among the former and latter masses is about 12%, 28%, 44%, 65% for the optically thick regions inside rings with radii of 10−20 AU, 30−40 AU, 50−60 AU and 80−90 AU, respectively.
Tables 1–4 report, for models with different unperturbed disk structures in terms of total dust mass, γ and rc, the required overdensities in the optically thick regions. These are defined as the ratio between the dust surface density  in the optically thick regions and the surface density in the unperturbed disk structure evaluated at the center of the ring. Since is always the same (i.e. 1/k3 mm ≈ 2.2 cm2/g), the required overdensities depend only on the value that the dust surface density of the unperturbed disk assumes in the ring, and therefore on the (Mdust,unpert,γ,rc) parameters which define such surface density. Note that the values of these overdensities do not depend on the adopted value for the dust opacity κ3 mm (or equivalently on the adopted dust model). This is because both the surface density in the optically thick regions, and the surface density in the optically thin unperturbed disk structure at a given flux depend on the dust opacity as
  . The lowest values for the overdensities are found for the most massive disk when the overdensity region is located closest to the star. The low overdensity values of order of unity indicate that this disk is massive enough to have the unperturbed structure at radii of ~10−20 AU marginally optically thick by itself, i.e. without the addition of any artificial optically thick region.
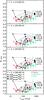 |
Fig. 2 As in Fig. 1, but with optically thick regions localized in annuli of 10 AU-width, with inner and outer radii indicated in the top left corner of each panel. The unperturbed structure of the disk is characterized by γ = 0.5 and rc = 60 AU. |
Required dust overdensities in the added optically thick regions inside a ring between 10 and 20 AU from the central star.
Required dust overdensities in the added optically thick regions inside a ring between 30 and 40 AU from the central star.
Required dust overdensities in the added optically thick regions inside a ring between 50 and 60 AU from the central star.
Required dust overdensities in the added optically thick regions inside a ring between 80 and 90 AU from the central star.
5. Discussion
5.1. Impact of the optically thick regions on high-angular resolution observations of disks in the sub-mm
So far we have discussed the possible effect of local optically thick regions in the integrated fluxes of young disks in the millimeter. Since the required overdensities needed to make these regions optically thick are typically very large (especially for the low-mass disks, see Tables 1 − 4) one could expect these regions to be easily detectable with high-angular resolution imaging through (sub-)millimeter interferometry. However, the contrast between the surface brightnesses inside and outside the optically thick regions is not the only factor determining the possible observability of these structures. In fact, if the bright optically thick regions were uniformly distributed throughout the disk and with characteristic length scales much smaller than the angular resolution of the observations, they would be smeared out by the convolution with the resolution element.
Since all the high-angular resolution observations of disks conducted so far in the (sub-)mm have revealed a disk structure which is essentially homogeneous, the results of existent observations provide an upper limit to the characteristic length scales of the invoked optically thick regions. The highest angular resolutions achieved so far in the sub-mm are about 0.2 − 0.4 arcsec, corresponding to physical scales of ~30−60 AU at the distances of nearby star forming regions (Isella et al. 2010; Andrews et al. 2011; Guilloteau et al. 2011). Note that this is larger only by a factor of a few than the width of 20 AU considered in Sect. 4.3. This means that if optically thick regions were concentrated in those 20 AU-wide annuli, a radial bump in the surface brightness map could have been marginally detected, although not spatially resolved, by these observations.
In order to probe non-homogeneous structures at smaller scales higher angular resolution is needed. The Atacama Large Millimeter/Submillimeter Array (ALMA) will allow to do that down to scales of a few AU only. For example, ALMA can detect spiral density waves in nearby massive disks (Cossins et al. 2010). As detailed in the next subsection in these regions the concentration of particles might be efficient enough to make the dust emission from spiral arms optically thick.
If non-homogeneous regions will be detected by future observations with very high angular resolution, a prediction of the models presented in this work is that the millimeter spectral index measured in the bright regions should be equal to the spectral index of the Plank function in that region, which would be 2 in the case of Rayleigh-Jeans emission. To determine more precise predictions from these models would require further modelling of the disk structure with a proper treatment of the radiative transport in the optically thick regions. This goes well beyond the scope of this work. The future results coming from observations with ALMA and the EVLA arrays have the potential to guide future developments of disk models along these lines.
Recently, Guilloteau et al. (2011) presented an investigation of the radial variation of the dust properties through a dual-frequency (1.3 and 3 mm) survey of disks in the Taurus-Auriga region with the Plateau de Bure Interferometer. In most disks that are resolved at the two wavelengths, they find a radial dependence of the millimeter spectral index which they interpret as due to a variation of the spectral index of the dust opacity coefficient β throughout the disk. In particular the β-index appears to typically increase from low values (~0−0.5) within ~50−100 AU from the central star to about 1.5 − 2 at the disk outermost regions. In the scenario presented in this work, the same data could be potentially explained in terms of a different efficiency of the physical mechanism(s) concentrating particles in different regions of the disk: in the inner disk, filling factors of optically thick regions f ~ a few × 0.1 could explain the lower spectral indices (see Fig. 2), thus mimicking the effect of a lower β; in the less dense outermost regions the same mechanisms might be not efficient enough to concentrate particles and that could explain the large spectral indices which are typical of optically thin emission from small dust grains (sizes < 0.1 mm).
From the existent data only it is not possible to rule out the scenario described in this paper. We also note here that, if present, high levels of overdensities like those invoked by this analysis can probably occur only in the disk midplane. Because of the lower optical depths at longer wavelengths, only observations in the millimeter (or longer wavelengths) can probe directly the existence of these overdense regions. Observations in the near and mid-infrared probe only the surface layers of the disk, and they would be therefore insensitive to concentrations of particles in the midplane. Also observations in the far-IR (~100 μm) are still significantly affected by optically thick emission from the unperturbed disk structure, at least for typical disks around T Tauri stars with disk masses larger than a few Jupiter masses (see e.g. the analysis by Andrews & Williams 2005). This would make the analysis presented in this paper much more model dependent at IR wavelengths than at longer mm-waves because of the impact of disk structure (e.g. flaring) and the particular choice for the treatment of the radiative transfer in the disk. Note that this might be not the case, especially in the far-IR, for disks with lower masses e.g. around young brown dwarfs. At the same time, depending on the physical mechanism driving this local concentration, the vertical distribution of particles in the disk, and therefore also in the surface layers, might be somewhat affected. In order to accurately determine this effect one would need global dynamical models of dust particles in a gaseous disk coupled with radiative transfer calculations to predict the disk emission in the IR.
In the next subsection we discuss the possible mechanisms proposed in the literature to concentrate particles in the disk. In particular we aim to understand how plausible are the overdensities required to explain optically thick regions considered in the last Sections. To do this we base the discussion on our current theoretical knowledge of the potential processes driving the concentration of solids in young disks.
5.2. Physical plausibility of the required overdensities
To understand whether the overdense optically thick regions discussed in this paper are physically plausible in real protoplanetary disks, one has to compare the required filling factors and overdensities of regions with small <0.1 mm-sized grains discussed in the last section with the outcome of the numerical simulations which investigate different mechanisms leading to the concentration of solid particles. These mechanisms are often invoked in the literature for their potential of halting locally the otherwise fast radial drift of solids (Brauer et al. 2007) and of forming planetesimals in the disk (see a recent review by Chiang & Youdin 2010).
A promising mechanism to concentrate solid particles is through the development of streaming instabilities, in which the gas and solid components are mutually coupled by drag forces in a turbulent disk. Johansen & Youdin (2007) showed that overdensities of particles even larger than 1000 can be formed. Looking at Tables 1 − 4 this indicates that these overdense regions would probably be optically thick also in the millimeter for most of the disk models considered here. However, in terms of the impact to the global disk SED, the filling factor f of these regions is probably not large enough to be really significant: the fraction of particles in overdense regions at level of the order of 100 or above is only about 1% or less (see Fig. 11 in Johansen & Youdin 2007). This means that the filling factor f of disk area occupied by such regions is much lower than that, as the mean distance between particles decreases with increasing density. Furthermore, all these highly-overdense regions are obtained for solid particles which are only marginally coupled to the gas, with values for the Stokes parameter7, St ~ 1. Grains with sizes <0.1 mm, as those considered in this analysis, are instead very well coupled to the gas (St ≪ 1). In the case of streaming instabilities Johansen & Youdin (2007) showed that already for particles with St ~ 0.1, the level of overdensity is decreased by a factor of 10. For these reasons, we argue that, although streaming instabilities may potentially form overdense regions which are optically thick at millimeter wavelengths, they would not reach the required filling factor of the disk surface to explain the observations.
Another possible mechanism which has been proposed to trap solids involves the presence of large anticyclonic vortices in the disk. These structures can be the result of baroclinic instability (Klahr & Bodenheimer 2003), the Rossby wave instability (Lovelace et al. 1999; Regaly et al. 2012), or magneto-rotational instability (Fromang et al. 2005). Recent 2D numerical simulations of circumstellar disks have shown that, although dust overdensities larger than 2 − 3 order of magnitudes can be obtained in vortices covering a significant fraction of the disk surface area, the solids that are trapped are larger than about 10 cm, whereas much smaller sub-mm dust grains are not significantly affected by such structures (Lyra et al. 2009).
Long-lived axisymmetric pressure bumps have been obtained in simulations of magneto-rotational turbulent disks (Johansen et al. 2009). These pressure bumps have the potential of trapping solids which are marginally coupled to the gas, like mm-cm sized pebbles, but the obtained overdensities in gas are not large enough ( ≲ 10 − 20%) to redistribute more gas-coupled small grains at the levels required for the optically thick regime (Tables 1 − 4).
Finally, some concentration of dust particles can occur in disks undergoing gravitational instabilites. In these disks, the non-linear evolution of the instabilities lead to the formation of spiral waves with local overdensities in the gas component as high as about 100 (Rice et al. 2004; Boss 2010). Since sub-mm sized particles are well coupled to the gas, the same level of overdensity is expected for small grains as well. Considering that spiral waves are characterized by very extended structures, the results presented in this work show that the overdense regions in spiral waves can be optically thick even at mm-wavelengths and can even dominate the emission of a young disk at these wavelengths. This means that for gravitational unstable disks the measured low values of the mm-spectral index (α1−3 mm ≲ 3.0) can be potentially explained by the optically thick emission of small grains from overdense regions in spiral waves. However, in order for disks to develope these instabilities, they need to be rather massive. Recent numerical simulations of Boss (2010) have shown that more than about 0.04 M⊙ inside 20 AU are needed around a 1 M⊙ young star, or about 0.02 M⊙ around a 0.5 M⊙ young star as considered in this work. By assuming a standard ISM-like value of 100 for the gas-to-dust ratio, this lower-limit corresponds to 2 × 10⁻⁴ M⊙ of dust mass inside 20 AU from the central protostar. Therefore, only the mm-fluxes of disks in the bright tail of the F1 mm − α1−3 mm diagram can be explained by accumulation of unprocessed small grains via gravitational instabilities. High sensitivity and angular resolution imaging with ALMA in the sub-mm will soon constrain the occurrence of these instabilities in real disks (Cossins et al. 2010).
Summary of the CARMA observations at 102.5 GHz.
6. Summary
In this work we investigated the effect of possible local optically thick regions on the mm-wave emission of protoplanetary disks. The main goal of this exercise was to see what kind of structures are needed to explain the low values of spectral indices measured for protoplanetary disks in nearby star forming regions, without invoking the presence of mm-sized particles in the disk outer regions.
To quantify this potential effect we considered a simple disk model in which the disk is filled with regions with optically thick emission even at long millimeter wavelengths. In our calculations these regions occupy a fractional area of the disk which is left as a free parameter of the models, and we derive the predicted mm-fluxes for a range of different values for the parameters defining the structure of the unperturbed disk.
Interestingly, our analysis shows that relatively small filling factors for these optically thick regions can reproduce the measured fluxes of young disks in the (sub-)millimeter. In most cases, if the filling factor is kept constant throughout the disk, values lower than a few percent are sufficient to match the observed data. If the regions are instead localized in annuli with a width of ~10 AU, the required filling factors increase to a few × 10%.
A significant local increase of the optical depth in the disk can be caused by the concentration of solid particles, as predicted by different physical mechanisms potentially acting in the disk. We discuss the physical plausibility of the required optically thick regions. In particular we investigate whether the required overdensities are reproduced in the simulations of the physical processes proposed in the literature to drive the concentration of particles.
The main conclusion of this work is that for the vast majority of disks no physical processes proposed so far are capable to reproduce the measured low mm-spectral indices via a concentration of small ( ≪ 0.1 mm) particles in optically thick regions. According to our current knowledge of these processes, only for the brightest disks, likely the most massive ones, the total mm-wave emission can be strongly affected by optically thick spiral arms and innermost dense regions. The results of this analysis further strengthen the scenario for which the measured low spectral indices of protoplanetary disks at long wavelengths are due to the presence of large mm/cm-sized pebbles in the disk outer regions. Observations of disks at (sub-)millimeter and centimeter wavelengths can therefore be used to constrain the models of the early phases of planetesimal formation.
Appendix A: New CARMA observations at 3 mm
We describe here new mm-wave observations of nine YSOs in the Taurus-Auriga star forming region (SFR). The sources were selected for being relatively bright at sub-mm/mm wavelengths, namely with a flux density at 0.85 mm greater than 100 mJy and/or a 1.3 mm-flux density greater than 30 mJy. This criterion was chosen to have high chances to detect our sources at about 3 mm with the Combined Array for Research in Millimeter Astronomy (CARMA). The observed YSOs are listed in Table 1.
The dust thermal emission toward our sample of nine young disk systems in Taurus-Auriga was observed with CARMA between 2010 March 2 and April 6. The array was in C configuration which provides baselines between 30 and 350 m. Observations were carried out at a central frequency of 102.5 GHz (2.92 mm), with a total bandwidth of 4 GHz. The raw visibilities for each night were calibrated and edited using the MIRIAD software package. Amplitude and phase calibration were performed through observations of the QSOs 0336+323 (for 04113+2758, V892 Tau, FN Tau), 3C 111 (for IC 2087, AB Aur, BP Tau, V836 Tau), 0449+113 (for DQ Tau). Passband calibration was obtained by observing the QSO 3C 84. Mars and Uranus were used to set the absolute flux scale. The uncertainty on CARMA flux calibration is typically estimated to be 15% and is due to uncertainties in the planetary models and in the correction for atmospheric effects and hardware instabilities (see Ricci et al. 2011, for an analysis of the repeatability of 3mm-flux measurements with CARMA on observations performed in the same time period of the ones presented here). Maps of the dust continuum emission were obtained by standard Fourier inversion adopting natural weighting, and photometry was obtained in the image plane. The resulting FWHM of the synthesized beam is about 2′′.
Among the nine observed YSOs, we considered the three sources (BP Tau, DQ Tau, V836 Tau) which satisfy the selection criteria adopted in this work and listed in Sect. 2. We instead did not include the other observed sources for the following reasons:
-
AB Aur and V892 Tau, since theyare Herbig Ae/Be stars, and therefore with a central PMS starmore massive than the sample of T Tauri stars considered in thispaper;
-
FN Tau shows evidence of spatially resolved nebulosity in near-infrared scattering light (Kudo et al. 2008), likely due to a leftover protostellar envelope. Furthermore, Momose et al. (2010) showed how disk models fail to reproduce at the same time SMA 0.88 mm observations at high-angular resolution and single dish data at 1.3 mm, confirming that an extended “halo” component is present in the FN Tau system;
-
IC 2087, which is an embedded Class I YSO (Luhman et al. 2010), and therefore, a significant contribution from an extended envelope to the sub-mm/mm emission is expected to occur;
-
MHO 1 and MHO 2, which are part of a binary system with angular separation of 4.0′′ (or about 560 AU at the Taurus distance of 140 pc, Duchene et al. 2004) and no interferometric observations which can separate the two components have been carried out so far in the sub-mm.
As for the three selected sources, according to Luhman et al. (2010), and references therein, BP Tau is a K7-spectral type PMS star, DQ Tau is a double lined spectroscopic binary which consists of two PMS stars with similar specctral type in the range of K7 to M1, and V836 Tau is a K7. Andrews & Williams (2005) reported fluxes for BP Tau of 130 ± 7 mJy and 47 ± 0.7 mJy at about 0.85 and 1.3 mm, respectively, whereas for V836 Tau F0.85 mm = 74 ± 3 mJy, F1.3 mm = 37 ± 6 mJy. The other selected source, DQ Tau, is a circumbinary disk which is known to undergo recurring millimeter flares due to star-star magnetic reconnection events (see Salter et al. 2010, and references therein). By measuring the light curve in the millimeter Salter et al. (2010) estimated a quiescent level of the emission at about 1.3 mm of 97 mJy, and of 17 mJy at 2.7 mm, which is roughly consistent with the measured flux of 14.9 ± 0.6 mJy at 3.2 mm presented in this work. By combining these data with the new ones obtained at 3.2 mm with CARMA (Table 5) for the three selected sources, we obtained the mm-spectral index shown as red empty circles in Figs. 1, 2.
Appendix B: disk properties of the selected sample
In Table 6 we report some of the properties of the 50 disks considered in this analysis. These properties were derived by fitting sub-mm data using two-layer disk models (for more details see the Ricci et al. 2010a,b, 2011a,b, papers).
Properties of the disks.
At these long wavelengths κν is well approximated by a power-law.
This parameter does not affect the sub-mm/mm significantly as long as the emission at these wavelengths is dominated by the optically thin disk regions. However this it not true anymore when emission from optically thick regions becomes important. In this paper we have adopted a value of 30o for the disk inclination of all the modelled disks.
Note that here we have implicitly assumed that the dust opacity does not change within the disk.
For all the disks considered in this work, more than 80% of the unperturbed disk mass is contained within 300 AU.
The value of the normalization factor in Eq. (3), i.e. Σ0, is set after fixing the (unperturbed) dust mass in the disk.
Note that in some cases the disk models predict values for the spectral index α1−3 mm which are lower than 2. This is because the Rayleigh-Jeans regime is not completely reached at these wavelengths in the outer and cooler regions of the disks.
The Stokes parameter is an adimensional parametrization for the particle size in a gaseous disk. In the Epstein regime, which is relevant for the conditions in the disks treated in this work, St = πaρs/(2Σgas), where a and ρs are the particle size and density, respectively.
Acknowledgments
L.R. aknowledges the Ph.D. fellowship of the International Max-Planck-Research School. L.T. and F.T. acknowledge support from ASI under contract with INAF-Osservatorio Astrofisico di Arcetri. Support for CARMA construction was derived from the states of California, Illinois, and Maryland, the James S. McDonnell Foundation, the Gordon and Betty Moore Foundation, the Kenneth T. and Eileen L. Norris Foundation, the University of Chicago, the Associates of the California Institute of Technology, and the National Science Foundation. Ongoing CARMA development and operations are supported by the National Science Foundation under a cooperative agreement, and by the CARMA partner universities.
References
- Andrews, S. M., & Williams, J. P. 2005, ApJ, 631, 1134 [NASA ADS] [CrossRef] [Google Scholar]
- Andrews, S. M., Wilner, D. J., Hughes, A. M., Qi, C., & Dullemond, C. P. 2009, ApJ, 700, 1502 [NASA ADS] [CrossRef] [Google Scholar]
- Andrews, S. M., Wilner, D. J., Hughes, A. M., Qi, C., & Dullemond, C. P. 2010, ApJ, 723, 1241 [NASA ADS] [CrossRef] [Google Scholar]
- Andrews, S. M., Wilner, D. J., Espaillat, C., et al. 2011, ApJ, 732, 42 [NASA ADS] [CrossRef] [Google Scholar]
- Beckwith, S. V. W., & Sargent, A. I. 1991, ApJ, 381, 250 [NASA ADS] [CrossRef] [Google Scholar]
- Beckwith, S. V. W., Sargent, A. I., Chini, R. S., & Guesten, R. 1990, AJ, 99, 924 [NASA ADS] [CrossRef] [Google Scholar]
- Bertout, C., Robichon, N., & Arenou, F. 1999, A&A, 352, 574 [NASA ADS] [Google Scholar]
- Birnstiel, T., Ricci, L., Trotta, F., et al. 2010, A&A, 516, L14 [NASA ADS] [CrossRef] [EDP Sciences] [Google Scholar]
- Boss, A. P. 2010, ApJ, 725, 145 [NASA ADS] [CrossRef] [Google Scholar]
- Brauer, F., Dullemond, C. P., Johansen, A., et al. 2007, A&A, 469, 1169 [NASA ADS] [CrossRef] [EDP Sciences] [Google Scholar]
- Chiang, E., & Goldreich, P. 1997, ApJ, 490, 368 [NASA ADS] [CrossRef] [Google Scholar]
- Chiang, E., & Youdin, A. N. 2010, AREPS, 38, 493 [Google Scholar]
- Cossins, P., Lodato, G., & Testi, L. 2010, MNRAS, 407, 181 [NASA ADS] [CrossRef] [Google Scholar]
- Cutri, R. M., et al. 2003, 2MASS All Sky Catalog of point sources [Google Scholar]
- Draine, B. T. 2006, ApJ, 636, 1114 [NASA ADS] [CrossRef] [Google Scholar]
- Duchene, G., Bouvier, J., Bontemps, S., André, P., & Motte, F. 2004, A&A, 427, 651 [NASA ADS] [CrossRef] [EDP Sciences] [Google Scholar]
- Dullemond, C. P., Dominik, C., & Natta, A. 2001, ApJ, 560, 957 [NASA ADS] [CrossRef] [Google Scholar]
- Fromang, S., & Nelson, R. P. 2005, MNRAS, 364, L81 [NASA ADS] [CrossRef] [Google Scholar]
- Guilloteau, S., Dutrey, A., Pietu, V., & Boehler, Y. 2011, A&A, 529, A105 [NASA ADS] [CrossRef] [EDP Sciences] [Google Scholar]
- Isella, A., Carpenter, J. M., & Sargent, A. I. 2009, ApJ, 701, 260 [NASA ADS] [CrossRef] [Google Scholar]
- Isella, A., Carpenter, J. M., & Sargent, A. I. 2010, ApJ, 714, 1746 [NASA ADS] [CrossRef] [Google Scholar]
- Johansen, A., & Youdin, A. 2007, ApJ, 662, 627 [NASA ADS] [CrossRef] [Google Scholar]
- Johansen, A., Youdin, A., & Klahr, H. 2009, ApJ, 697, 1269 [NASA ADS] [CrossRef] [Google Scholar]
- Klahr, H. H., & Bodenheimer, P. 2003, ApJ, 582, 869 [NASA ADS] [CrossRef] [Google Scholar]
- Kudo, T., Tamura, M., Kitamura, Y., et al. 2008, ApJ, 673, L67 [NASA ADS] [CrossRef] [Google Scholar]
- Lovelace, R. V. E., Li, H., Colgate, S. A., & Nelson, A. F. 1999, ApJ, 513, 805 [NASA ADS] [CrossRef] [Google Scholar]
- Luhman, K. L., Allen, P. R., Espaillat, C., Hartmann, L., & Calvet, N. 2010, ApJS, 186, 111 [NASA ADS] [CrossRef] [Google Scholar]
- Lynden-Bell, D., & Pringle, J. E. 1974, MNRAS, 168, 603 [NASA ADS] [CrossRef] [Google Scholar]
- Lyra, W., Johansen, A., Zsom, A., Klahr, H., & Piskunov, N. 2009, A&A, 497, 869 [NASA ADS] [CrossRef] [EDP Sciences] [Google Scholar]
- Mathis, J. S., Rumpl, W., & Nordsieck, K. H. 1977, ApJ, 217, 425 [NASA ADS] [CrossRef] [Google Scholar]
- Menten, K. M., Reid, M., Forbrich, J., & Brunthaler, A. 2007, A&A, 474, 515 [NASA ADS] [CrossRef] [EDP Sciences] [Google Scholar]
- Momose, M., Ohashi, N., Kudo, T., Tamura, M., & Kitamura, Y. 2010, ApJ, 712, 397 [NASA ADS] [CrossRef] [Google Scholar]
- Natta, A., Testi, L., Neri, R., Shepherd, D. S., & Wilner, D. J. 2004, A&A, 416, 179 [NASA ADS] [CrossRef] [EDP Sciences] [Google Scholar]
- Natta, A., Testi, L., Calvet, N., et al. 2007, in ed. B. Reipurth, D. Jewitt, & K. Keil (Tucson: University of Arizona Press), Protostars & Planets V, 783 [Google Scholar]
- Regaly, Zs., Juhasz, A., Sandor, Zs., & Dullemond, C. P. 2012, MNRAS, 419, 1701 [NASA ADS] [CrossRef] [Google Scholar]
- Ricci, L., Testi, L., Natta, A., et al. 2010a, A&A, 512, A15 [NASA ADS] [CrossRef] [EDP Sciences] [Google Scholar]
- Ricci, L., Testi, L., Natta, A., & Brooks, K. 2010b, A&A, 521, A66 [NASA ADS] [CrossRef] [EDP Sciences] [Google Scholar]
- Ricci, L., Mann, R. K., Testi, L., et al. 2011a, A&A, 525, A81 [NASA ADS] [CrossRef] [EDP Sciences] [Google Scholar]
- Ricci, L., Testi, L., Williams, J. P., Mann, R. K., & Birnstiel, T. 2011b, ApJ, 739, L8 [CrossRef] [Google Scholar]
- Rice, W. K. M., Lodato, G., Pringle, J. E., Armitage, P. J., & Bonnell, I. A. 2004, MNRAS, 355, 543 [NASA ADS] [CrossRef] [Google Scholar]
- Rodmann, J., Henning, T., Chandler, C. J., Mundy, L. G., & Wilner, D. J. 2006, A&A, 446, 211 [NASA ADS] [CrossRef] [EDP Sciences] [Google Scholar]
- Salter, D. M., Kóspál, Á., Getman, K. V., et al. 2010, A&A, 521, A32 [NASA ADS] [CrossRef] [EDP Sciences] [Google Scholar]
- Semenov, D., Henning, T., Helling, C., Ilgner, M., & Sedlmayr, E. 2003, A&A, 410, 611 [NASA ADS] [CrossRef] [EDP Sciences] [Google Scholar]
- Testi, L., Natta, A., Shepherd, D. S., & Wilner, D. J. 2001, ApJ, 554, 1087 [Google Scholar]
- Testi, L., Natta, A., Shepherd, D. S., & Wilner, D. J. 2003, A&A, 403, 323 [NASA ADS] [CrossRef] [EDP Sciences] [Google Scholar]
- Warren, S. G. 1984, ApOpt, 23, 1206 [Google Scholar]
- Weidenschilling, S. J. 1977, MNRAS, 180, 57 [NASA ADS] [CrossRef] [Google Scholar]
- Weingartner, J. C., & Draine, B. T. 2001, ApJ, 548, 296 [NASA ADS] [CrossRef] [Google Scholar]
- Wilking, B. A., Gagné, M., & Allen, L. E. 2008, in Handbook of Star Forming Regions: Vol. II, The Southern Sky, ed. Reipurth (San Francisco, CA: ASP), 351 [Google Scholar]
- Wilner, D. J., Ho, P. T. P., Kastner, J. H., & Rodriguez, L. F. 2000, ApJ, 534, L101 [NASA ADS] [CrossRef] [PubMed] [Google Scholar]
- Wilner, D. J., D’Alessio, P., Calvet, N., et al. 2005, ApJ, 626, L109 [NASA ADS] [CrossRef] [Google Scholar]
- Zubko, V. G., Mennella, V., Colangeli, L., & Bussoletti, E. 1996, MNRAS, 282, 1321 [NASA ADS] [CrossRef] [Google Scholar]
All Tables
Required dust overdensities in the added optically thick regions inside a ring between 10 and 20 AU from the central star.
Required dust overdensities in the added optically thick regions inside a ring between 30 and 40 AU from the central star.
Required dust overdensities in the added optically thick regions inside a ring between 50 and 60 AU from the central star.
Required dust overdensities in the added optically thick regions inside a ring between 80 and 90 AU from the central star.
All Figures
|
Fig. 1 Flux density at 1 mm vs. spectral index between 1 and 3 mm. In each panel red, blue and green points represent observational data of disks in Class II YSOs in Taurus (Ricci et al. 2010a, and this work), Ophiuchus (Ricci et al. 2010b), and Orion Nebula Cluster (Ricci et al. 2011a,b), respectively. The 1 mm-fluxes in the Orion Nebula Cluster have been multiplied by a factor of (420 pc/140 pc)2 to compensate for the different distances estimated for the Orion (~420 pc, Menten et al. 2007) and Taurus/Ophiuchus regions (~140 pc, Bertout et al. 1999; Wilking et al. 2008). Red empty circles are the three Class II YSOs observed with CARMA and discussed in Appendix A. Black symbols show the model predictions for different unperturbed dust mass: triangles for 10-5 M⊙, stars for 10-4 M⊙, and squares for 10-3 M⊙. Solid lines connect disk models with the same unperturbed dust mass, whereas dashed lines connect models with the same constant filling factor f for the optically thick regions, with values indicated in the bottom right side of each panel. In each panel a given couple of the (γ, rc)-parameters has been assumed for the unperturbed disk structure, with values indicated in the top left corner. |
| In the text | |
|
Fig. 2 As in Fig. 1, but with optically thick regions localized in annuli of 10 AU-width, with inner and outer radii indicated in the top left corner of each panel. The unperturbed structure of the disk is characterized by γ = 0.5 and rc = 60 AU. |
| In the text | |
Current usage metrics show cumulative count of Article Views (full-text article views including HTML views, PDF and ePub downloads, according to the available data) and Abstracts Views on Vision4Press platform.
Data correspond to usage on the plateform after 2015. The current usage metrics is available 48-96 hours after online publication and is updated daily on week days.
Initial download of the metrics may take a while.