| Issue |
A&A
Volume 540, April 2012
|
|
|---|---|---|
| Article Number | A76 | |
| Number of page(s) | 12 | |
| Section | Interstellar and circumstellar matter | |
| DOI | https://doi.org/10.1051/0004-6361/201118054 | |
| Published online | 28 March 2012 | |
New activity in the large circumstellar disk of the Be-shell star 48 Librae⋆
1 European Organisation for Astronomical Research in the Southern Hemisphere, Casilla 19001, Santiago 19, Chile
e-mail: This email address is being protected from spambots. You need JavaScript enabled to view it.
2 UJF-Grenoble 1/CNRS-INSU, Institut de Planétologie et d’Astrophysique de Grenoble (IPAG) UMR 5274, Grenoble, France
3 Instituto de Astronomia, Geofísica e Ciências Atmosféricas, Universidade de São Paulo, Rua do Matão 1226, Cidade Universitária, São Paulo, SP 05508-900, Brazil
4 European Organisation for Astronomical Research in the Southern Hemisphere, Karl-Schwarzschild-Str. 2, 85748 Garching bei München, Germany
5 Gemini Observatory, Southern Operations Center, c/o AURA, Casilla 603, La Serena, Chile
Received: 8 September 2011
Accepted: 5 February 2012
Abstract
Aims. Spectroscopic, polarimetric, and high spectral resolution interferometric data covering the period 1995–2011 are analyzed to document the transition into a new phase of circumstellar disk activity in the classical Be-shell star 48 Lib. The objective is to use this broad data set to additionally test disk oscillations as the basic underlying dynamical process.
Methods. The long-term disk evolution is described using the V/R ratio of the violet and red emission components of Hα and Brγ, radial velocities and profiles of He i and optical metal shell lines, as well as multi-band BVRI polarimetry. Single-epoch broad-band and high-resolution interferometric visibilities and phases are discussed with respect to a classical disk model and the given baseline orientations.
Results. Spectroscopic signatures of disk asymmetries in 48 Lib vanished in the late nineties but recovered some time between 2004 and 2007, as shown by a new large-amplitude and long-duration V/R cycle. Variations in the radial velocity and line profile of conventional shell lines correlate with the V/R behavior. They are shared by narrow absorption cores superimposed on otherwise seemingly photospheric He i lines, which may form in high-density gas at the inner disk close to the photosphere. Large radial velocity variations continued also during the V/R-quiet years, suggesting that V/R may not always be a good indicator of global density waves in the disk. The comparison of the polarization after the recovery of the V/R activity shows a slight increase, while the polarization angle has been constant for more than 20 years, placing tight limits on any 3-D precession or warping of the disk. The broad H-band interferometry gives a disk diameter of (1.72 ± 0.2) mas (equivalent to 15 stellar radii), position angle of the disk (50 ± 9)° and a relatively low disk flattening of 1.66 ± 0.3. Within the errors the same disk position angle is derived from polarimetric observations and from photocenter shifts across Brγ. The high-resolution interferometric visibility and phase profiles show a double or even multiple-component structure. A preliminary estimate based on the size of the Brγ emitting region indicates a large diameter for the disk (tens of stellar radii). Overall, no serious contradiction between the observations and the disk-oscillation model could be construed.
Key words: techniques: spectroscopic / circumstellar matter / techniques: interferometric / stars: mass-loss / techniques: polarimetric / stars: emission-line, Be
Based partly on observations collected at the European Southern Observatory, Chile (Prop. Nos. 383.D-0522, 266.D-5655, 081.C-0475).
© ESO, 2012
1. Introduction
Circumstellar matter around rapidly rotating classical Be stars has been studied since the discovery by Secchi (1866) of emission lines in γ Cas. Only some 60 years later, Struve (1931) laid the foundation to the notion of a flattened structure of this matter. It took again more than 60 years until the disk nature was unambiguously proved by the combination of polarimetry and interferometry (e.g. Quirrenbach et al. 1997). For a general overview of classical Be stars and their properties see Porter & Rivinius (2003).
New and archival 48 Lib spectroscopic datasets in the visual and near-IR range.
During the last decade, the rate of progress was much accelerated by the availability for detailed modeling of combined high-resolution spatial and spectral observations. This concerns especially the disk dynamics. Perhaps the most manifest empirical indicator of dynamical processes in Be star disks is the so-called V/R ratio of the strengths of violet and red emission-line components. The nature of this variability has long remained somewhat enigmatic. Today, it is widely accepted that the long-lived and frequently quasi-periodic structural variations of emission lines find their basic explanation in one-armed density waves of the disk (Okazaki 1997; Carciofi et al. 2009). Although the non-periodicity of the variability makes it difficult to distinguish systematic residuals from ephemeral events, the study of density waves and other phenomena triggered by the presence of a stellar companion has a strong potential for revealing the structure, dynamics, and secular evolution of Be disks (Carciofi 2011).
The activity and even the existence of Be disks typically vary on timescales of years, including their temporary absence. The gas of the disk is both provided and dissipated by the central star, with the disk build-up often resulting from discrete stellar mass-loss events/episodes (e.g., Baade et al. 2011; Carciofi et al. 2012). It is assumed that the rotationally induced quadrupole moment of the stellar gravitational potential is the driving force of the disk oscillations (Papaloizou et al. 1992). In view of extended periods without observable V/R activity, this invites the question whether variable star-to-disk mass transfer or restructurings of the disk (e.g., to a more ring-like profile, Rivinius et al. 2001) play a role in triggering or quenching density waves.
High-resolution amber and broad-band pionier observations of 48 Lib and ζ Tau.
Spectro-interferometry has a distinct potential to permit new insights to be gathered. After the angular resolution of circumstellar disks by broad-band interferometry in the 1990s (Quirrenbach et al. 1997), the increasing spectral resolution of interferometric equipment afforded detailed investigations also of the disk dynamics. Gies et al. (2007) determined the size, inclination, and orientation of four northern Be-star disks by means of broad-band K observations with the CHARA array. Later, Meilland et al. (2007) detected an asymmetry in the disk of κ CMa using the spectro-interferometric capabilities of amber at medium resolution (MR, R = 1200). MR amber observations were also used for a multi-technique study of another bright Be star, ζ Tau (Štefl et al. 2009; Carciofi et al. 2009).
In the second half of the 20th century, the HαV/R ratio of 48 Lib (HD 142983, B3Ve, V ~ 5.0) went through a number of irregular long-term cycles (see, e.g., Hanuschik et al. 1995). Strong, narrow shell absorption lines show that the line of sight intersects the disk. The large stellar vsini of ~400 km s-1 implies that the disk is equatorial.
Pott et al. (2010) used the spectro-astrometric mode of the Keck interferometer to study the structure of the 48 Lib circumstellar disk. The derived disk size was 1.65 mas in the K-band continuum, estimated at about seven times the stellar diameter. The disk was also resolved in several Pfund lines. Although the spectral resolution did not exceed 1000, the self-phase referencing mode permitted the authors to obtain differential astrometric precision of 3 micro-arcsec. Pott et al. concluded that the continuum and the Pfund emission lines originate from a more compact region within the Br γ emission zone, consistent with the fact that the Pfund lines are weaker than the Br γ line. They also inferred that deviations from axisymmetry are radius-dependent, which is characteristic of one-armed disk oscillations.
One purpose of this report is to put the recently resumed emission line variability in the circumstellar disk of 48 Lib into a common perspective with the general spectroscopic and polarimetric variability in the interval 1995–2011. We also present results of the first amber high-spectral resolution (HR, R = 12 000) interferometry of this star with a fairly complex appearance of interferometric visibilities and phases. Similar HR observations of ζ Tau (not used by Štefl et al. 2009) are included to demonstrate that this complexity may well not be a singular peculiarity but rather some commonality only revealed at higher spectral resolution. The two stars also have significant long-term V/R variations in common.
Basic geometrical parameters of the disk are derived by fitting an axisymmetric Gaussian disk model to the pionier H-band observations, but an exact dynamical modeling using amber HR data and the HDUST code is postponed to the dedicated paper in preparation. A toy model that is unable to describe the dynamics of disk density waves would only be an unnecessary or even confusing half-step and is not included in this paper.
2. Observations
2.1. Optical and near-infrared spectroscopy
To identify long-term variations and trends in the spectroscopic properties, data obtained with the Heros spectrograph (Kaufer 1998) between 1995 and 2003 that are included in the statistical study by Rivinius et al. (2006) were re-analyzed. This echelle spectrograph covers the spectral region of 3500–8600 Å in 2 arms with a gap of about 200 Å between them. During the observations of 48 Lib, the spectrograph was attached to the ESO (La Silla) 50-cm and Ondřejov 2-m telescopes.
The ESO Science Archive only contains two sets of uves (Dekker et al. 2000) echelle spectra, which were obtained on July 11, 2001 and April 3, 2008. Although each of them is limited to one night, they enable a detailed comparison of spectral lines before and after the density wave became detectable again (see Fig. 2). Additional red and blue optical spectra at R = 16 000 were secured at the Pico dos Dias Observatory (OPD) of the Laboratório Nacional de Astrofísica (LNA), Brazil, on July 2, 2009 and May 12, 2011. The observations were made with a Cassegrain spectrograph equipped with a 1200 grooves/mm grating blazed at 6562 Å and a 1024 × 1024 pixel CCD. To identify long-term HαV/R trends in 2007–2011, we also used spectra from the BESS database (http://basebe.obspm.fr), which mainly comprises observations by amateur astronomers. The spectral resolution of some BESS datasets is quite low but they define the V/R variations well.
In August 2009, a high-resolution (R = 45 000) spectrum of the Brγ profile was obtained with the GEMINI/phoenix echelle near-IR spectrograph (Hinkle et al. 2003). The spectrum covers the interval 2.16–2.17 μm, and the 40 s integration gave a signal-to-noise ratio S/N ~ 170.
The characteristics of the spectra and their origin are summarized in Table 1.
2.2. Imaging polarimetry
New multi-band linear polarimetry was obtained in the period May 2009–September 2010 using the IAGPOL imaging polarimeter attached to the Cassegrain focus of the 0.6-m Boller & Chivens telescope at OPD/LNA. We used the CCD camera with a polarimetric module described in Magalhães et al. (1996), employing a rotating half-wave plate and a calcite prism placed in the telescope beam. A typical observation consists of eight consecutive wave-plate positions separated by 22 5. Details of the data reduction can be found in Magalhães et al. (1984). In each observing run at least one of HD 183143, HD 145502, and HD 187929 was observed as the polarized standard star to calibrate the position angle.
For comparison with the polarimetric status before the new V/R cycle commenced we used seasonal means in the U, B, V, R, I bands in 1990–1998 published by McDavid (2001, 1994, 1999). The values are based on observations obtained with the polarimeter described by Breger (1979), which is mounted on the University of Texas 0.9-m telescope at McDonald Observatory. For the period 1989–1994, they were complemented by V-band Halfwave Polarimeter data (HPOL; Nordsieck & Harris 1996) from the 0.9-m telescope of Pine Bluff Observatory, which were retrieved from the web site http://www.sal.wisc.edu/HPOL.
All polarimetric observations were corrected for the interstellar polarization of (0.819 ± 0.050)% and PA = (96 ± 5)° derived by Draper & Wisniewski (priv. comm.) using HPOL spectropolarimetry and a Serkowsky law with λmax = 5591 Å.
2.3. Interferometry
Broad-band interferometric observations in the H band were obtained with the pionier (LeBouquin et al. 2011) visitor instrument and the four 1.8-m auxiliary telescopes of ESO’s VLTI system (Glindemann et al. 2003) on June 04, 2011. The AT configuration was D0-G1-H0-I1, with baselines ranging from 40 m to 65 m. The fringes were slightly dispersed over three spectral channels across the H band. The observing conditions were poor (DIMM (Sarazin & Roddier 1990) seeing ~1.5–2.0′′ and coherence time < 1 ms). But we were able to reduce the data with the standard pndrs package described by LeBouquin et al. (2011). The observations provide the simultaneous measurement of six absolutely calibrated visibilities and four closure-phases in the H-band.
High-spectral resolution (HR; R = 12 000) interferometric observations in the K band were obtained with the amber instrument (Petrov et al. 2007) and the 8-m UT telescopes of the VLTI on May 12, 2009. For comparison, amber observations of ζ Tau obtained during science verification of the HR mode on October 7, 2008 were retrieved from the ESO Science Archive. The three-telescope baseline configuration was UT1-UT2-UT4 for both stars. The observing conditions were average to good for 48 Lib (DIMM seeing ~0.8–0.9′′, coherence time ~6.3 ms), but quite poor during the ζ Tau observations (DIMM seeing ~1.2–1.5′′, coherence time only ~1.5 ms).
The central wavelength was set to 2.171958 μm in the first order to match the Br γ line. The finito fringe tracker (Le Bouquin et al. 2007) enabled us to record the whole spectral region with integration times of 3 s and 1 s for 48 Lib and ζ Tau, respectively. HD 143033 (diameter 1.36 ± 0.04 mas) was observed as the calibrator after 48 Lib and HD 33833 (0.818 ± 0.056 mas) before ζ Tau. The diameters of both calibrators were adopted from the catalog by Mérand et al. (2005). The dates of the observations are given in Table 2. u-v plots of the 48 Lib pionier and amber observations are shown in Fig. 1.
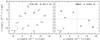 |
Fig. 1 u-v coverage of the 48 Lib pionier and amber observations. Spatial frequencies corresponding to the minimum, central, and maximum wavelength are plotted for each baseline. |
The reduction of the amber data was performed using the yorick amdlib3.0 package (Tatulli et al. 2007; Chelli et al. 2009). The wavelength scale – affected by a problem with the positioning of the amber grating – was corrected by fitting telluric lines using the Python procedure written by Merand. The same methods as in Štefl et al. (2009) were applied to derive absolute and differential quantities for visibilities, phases, and closure phases across the Br γ line. Following the recommendation by Tatulli et al. (2007) and Millour et al. (2008), only the top 50% of the frames with the best S/N were averaged for calibrators as well as science targets to derive the transfer function and obtain absolutely calibrated spectra. However, because of the setting inconsistency between the science target and the calibrator, only the differential visibilities and phases were derived for ζ Tau.
Differential visibilities, phases, and closure phase were averaged, and the values were normalized relative to the continuum in the intervals 2.150–2.158 μm and 2.178–2.190 μm. The differential method enables a more precise measurement of quantities with respect to the adjacent continuum. Compared to the absolute method, a significantly higher S/N can be obtained because the atmosphere affects all spectral channels in nearly the same way. However, the absolute calibration of the angular size of the observed object is lost.
3. Spectroscopic results
3.1. Long-term V/R variations of emission lines
The V/R ratio in our spectra was measured as the ratio of the emission peak heights (above the zero flux level) derived by fitting a Gaussian to the upper part of the peaks.
Some V/R studies (e.g. Okazaki 1997) report that 48 Lib went through four V/R cycles with lengths of about 13.5, 12, 7.5, and 10 years between 1950 and 1994. The statement is supported mainly by Fig. 1 in Hanuschik et al. (1995), in which one can identify V/R maxima close to 1950 and approximately in 1963, 1975, 1982 and 1992. However, the plot combines V/R variations derived from Hα, Hβ and Hγ lines and for the 1975 maximum no Hα values are plotted. As indicated also by the large differences between Hα and Hβ/Hγ values, combining V/R values of different Balmer lines may result in a misleading picture both for observational and theoretical reasons:
-
Hβ and γ are formed in the inner disk closer to the central star than Hα and map different parts of the density wave spiral structure. Consequently, significant phase shifts between V/R variations of different H i lines can be expected – see Štefl et al. (2009) for ζ Tau or Kogure & Suzuki (1984) for EW Lac;
-
intensities of the V and R peaks in Hβ and γ are much more affected by a strong stellar absorption. No correction using synthetic or template profiles was performed in the early observations.
For the above reasons a recompilation of the V/R variations in HαV/R only was performed and combined with the new 1995–2011 data. Results are shown in Fig. 2a. Because for some of the published datasets the authors used V/R defined as V/R⋆ = (I(V) − I(cont))/(I(R) − I(cont)) and did not publish Hα profiles, this definition had to be accepted also in Fig. 2a. Unlike in Fig. 2b, log (V/R⋆) is plotted.
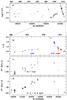 |
Fig. 2 a) History of 48 Lib HαV/R variations (defined as ratio of the peak intensities above the continuum) in the period 1950–2011. The circles mark original data from this paper and from Rivinius et al. (2006), + data compiled from Underhill (1953), Faraggiana (1969), Gray & Marlborough (1974), Slettebak & Reynolds (1978), Andrillat & Fehrenbach (1982)Hanuschik et al. (1995) and Banerjee et al. (2000). b) Hα and BrγV/R variations (defined as the ratio of the full peak intensities) during the period 1995–2010. The arrows mark the dates of amber and uves observations used for this study. Data from different datasets are identified by the following symbols. Hα: + Rivinius et al. (2006, heros , × VLT/uves, ° BeSS database, □ LNA/ecass; Brγ: △ VLTI/amber, ▴ Gemini/phoenix. c) Radial velocities of selected He i lines; mean of He i 4026 and 5878 (°) and He i 6678 (+). The RV error is 3–5 km s-1 for shell lines, but as large as 10–20 km s-1 for He i lines due to their peculiar line profiles. d) Radial velocities of Fe ii (° multiplet 96, □ multiplet 117) and Si ii, multiplet 2 (+). |
The plot reliably, although not precisely in time, shows maxima in 2005 and 1992. A weak maximum in 1980/1981 agrees with that in Hanuschik’s plot. No Hα observations were found in the literature for the period 1963–1976. Figure 2a shows a few higher values around Hanuschik’s maxima in 1950 and 1963, but also a large scatter. All V/R values before 1985 were measured from published Hα profiles derived from photographic plates. We conclude that only two HαV/R cycles are sufficiently documented in the star’s history, giving cycle lengths of about 11 and 15 years. Only the last cycle, see Figs. 2b–d, will be analyzed in more detail in this paper.
Unfortunately, even for the last cycle, there are gaps just when the quasi-periodic oscillations were probably absent (1995–1998) and re-started (at some time between 2004 and 2007). Although detailed information about the Hα behavior in these phases is, therefore, missing, 48 Lib offers one of the not so frequent opportunities to study the recovery of V/R activity in a Be star.
Lower amplitudes seem to be connected with a shorter cycle length. The observations obtained in 2000 show a first small increase in V/R and thereafter almost constant V/R ~ 1.0 for more than two years. A strong increase to V/R ≫ 1 must have taken place at some time between 2004 and 2007. Beginning with the first observation on JD 54 172 after this gap, V/R continued to decrease and now reached the 1996 level of about 0.8. This places a lower limit on the length of the descending branch of the peak in the V/R curve of about 4.2 years. Taking into account the history of the variations since 1970, see Fig. 2a, we can assume that the variability in Fig. 2b is cyclic. From the speculative assumption of a symmetric curve, a V/R cycle length of about 17 years could be derived. This length would be significantly longer than the previous ones observed in the second half of the 20th century. The present descending V/R branch also suggests – consistently with the longer cycle – that the descent started from at least the same or even a higher value than the maximum in the previous activity cycle.
The upper left panel in Fig. 3 shows that the HβV/R ratio follows a similar trend as the one of Hα.
Apart from HαV/R variations, Fig. 2b also includes Br γV/R measurements made in spectra extracted from the amber data and from the single phoenix HR observation. If the BrγV/R curve exactly matches that of Hα, one could infer that Brγ is ahead of Hα by about 300–330 days. For a mean cycle length of 15 years, this would correspond to a phase shift of 19–22°.
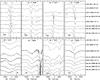 |
Fig. 3 Long-term variations of H β and selected Fe ii, Si ii and He i line profiles obtained in 1995–2011. Note the very different scale of the normalized flux, indicated at the bottom of each panel. All heros and uves spectra were smoothed with a 5-pixel filter. The spectrograph and date are marked in the right margin. |
3.2. Absorption line profiles
Shell absorption lines in Be stars are formed in the narrow sector of the circumstellar disk projected on the central star. Since the involved range in azimuth is much larger along the stellar equator than in the more extended circumstellar disk, which moreover – in the Keplerian case – rotates much more slowly than the star, circumstellar absorption lines are mostly much narrower than photospheric lines. In the simplest case of an axi-symmetric, Keplerian disk, the line profiles should be time-invariant.
The shell-star nature of 48 Lib manifests itself through numerous strong and relatively sharp lines from singly-ionized metals in its spectrum. Given the above basic model of Be-shell stars, their temporal variability is evidence of large deviations in the disk from a circular Keplerian radial velocity (RV) field with vrad = 0 km s-1 or a strong azimuthal asymmetry in the density distribution, or both. Their profiles are an important indicator of the disk dynamics, which they sample in a complementary way to emission lines. Furthermore, Hanuschik & Vrancken (1996) discovered extremely narrow multiple components of Fe ii shell lines variable both in RV and depth on a timescale of less than one day. The authors hypothesized that these features could be caused by co-orbiting clumps in the disk or by higher-order distortions of the global density wave causing the V/R variations seen in the emission lines.
Figure 3 shows line profiles of Hβ and some shell and He i lines in selected epochs in 1995–2011. The shell lines exhibit variations in depth and width, which are linked to V/R (previous subsection) and RV variations (see next subsection) in Hα. Both depths and widths of the shell lines reach a maximum close to the phase of minimal V/R and RV. Owing to missing data, the observational correlation is not clear for V/R > 1. The deeper lines may also show a blue-wing asymmetry as it would result from motions toward the observer. It is worth noting that Fig. 3 may be somewhat misleading because it is biased by the lower resolution of the OPD/LNA spectra.
The profiles of He i lines are quite unusual. The entire optical region covered by the uves and heros spectra contains only two lines with profiles not obviously strongly affected by superimposed shell components, namely He i 4713 and He i 5786. However, even the core of the latter is probably contaminated by circumstellar absorption. In spite of the low S/N in He i 4713, Fig. 3 illustrates that the line suffers from strong profile and asymmetry variations.
He i 4471 and most other He i lines show fairly complex profiles with one or more absorption components. Most of them turn out to be superimposed metallic lines, e.g. Fe ii 4469.485 and 4472.086, or Fe ii 6677.305 in the lines He i 4471 and 6678, respectively. However, because most He i lines follow the same RV trend as the shell lines, one cannot exclude that their absorption cores are blends of metal and He i lines. Extended blue wings of He i 5876 and 6678 can be recognized during MJD 52 000–54 000, while depressions in the red wing occurred in the interval MJD 50 000–51 000 and around MJD 55 000.
The observed line-profile variability strongly suggests that the above assumed distinction between photospheric and circumstellar lines is not nearly as simple as presented. On the other hand, the profiles of lines formed in the disk are important line-of-sight probes of the disk dynamics, which they sample in a complementary way to emission lines. The same diagnostics is not available for Be stars not viewed through the disk.
The only datasets of this study with spectral resolution sufficient for the detection of very narrow (FWHM ~ 10 km s-1) optical absorption components as reported by Hanuschik & Vrancken (1996) are those from uves. However, no such narrow component could be detected in Fe ii profiles. A search in the heros spectra, the very first of which was obtained only two days after those by Hanuschik & Vrancken on March 10, 1995 (their Fig. 1) also remained without positive results. Because the spectral resolution of heros at 5300 Å is only ~15 km s-1, one cannot decide whether the components were just not detected or really disappeared. A splitting of the absorption core or traces of extra absorption components can be seen in some Fe ii lines in the heros spectra obtained in 1996, but they cannot be reliably attributed to the same phenomenon.
3.3. Radial velocities
Variable line profiles are quantitatively easiest characterized by radial-velocity (RV) measurements, especially if they have narrow cores. Without higher-order perturbations, RVs of photospheric and shell lines in Be stars should be the same. However, Rivinius et al. (2006) pointed out very high negative radial velocities of shell lines (–200 km s-1) in 48 Lib although the star probably is not a binary (cf. Sect. 6). Timescales of years are difficult to reconcile with any stellar processes. Therefore, the variable radial velocities result from gas motions in the disk, and, as shown by Okazaki (1997), the cycle lengths match periods of disk oscillations well. But there is no straightforward interpretation of the RV of line cores in terms of particle trajectories or streaming motions because the line profiles are convolutions of velocity profiles with density and excitation profiles.
To study the nature of the time-dependent RV field, radial velocities of Fe ii and Si ii lines were measured by fitting a Gaussian to the cores of their absorption profiles. The results plotted in Fig. 2d show that HαV/R and shell RV variations are well correlated. The stagnation of the V/R variations in 1996–2003 was accompanied by an increase in the RV of shell lines by about 100 km s-1. In 2011, the values returned to the same negative velocity of about –100 km s-1 as in the end of the 1990s. Separately plotted in Fig. 2d are mean velocities for Fe ii multiplets 96 (spectral lines at 4508, 4549 and 4583 Å) and 117 (lines 5197, 5234, 5275, and 5317 Å) and Si ii multiplet 2 (lines 6347, 6371 Å). In the LNA spectra, only lines of Fe ii multiplet 96 and Si ii could be measured. In spite of this inhomogeneity and different spectral resolutions, the values for different multiplets and for Fe ii and Si ii do not show significant differences. Accordingly, the differentiation of the velocity field with excitation potentials may be small.
The contamination of He i profiles by metallic lines implies the potential risk that the He i RVs are biased. The risk was minimized by
-
Checking for the presence of metallic lines in the region ofeach He i line using a catalog of spectrallines (Reader et al. 1980).He i 6678, formedin the upper photosphere or even inner disk, as wellas He i 4026 andHe i 5876 wereidentified as the least contaminated ones according toboth line catalog and visual inspection of the lines. TheHe i 4713 line wasnot included in the mean. This line is very shallow so thatRV measurements are strongly affected bynoise and imperfectly corrected echelle ripple functions.
-
Measuring He i RVs in the line wings by fitting the profile between approximately one and two thirds of the core intensity by a Gaussian. The FWHM of the shell lines (variable, 50–80 km s-1 as measured in HR uves spectra) is much lower than that of He i lines (300–380 km s-1). Provided that shell lines do not affect the line wings, they bring about a line profile distortion and a larger scatter in RV, but they do not significantly affect the measured RVs. The fact that the RVs of different He i lines are consistent also excludes the possibility that they are mistaken for those of shell lines. The corresponding shifts of the entire broad He i absorption profiles can also be recognized visually in Fig. 3.
Somewhat surprisingly, the RVs of selected He i lines broadly agree with those of more classical shell lines. Figure 2c shows RVs of He i 6678 and the mean RV of He i 4026 and He i 5876. The scatter in the RVs of the He I lines is considerably higher than for shell lines. Figure 3 also documents that line cores of all He i lines are variable on a long timescale exhibiting wide ranges in shape and strength. All these effects lead to errors in the RVs of He i lines of a few tens of km s-1.
The errors are largest for the two lines that are supposedly mainly formed in the photosphere. He i 4026 shows two components, which are much broader than dynamical shell lines. The blue component dominated the RV measurements in 1995–2003 and was included in the means plotted in Fig. 2. Similar, but much more difficult to measure, components are present in He i 4009.
Apart from the large scatter, there are also considerable systematic differences between the RVs of individual lines. Note that the values plotted in Fig. 2 are not representative of the radial velocity of He i. They were merely included to illustrate some basic similarities to conventional shell lines.
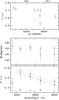 |
Fig. 4 48 Lib polarization observations: upper panel – decreasing p trend in V (°) and I (+) bands in the period 2009–2010. Lower panels – mean polarization and polarization angle vs. spectral band in the periods 1990–1998 (black △) and 2009–2010 (red °). Straight lines in the bottom panel show the regression fits to the BVRI bands for both epochs. Within the errors the spectral slope does not change. |
4. Imaging polarimetry
McDavid (1999) performed a time-series analysis of his broadband polarimetry covering more than a decade. While the polarization angle, Θ, was constant, the degree of the polarization, p, suggested quasi-cyclic variability, which McDavid fitted with a period equal to one-half of the cycle length of the HαV/R cycle. The peak-to-peak amplitude in p was about 0.1%. A correlation with the V/R variability could be caused by the density variations associated with one-armed disk oscillations. The double-frequency variability of the polarization might arise because polarization cannot distinguish between the density enhancement being on the left or the right side of the disk. Unfortunately, the OPD/LNA polarimetry does not cover the V/R stillstand, which might have provided an interesting test of the proposed, still unconfirmed interpretation.
The upper panel of Fig. 4 shows a decreasing V and I band polarization trend in 2009–2010. A similar decrease is present also in the remaining spectral bands. The relative error of an individual observation is 2–4%, while the drop of polarization in the given period is 10–15%. The lower two panels compare the mean values of p and Θ for 48 Lib in the period 1990–1998 derived from the data of McDavid (1994, 1999) with the OPD/LNA observations obtained in 2009–2010. V-band Pine Bluff Observatory data from 1989–1994 yield slightly lower values of p than those derived from the McDavid dataset: p(V) = (0.519 ± 0.070)% and Θ(V) = (150.3 ± 1.0)°. Because for an optically thin or moderately thick disk, the polarization angle is always perpendicular to the disk plane (Wood et al. 1996), the value of Θ derived by McDavid is equivalent to the disk position angle (60.3 ± 1.0)°. The errors show standard deviations, which are biased by real intrinsic variations as shown in the upper panel. Similarly, the 1990–1998 means are derived from seasonal averages and may be affected by variations on a timescale of years.
Assuming overestimated standard deviations due to real trends, the difference between the mean polarization in the 90s and 2009–2010 can be considered as real and together with the decreasing temporal trend suggests that the polarization was increased at the time of the V/R recovery and in 2009–2010 it was returning to the level measured in the 90s. To within the errors, there is no change in the wavelength dependence. The maximum polarization appears in the B band.
Best fit for the parametric modeling of the H-band continuum emission from pionier data. Position angles are defined north to east.
5. Interferometry
5.1. Continuum
The disk continuum emission around 48 Lib is marginally resolved by the H broad-band pionier interferometric observations. We studied its morphology via parameter modeling using the LITpro package (Tallon-Bosc et al. 2008). Results are summarized in Table 3. To facilitate the comparison with other published disk diameters, we first fitted the dataset with a uniform disk model, which yields θUD = (1.34 ± 0.05) mas. We then modeled more realistically the H band emission as a Gaussian profile disk and an unresolved component (the central star) that contributes two thirds of the total flux (Dougherty et al. 1994). The derived FWHM of θGD = (1.44 ± 0.05) mas is consistent with the results by Pott et al. (2010) (1.65 mas) obtained in the K-band continuum with the Keck interferometer.
Although an axisymmetric Gaussian disk plus an unresolved component reproduce the full pionier dataset relatively well ( ), we explored the possibility to constrain the disk position angle. We obtained a better fit (
 ) with an elongated Gaussian disk whose major axis has a FWHM of
 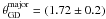 mas and a position angle of (50 ± 9)° (north to east). The ratio between the FWHM of the major and the minor axis is
 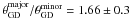 . Well within the errors, the polarimetric and the interferometric PA of the disk are consistent.
Finally, we explored the possibility of a fully resolved component that would be the signature of a dim shell with a spatial extent significantly larger than the disk itself. The resulting best-fit model has a negligible shell contribution of 0.01 ± 0.02 of the total flux and an increased  value compared to the model without shell. We conclude that a shell whose integrated contribution is more than a few percent in the H band is not probable around 48 Lib.
5.2. Brγ line
The spectro-interferometric observations of 48 Lib were carried out with amber during the descending branch of the V/R activity (see arrows in Fig. 2). Because Fig. 2 does not cover the 48 Lib V/R maximum and the cycle length is much more variable than in ζ Tau (Štefl et al. 2009), the phase estimate is little accurate. One can, however, estimate that the amber observations took place close to phase 90° since V ≃ R. This is also the approximate phase of the amber observations of ζ Tau, which justifies the inclusion of the latter data for comparison.
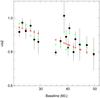 |
Fig. 5 Absolute visibilities for 48 Lib in the H band obtained with pionier and auxiliary telescopes at the D0-H0-G1-I1 VLTI baseline configuration. Black dots mark the observed visibilities, crosses ( × , red) the fit with a Gaussian disk, and plus signs (+, green) the fit with an elongated disk. |
The high-quality observations of 48 Lib permit good-fidelity differential visibility and phase profiles to be derived (Fig. 7). The disk was well-resolved at all three baselines, both in continuum and line emission. At the UT1-UT4 baseline, the disk was almost over-resolved in Brγ. Although the data were absolutely calibrated, the analysis of continuum visibilities yields results inconsistent with pionier continuum visibilities and with polarimetric observations. Consequently, only differential visibilities and phase profiles over Brγ are discussed below.
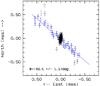 |
Fig. 6 Relative photocenter shifts derived from the amber differential phases across Brγ. After excluding the outliers at extreme offsets and points corresponding to the continuum (−50 < NE < 50) the linear regression fit (blue line) to the photocenters across the line (plotted in blue) yields the disk position angle (48.5 ± 1.5)°. The NE shifted points correspond to the shorter-wavelength wing of the Brγ emission profile, the SW shifted points to its longer-wavelength wing. |
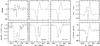 |
Fig. 7 Differential visibilities, differential phases, and closure phase for 48 Lib. Lengths and position angles of individual baselines are: UT1-UT2 56.6 m@26.2°, UT2-UT4 89.4 m@81.3°, and UT1-UT4 130.2 m@60.4°. |
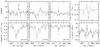 |
Fig. 8 Differential visibilities, differential phases, and closure phase for ζ Tau. The baselines were the same as for 48 Lib (cf. Fig. 7). |
For disk emission lines, simple uniform or Gaussian disk models predict a single-peak central reversal (akin to a spectral-line flux profile with superimposed circumstellar emission line) in the visibility and a smooth S-shaped phase profile. Indeed, Fig. 7, baseline UT1-UT2, exhibits such an S-shape phase profile. However, overall the 48 Lib HR amber profiles are significantly different. All Brγ visibility profiles show a double-component structure with a central peak and an extra peak, superimposed to the S-shape phase profile conventionally seen at lower spectral resolution.
The height of the central peak in the 48 Lib visibility function reaches the level of the continuum at the intermediate baseline and about half of it at the longest and shortest one. The central visibility peak seen at the UT1-UT4 baseline is accompanied by a multi-peak phase profile. At the UT2-UT4 baseline, only a very weak phase reversal emerged in the negative lobe of the S, and the UT1-UT2 baseline shows a pure S-shaped profile (see Fig. 7).
The low-noise 48 Lib data also reveal a rich structure in the closure phase profile. The high amplitude of the closure phase indicates a strong asymmetry. However, the splitting into both positive and negative peaks is well above the noise level.
In spite of the higher noise, a similar double-component structure can be seen in the ζ Tau visibility and phase profiles (Fig. 8). The central peak in V2 almost reaches the continuum level at the UT2-UT4 baseline. Unlike in 48 Lib, the visibility shows a gradual increase in the longer-wavelength wing and an asymmetry between the two visibility components. For ζ Tau, both interferometry and polarimetry give a disk major axis position angle of 32° (Štefl et al. 2009). This is almost parallel to the UT1-UT4 baseline and the difference in position angle to the other two baselines is only about 30°. Although none of the baselines was close to perpendicular in the October 2008 amber observations, Fig. 8 still indicates some features over and above the basic S-shape. But their significance should be verified by better quality data with different baseline angles.
Not only are the HR amber observations of 48 Lib and ζ Tau quite similar, they are also fully consistent with comparable observations of five other classical Be stars discussed by Štefl et al. (2012).
The differential phase signal can be converted into the 2D astrometric shift p(λ), which defines shifts of the photocenters in individual wavelength bins across the spectral line and the orientation of the disk major axis projected on the sky. Here we consider the applicability of the photocenter approach to 48 Lib and other Be stars. The photocenter can be interpreted using the Zernike-van Cittern theorem and moments of the flux distribution (Lachaume 2003, see their Eq. (4) for the definition of the nth moment). In this formalism, the phase of the interferometric signal is proportional to the first flux moment, defined as the photocenter vector, and a third-order term, related to the object symmetry. The symmetry is described by the closure phase (Lachaume’s Eqs. (8b) and (10)). If the closure phase is close to zero, the conversion from the phase to the astrometric shift can be made by inverting the formula  (1)where b is the interferometric baseline vector projected onto the sky. Because the phase does not depend on the second moment in the first approximation a sufficient condition for the conversion is a negligible closure phase, not necessarily a marginal visibility, as required for the mean diameter or symmetry expressions.
A density wave in the Be star disk obviously leads to asymmetries and moderate or even large closure phase, see Fig. 7 for 48 Lib. Consequently, Eq. (1) can be used only as a rough estimate of the disk orientation.
Figure 6 shows the relative photocenter offsets across the Brγ line with respect to the continuum photocenter. Although it over-constrains the problem, the astrometric shifts were computed for all three baselines and their consistency was checked. The 2-D photocenter was reconstructed from the two shortest baselines (UT1-2, UT2-4) with the lowest noise and sufficiently different PA, see Fig. 1. The UT1-4 baseline is inconsistent. The relatively good agreement of the disk position angles derived from the pionier fit and the amber photocenter shift indicates that the shorter baselines in amber observations were still close to the astrometric regime. The approaching part of the rotating disk (the blue wing in the Brγ line) is oriented in the NE direction, the receding part to the SW.
6. Discussion
Observations of 48 Lib between 1995 and 2011 document a recovery of the V/R activity and suggest a correlation between the underlying density wave and RVs and profiles of metallic shell and He i lines. During a long plateau in the V/R ratio through ~2003 the RV still continued to increase so that an absence of detectable V/R variations does not exclude ongoing global disk oscillations.
The one-armed disk oscillation model has so far not been used to simulate a case like the one observed in 48 Lib with substantial asymmetries of shell lines apparently caused by very large shifts of their cores. Such high RV amplitudes of shell lines were also observed in other Be-shell stars, e.g., ζ Tau (Rivinius et al. 2006). Nevertheless, in the model of Carciofi et al. (2009) for the Be star ζ Tau, the particles orbit the star in very eccentric elliptical orbits. In that particular model, the radial velocities are as high as 100 km s-1. Elliptical orbits could also explain the strongly variable width of metallic shell lines. Obviously, such large intrinsic variations are much more readily observed in disks with an edge-on orientation towards the observer, i.e. in Be-shell stars.
48 Lib is also of special interest because many of its He i lines also exhibit RVs in line wings, which broadly track those of shell lines. Because circumstellar components of He i lines must form very close to the central star, they are a very useful diagnostic of the inner structure of the disk. Observations of Be stars (Rivinius et al. 1998) and modeling of their light curves (Carciofi et al. 2012) provide increasing evidence for a time-dependent mass decretion rate and an episodic refilling of the disk. After the decretion is stopped or significantly reduced, the time scale to stabilize the inner disk in the resulting low-density state is only on the order of weeks to months. The observed strengths and velocities of the He i line cores suggest that a high density is maintained in the inner disk through a high decretion rate. The large outer disk radius estimated from interferometry would be in line with this interpretation.
Extended blue wings of He i 5876 and 6678 as observed during MJD 52 000–54 000 could also be a mass-loss indicator. However, the observed dependency on V/R phase, i.e., azimuth angle of the disk, makes this less likely. An alternative interpretation is offered from our preliminary modeling of the disk dynamics. In some V/R phases, the line-of-sight radial velocity shows an extra minimum in the very inner disk. Such a velocity field could then be responsible for the extended blue wings and even double shell profiles, which were observed close to V = R in ζ Tau by Štefl et al. (2009) [their Fig. 3 and related discussion].
In Be double stars, orbital and V/R periods are in some cases known to be synchronized (Štefl et al. 2007). Their orbital periods are on the order of tens to hundreds of days, e.g. 4 Her: 46.18 d (Koubsky et al. 1997) or ϵ Cap: 128.5 d (Rivinius et al. 2006). For a putative binarity of 48 Lib, Fig. 2 would be consistent with a period of 15–25 years. The shape of the RV curve would imply only minor eccentricity. Therefore, a binary would stay far away from the disk at all times and the very extreme disk variability could hardly result from the presence of a companion star, making a binary model very unattractive for 48 Lib.
Three independent methods – polarimetric angle, LITpro modeling of continuum visibilities and astrometric analysis of the photocenter shifts – yield the position angle of the major disk axis in the interval 48° to 60°. It is worth mentioning that each of the methods may suffer from some systematic errors. The polarimetric angle of 48 Lib depends strongly on the correction for the interstellar polarization. The elongated axially symmetric disk assumed in the LITpro solution can be considered to be only the first-order approximation. The astrometric analysis was applied under conditions that do not guarantee the convertability from the interferometric phase of the used amber observations and must be considered only as a rough estimate. The three methods provide information on parts of the disk at different distances from the central star. While the polarization comes from the inner disk region, which is also close to the region of formation of the H-band continuum, the Brγ line is formed much farther out in the central part of the disk. Considering all the above facts, the data do not exclude the possibility that the position angles of the inner disk and the H-band continuum and Brγ-emitting regions are nearly identical.
The accuracy of the amber absolute visibilities reaches about 5% under optimal conditions (Chelli et al. 2009) and can be estimated between 6 and 10% in our 48 Lib observations. The inconsistency of the amber absolutely calibrated continuum visibilities with those from pionier, polarimetric observations as well as simple LITpro models indicate other problems with the absolute calibration of the amber HR continuum visibilities. Possible, but so far little investigated sources of systematic errors are the fringe tracker finito and integration times as long as several seconds. Note that the test by Chelli et al. (2009) was made only for amber medium resolution and integration times between 0.02 and 0.16 s.
A reliable calibration of the continuum visibilities could be made for the pionier H continuum visibilities. Their fitting by the relatively simple LITpro disk models confirms the disk diameter of 1.7 mas determined by the Keck H broad-band interferometry and the position angle of 60° derived from our polarimetric observations. This diameter at the Hipparcos parallax of 6.97 mas corresponds to 0.25 AU. Assuming a B3V main-sequence star radius of 3.56 R⊙ (Harmanec 1998), the H continuum disk diameter is about 15 R⋆. According to Fig. 1 in Carciofi (2011), the K-band continuum is formed typically at about 1–3 R⋆, but Brγ only about three times farther from the central star. Consequently, we can assume that the diameter of the Brγ emitting region might be at least 30–50 R⋆.
The LITpro estimate confirms that the 48 Lib cicumstellar disk has one of the largest angular diameters among Be stars. A consistent modeling of the 48 Lib disk using more comprehensive interferometry and spectral energy distributions is under consideration. It would also test the Keplerian dynamics assumed by the disk oscillation model, for which the extreme radial velocity amplitudes of shell lines may still be a challenge.
Only thanks to the amber high-spectral resolution mode could the double-component structure of visibility and phase profiles be discovered. In 48 Lib, the Brγ line width is about 45 Å so that at R = 12 000 about 25 wavelength bins sample the central visibility maximum very well and can reveal even more subtle features in the visibility profile. At amber’s medium spectral resolution (R ~ 1500) just three wavelength bins cannot establish the same structure. In spite of the very high phase stability, no double peak structure or traces of a central peak can be seen in visibility profiles of Pott et al. (2010, their Fig. 2), obtained about a year before the amber data and at R = 2000. Spectral resolution is also of key importance for interferometric studies of the disk dynamics.
The occurrence of similar visibility and phase profiles in the more V/R-stable disk of ζ Tau as well as other stars (Štefl et al. 2012) shows that they do not result from a dynamical peculiarity related to the V/R recovery in 48 Lib. Instead, these structures are a general property independent of the phase of disk evolution.
Comparison with the 48 Lib Brγ emission profile offers a simple qualitative explanation of the W-shape visibility profiles. The Brγ visibility is much reduced in the line center, where the line emission drops and the visibility is given mainly by the continuum visibility. Kraus et al. (2012) analyzed HR interferometric observations of the Be stars ζ Tau and β CMi and proposed that phase reversals correspond to the transition from the first to the second visibility lobe. This over-resolution effect can explain the phase reversals in the case of large and close disks like that of 48 Lib. This interpretation is consistent also with the fact that the phase reversal at the UT2-UT4 baseline and the second closure phase minimum appear at the position of the first and deeper visibility minimum. However, the lobe transition may not provide a general explanation of the phase reversal, particularly for less resolved and distant disks. Štefl et al. (2012) speculated that phase reversals and multi-peak closure phase profiles can be caused by secondary effects in the disk and may hint at additional morphological disk features. However, until a realistic modeling of the disks including the density waves is performed, the general explanation of the HR phase and closure phase profiles remains open.
7. Conclusions
The compiled spectroscopic data of 48 Lib confirm that its circumstellar disk is evolving on a timescale of years to decades. The correlation between the HαV/R ratio and RVs of the cores of metallic shell and even He i lines implies a dense inner disk fairly close to the photosphere or even touching it. An elongated disk model fit of the broad-band interferometric data indicates an outer disk radius as large as 15 R⋆ in the H continuum. This leads to an estimate of the Br γ radius of several tens of stellar radii. Together with a relatively large parallax of 6.97 mas, these results make 48 Lib a prime candidate for spectro-interferometric studies of the dynamical structure of Be-star disks. A more exact model would also shed light on the question whether the high-velocity cores of shell and He i lines find their explanation within the density wave model alone or if an episodic gas outflow to, or infall from, the circumstellar disk must be included.
The resumption of the V/R oscillations in the first decade of this century was accompanied by a deepening of the disk shell profiles and an increased polarization degree.
For more than 20 years, the polarization angle has been constant to within the errors and remained unaffected by the disk oscillation, which, therefore, must be purely planar without major 3-D precession or warping.
At high spectral resolution, interferometric visibility and phase show significant deviations from the simple S-shape profile conventionally adopted for the interpretation of interferometric data of Be stars at low and medium spectral resolution. Only a realistic modeling (Faes et al., in prep.) will be able to answer the question if double-component phase or closure phase profiles are always only a consequence of interferometric effects during visibility lobe transitions or if they (also) reflect secondary effects in the disk.
Available at http://www.jmmc.fr/amberdrs
LITpro software available at http://www.jmmc.fr/litpro
Acknowledgments
This work has made use of the BeSS database, operated at LESIA, Observatoire de Meudon, France: http://basebe.obspm.fr. Particularly, we appreciate the effort of amateur astronomers M. Bonnement, R. Buecke, C. Buil, V. Desnoux, T. Garrel, J. Guarro-Fló, F. Houpert, B. Mauclaire, E. Pollmann, J. Ribeiro, J. N. Terry and S. Ubaud. The heros@Ondřejov monitoring was part of a joint project supported by the German Bundesministerium für Bildung und Forschung and the Ministery of Education of the Czech Republic (TSE001009, ME531) as well as the Deutsche Forschungsgemeinschaft and the Academy of Sciences of the Czech Republic (436 TSE 113/18 and 41). S.Š. also appreciates the support of the Academy of Sciences and Grant Agency of the Academy of Sciences of the Czech Republic (AA 3003403, K2043105) in the period of the heros observations. Special thanks go to O. Stahl and M. Maintz for reducing the heros spectra, J. Wisniewski for providing us with the value of the interstellar polarization toward 48 Lib and A. Merand, who gave his Python code for the wavelength correction to our disposal prior to its inclusion in the amdlib3 library. This research has made use of the AMBER data reduction package of the Jean-Marie Mariotti Center1, LITpro service co-developped by CRAL, LAOG and FIZEAU2 and the SIMBAD database, operated at CDS, Strasbourg, France. A.C.C. acknowledges support from CNPq (grant 308985/2009-5) and Fapesp (grant 2010/19029-0). This study is partly based on observations obtained at the Gemini Observatory, which is operated by the Association of Universities for Research in Astronomy, Inc. (AURA), under a cooperative agreement with the NSF on behalf of the Gemini partnership: the National Science Foundation (United States), the Science and Technology Facilities Council (United Kingdom), the National Research Council (Canada), CONICYT (Chile), the Australian Research Council (Australia), Ministério da Ciência e Tecnologia (Brazil) and Ministerio de Ciencia, Tecnología e Innovación Productiva (Argentina). The data presented in this paper originate from Gemini programme GS-2009B-Q-93, observed in queue mode. We thank the anonymous referee for the constructive comments.
References
- Andrillat, Y., & Fehrenbach, C. 1982, A&AS, 48, 93 [NASA ADS] [Google Scholar]
- Baade, D., Rivinius, T., Štefl, S., & Martayan, C. 2011, in Active OB stars, ed. C. Neiner, G. Wade, G. Meynet, & G. Peters (IAU), IAU Symp., 6, 1 [Google Scholar]
- Banerjee, D. P. K., Rawat, S. D., & Janardhan, P. 2000, A&AS, 147, 229 [NASA ADS] [CrossRef] [EDP Sciences] [Google Scholar]
- Breger, M. 1979, ApJ, 233, 97 [NASA ADS] [CrossRef] [Google Scholar]
- Carciofi, A. C. 2011, in Active OB stars, ed. C. Neiner, G. Wade, G. Meynet, & G. Peters (IAU), IAU Symp., 272, 325 [Google Scholar]
- Carciofi, A. C., Okazaki, A. T., Le Bouquin, J.-B., et al. 2009, A&A, 504, 915 [NASA ADS] [CrossRef] [EDP Sciences] [Google Scholar]
- Carciofi, A. C., Bjorkman, J. E., Otero, S. A., et al. 2012, ApJ, 744, L15 [NASA ADS] [CrossRef] [Google Scholar]
- Chelli, A., Utrera, O. H., & Duvert, G. 2009, A&A, 502, 705 [NASA ADS] [CrossRef] [EDP Sciences] [Google Scholar]
- Dekker, H., D’Odorico, S., Kaufer, A., Delabre, B., & Kotzlowski, H. 2000, in Optical and IR Telescope Instrumentation and Detectors, ed. M. Iye, & A. Moorwood (SPIE), SPIE Conf. Ser., 4008, 534 [Google Scholar]
- Dougherty, S. M., Waters, L. B. F. M., Burki, G., et al. 1994, A&A, 290, 609 [NASA ADS] [Google Scholar]
- Faraggiana, R. 1969, A&A, 2, 162 [NASA ADS] [Google Scholar]
- Gies, D. R., Bagnuolo, W. G. J., Baines, E. K., et al. 2007, ApJ, 654, 527 [Google Scholar]
- Glindemann, A., Algomedo, J., Amestica, R., et al. 2003, in Interferometry for Optical Astronomy II, ed. W. Traub (SPIE), SPIE Conf. Ser., 4838, 89 [NASA ADS] [CrossRef] [Google Scholar]
- Gray, D. F., & Marlborough, J. M. 1974, ApJS, 27, 121 [NASA ADS] [CrossRef] [Google Scholar]
- Hanuschik, R. W., & Vrancken, M. 1996, A&A, 312, L17 [NASA ADS] [Google Scholar]
- Hanuschik, R. W., Hummel, W., Dietle, O., & Sutorius, E. 1995, A&A, 300, 163 [NASA ADS] [Google Scholar]
- Harmanec, P. 1998, Bull. Astron. Inst. Czechosl., 39, 329 [Google Scholar]
- Hinkle, K., Blum, R., Joyce, R., et al. 2003, in Discoveries and Research Prospects from 6- to 10-Meter-Class Telescopes II, ed. P. Guhathakurta (SPIE), SPIE Conf. Ser., 4834, 35 [Google Scholar]
- Kaufer, A. 1998, Rev. Mod. Astron., 11, 177 [NASA ADS] [Google Scholar]
- Kogure, T., & Suzuki, M. 1984, PASJ, 36, 191 [NASA ADS] [Google Scholar]
- Koubsky, P., Harmanec, P., Kubat, J., et al. 1997, A&A, 328, 551 [NASA ADS] [Google Scholar]
- Kraus, S., Monnier, J. D., Che, X., et al. 2012, ApJ, 744, 19 [NASA ADS] [CrossRef] [Google Scholar]
- Lachaume, R. 2003, A&A, 400, 795 [NASA ADS] [CrossRef] [EDP Sciences] [Google Scholar]
- Le Bouquin, J.-B., Abuter, R., Bauvir, B., et al. 2007, in Optical and Infrared Interferometry, ed. M. Schöller, W. C. Danchi, & F. Delplancke (SPIE), SPIE Conf. Ser., 7013, 701318–701318–10 [Google Scholar]
- LeBouquin, J., Berger, J., Lazareff, B., et al. 2011, A&A, 535, 67L [Google Scholar]
- Magalhães, A. M., Benedetti, E., & Roland, E. H. 1984, PASJ, 96, 383 [Google Scholar]
- Magalhães, A. M., Rodrigues, C. V., Margoniner, V. E., Pereyra, A., & Heathcote, S. 1996, in Polarimetry of the interstellar medium, ed. W. G. Roberge, & D. C. B. Whittet (ASP), ASP Conf. Ser., 97,118 [Google Scholar]
- McDavid, D. 1994, PASP, 106, 949 [NASA ADS] [CrossRef] [Google Scholar]
- McDavid, D. 1999, PASP, 111, 499 [Google Scholar]
- McDavid, D. 2001, Polarimetry of Early Emission Line Stars, Ph.D. Thesis, Amsterdam Universiteit, 204 [Google Scholar]
- Meilland, A., Millour, F., Stee, P., et al. 2007, A&A, 464, 73 [NASA ADS] [CrossRef] [EDP Sciences] [Google Scholar]
- Mérand, A., Bordé, P., & Coudé du Foresto, V. 2005, A&A, 433, 1155 [NASA ADS] [CrossRef] [EDP Sciences] [Google Scholar]
- Millour, F., Petrov, R. G., Malbet, F., et al. 2008, in ESO Astrophysics Symposia, 978-3-540-76962-0, The 2007 ESO Instrument Calibration Workshop, ed. A. Kaufer, & F. Kerber (Springer-Verlag), 461 [Google Scholar]
- Nordsieck, K., & Harris, W. 1996, in Future UV/Visible Spectropolarimetric Studies of Interstellar Polarization at the University of Wisconsin, ed. W. G. Roberge, & D. C. B. Whittet (ASP), ASP Conf. Ser., 97, 100 [Google Scholar]
- Okazaki, A. T. 1997, A&A, 318, 548 [NASA ADS] [Google Scholar]
- Papaloizou, J. C. B., Savonije, G. J., & Henrichs, H. F. 1992, A&A, 265, L45 [NASA ADS] [Google Scholar]
- Petrov, R. G., Malbet, F., Weigelt, G., et al. 2007, A&A, 464, 1 [NASA ADS] [CrossRef] [EDP Sciences] [Google Scholar]
- Porter, J., & Rivinius, T. 2003, PASP, 115, 1153 [NASA ADS] [CrossRef] [Google Scholar]
- Pott, J.-U., Woillez, J., Ragland, S., et al. 2010, ApJ, 721, 802 [NASA ADS] [CrossRef] [Google Scholar]
- Quirrenbach, A., Bjorkman, K. S., Bjorkman, J. E., et al. 1997, ApJ, 479, 477 [NASA ADS] [CrossRef] [Google Scholar]
- Reader, J., Corliss, C. H., Wiese, W. L., & Martin, G. A. 1980, Wavelengths and transition probabilities for atoms and atomic ions: Part 1, Wavelengths, part 2, Transition probabilities, 68 (NSRDS-NBS) [Google Scholar]
- Rivinius, T., Baade, D., Štefl, S., et al. 1998, A&A, 333, 125 [NASA ADS] [Google Scholar]
- Rivinius, T., Baade, D., Štefl, S., & Maintz, M. 2001, A&A, 379, 257 [NASA ADS] [CrossRef] [EDP Sciences] [Google Scholar]
- Rivinius, T., Štefl, S., & Baade, D. 2006, A&A, 459, 137 [NASA ADS] [CrossRef] [EDP Sciences] [Google Scholar]
- Sarazin, M., & Roddier, F. 1990, ApJ, 227, 294 [Google Scholar]
- Secchi, A. 1866, Astron. Nachr., 68, 69 [NASA ADS] [Google Scholar]
- Slettebak, A., & Reynolds, R. C. 1978, ApJS, 38, 205 [NASA ADS] [CrossRef] [EDP Sciences] [Google Scholar]
- Štefl, S., Okazaki, A. T., Rivinius, T., & Baade, D. 2007, in Active OB-Stars: Laboratories for Stellar and Circumstellar Physics, ed. S. Štefl, S. P. Owocki, & A. T. Okazaki (ASP), ASP Conf. Ser., 361, 274 [Google Scholar]
- Štefl, S., Rivinius, T., Carciofi, A. C., et al. 2009, A&A, 504, 929 [NASA ADS] [CrossRef] [EDP Sciences] [Google Scholar]
- Štefl, S., Rivinius, T., Baade, D., & Carciofi, A. C. 2012, in Resolving the Future of Astronomy with Long-Baseline Interferometry, Socorro, NM, USA, March 28–31, 2011, in press (ASP) [Google Scholar]
- Struve, O. 1931, ApJ, 73, 94 [NASA ADS] [CrossRef] [Google Scholar]
- Tallon-Bosc, I., Tallon, M., Thiébaut, E., et al. 2008, in Optical and Infrared Interferometry, SPIE Conf. Ser., 7013 [Google Scholar]
- Tatulli, E., Millour, F., Chelli, A., et al. 2007, A&A, 464, 29 [NASA ADS] [CrossRef] [EDP Sciences] [Google Scholar]
- Underhill, A. B. 1953, Publ. Dominion Astrophys. Obs. Victoria, 9, 363 [NASA ADS] [Google Scholar]
- Wood, K., Bjorkman, J. E., Whitney, B. A., & Code, A. D. 1996, ApJ, 461, 828 [NASA ADS] [CrossRef] [Google Scholar]
All Tables
Best fit for the parametric modeling of the H-band continuum emission from pionier data. Position angles are defined north to east.
All Figures
|
Fig. 1 u-v coverage of the 48 Lib pionier and amber observations. Spatial frequencies corresponding to the minimum, central, and maximum wavelength are plotted for each baseline. |
| In the text | |
|
Fig. 2 a) History of 48 Lib HαV/R variations (defined as ratio of the peak intensities above the continuum) in the period 1950–2011. The circles mark original data from this paper and from Rivinius et al. (2006), + data compiled from Underhill (1953), Faraggiana (1969), Gray & Marlborough (1974), Slettebak & Reynolds (1978), Andrillat & Fehrenbach (1982)Hanuschik et al. (1995) and Banerjee et al. (2000). b) Hα and BrγV/R variations (defined as the ratio of the full peak intensities) during the period 1995–2010. The arrows mark the dates of amber and uves observations used for this study. Data from different datasets are identified by the following symbols. Hα: + Rivinius et al. (2006, heros , × VLT/uves, ° BeSS database, □ LNA/ecass; Brγ: △ VLTI/amber, ▴ Gemini/phoenix. c) Radial velocities of selected He i lines; mean of He i 4026 and 5878 (°) and He i 6678 (+). The RV error is 3–5 km s-1 for shell lines, but as large as 10–20 km s-1 for He i lines due to their peculiar line profiles. d) Radial velocities of Fe ii (° multiplet 96, □ multiplet 117) and Si ii, multiplet 2 (+). |
| In the text | |
|
Fig. 3 Long-term variations of H β and selected Fe ii, Si ii and He i line profiles obtained in 1995–2011. Note the very different scale of the normalized flux, indicated at the bottom of each panel. All heros and uves spectra were smoothed with a 5-pixel filter. The spectrograph and date are marked in the right margin. |
| In the text | |
|
Fig. 4 48 Lib polarization observations: upper panel – decreasing p trend in V (°) and I (+) bands in the period 2009–2010. Lower panels – mean polarization and polarization angle vs. spectral band in the periods 1990–1998 (black △) and 2009–2010 (red °). Straight lines in the bottom panel show the regression fits to the BVRI bands for both epochs. Within the errors the spectral slope does not change. |
| In the text | |
|
Fig. 5 Absolute visibilities for 48 Lib in the H band obtained with pionier and auxiliary telescopes at the D0-H0-G1-I1 VLTI baseline configuration. Black dots mark the observed visibilities, crosses ( × , red) the fit with a Gaussian disk, and plus signs (+, green) the fit with an elongated disk. |
| In the text | |
|
Fig. 6 Relative photocenter shifts derived from the amber differential phases across Brγ. After excluding the outliers at extreme offsets and points corresponding to the continuum (−50 < NE < 50) the linear regression fit (blue line) to the photocenters across the line (plotted in blue) yields the disk position angle (48.5 ± 1.5)°. The NE shifted points correspond to the shorter-wavelength wing of the Brγ emission profile, the SW shifted points to its longer-wavelength wing. |
| In the text | |
|
Fig. 7 Differential visibilities, differential phases, and closure phase for 48 Lib. Lengths and position angles of individual baselines are: UT1-UT2 56.6 m@26.2°, UT2-UT4 89.4 m@81.3°, and UT1-UT4 130.2 m@60.4°. |
| In the text | |
|
Fig. 8 Differential visibilities, differential phases, and closure phase for ζ Tau. The baselines were the same as for 48 Lib (cf. Fig. 7). |
| In the text | |
Current usage metrics show cumulative count of Article Views (full-text article views including HTML views, PDF and ePub downloads, according to the available data) and Abstracts Views on Vision4Press platform.
Data correspond to usage on the plateform after 2015. The current usage metrics is available 48-96 hours after online publication and is updated daily on week days.
Initial download of the metrics may take a while.