Fig. 2
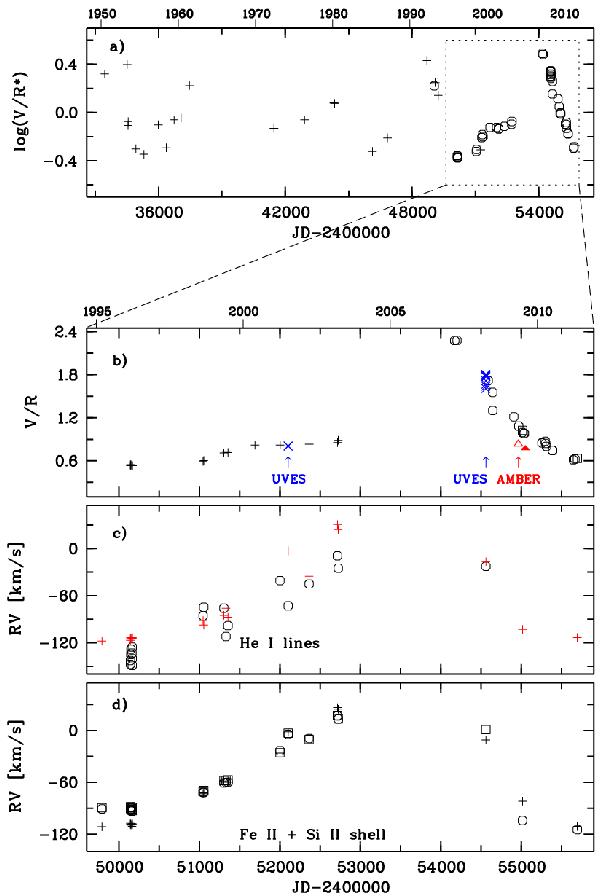
a) History of 48 Lib HαV/R variations (defined as ratio of the peak intensities above the continuum) in the period 1950–2011. The circles mark original data from this paper and from Rivinius et al. (2006), + data compiled from Underhill (1953), Faraggiana (1969), Gray & Marlborough (1974), Slettebak & Reynolds (1978), Andrillat & Fehrenbach (1982)Hanuschik et al. (1995) and Banerjee et al. (2000). b) Hα and BrγV/R variations (defined as the ratio of the full peak intensities) during the period 1995–2010. The arrows mark the dates of amber and uves observations used for this study. Data from different datasets are identified by the following symbols. Hα: + Rivinius et al. (2006, heros , × VLT/uves, ° BeSS database, □ LNA/ecass; Brγ: △ VLTI/amber, ▴ Gemini/phoenix. c) Radial velocities of selected He i lines; mean of He i 4026 and 5878 (°) and He i 6678 (+). The RV error is 3–5 km s-1 for shell lines, but as large as 10–20 km s-1 for He i lines due to their peculiar line profiles. d) Radial velocities of Fe ii (° multiplet 96, □ multiplet 117) and Si ii, multiplet 2 (+).
Current usage metrics show cumulative count of Article Views (full-text article views including HTML views, PDF and ePub downloads, according to the available data) and Abstracts Views on Vision4Press platform.
Data correspond to usage on the plateform after 2015. The current usage metrics is available 48-96 hours after online publication and is updated daily on week days.
Initial download of the metrics may take a while.