Fig. 4
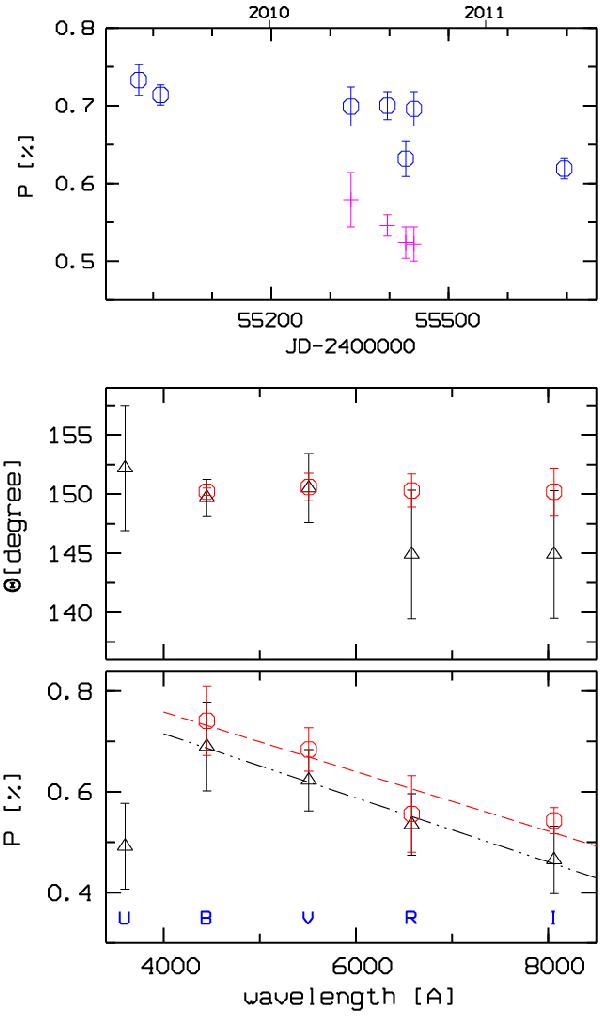
48 Lib polarization observations: upper panel – decreasing p trend in V (°) and I (+) bands in the period 2009–2010. Lower panels – mean polarization and polarization angle vs. spectral band in the periods 1990–1998 (black △) and 2009–2010 (red °). Straight lines in the bottom panel show the regression fits to the BVRI bands for both epochs. Within the errors the spectral slope does not change.
Current usage metrics show cumulative count of Article Views (full-text article views including HTML views, PDF and ePub downloads, according to the available data) and Abstracts Views on Vision4Press platform.
Data correspond to usage on the plateform after 2015. The current usage metrics is available 48-96 hours after online publication and is updated daily on week days.
Initial download of the metrics may take a while.