Free Access
Fig. 3
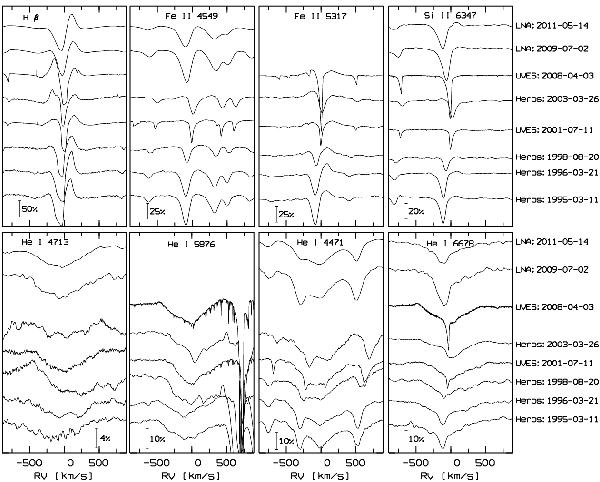
Long-term variations of H β and selected Fe ii, Si ii and He i line profiles obtained in 1995–2011. Note the very different scale of the normalized flux, indicated at the bottom of each panel. All heros and uves spectra were smoothed with a 5-pixel filter. The spectrograph and date are marked in the right margin.
Current usage metrics show cumulative count of Article Views (full-text article views including HTML views, PDF and ePub downloads, according to the available data) and Abstracts Views on Vision4Press platform.
Data correspond to usage on the plateform after 2015. The current usage metrics is available 48-96 hours after online publication and is updated daily on week days.
Initial download of the metrics may take a while.