| Issue |
A&A
Volume 537, January 2012
|
|
|---|---|---|
| Article Number | A8 | |
| Number of page(s) | 25 | |
| Section | Interstellar and circumstellar matter | |
| DOI | https://doi.org/10.1051/0004-6361/201117646 | |
| Published online | 20 December 2011 | |
Herschel/HIFI observations of molecular emission in protoplanetary nebulae and young planetary nebulae⋆,⋆⋆
1 Observatorio Astronómico Nacional (IGN), Ap 112, 28803 Alcalá de Henares, Spain
e-mail: This email address is being protected from spambots. You need JavaScript enabled to view it.
2 Observatorio Astronómico Nacional (IGN), Alfonso XII N ◦ 3, 28014 Madrid, Spain
3 European Space Astronomy Centre, ESA, PO Box 78, 28691 Villanueva de la Cañada, Madrid, Spain
4 CAB, INTA-CSIC, Ctra de Torrejón a Ajalvir, km 4, 28850 Torrejón de Ardoz, Madrid, Spain
5 Instituut voor Sterrenkunde, Katholieke Universiteit Leuven, Celestijnenlaan 200D, 3001 Leuven, Belgium
6 Sterrenkundig Instituut Anton Pannekoek, University of Amsterdam, Science Park 904, 1098 Amsterdam, The Netherlands
7 Onsala Space Observatory, Dept. of Radio and Space Science, Chalmers University of Technology, 43992 Onsala, Sweden
8 Harvard-Smithsonian Center for Astrophysics, Cambridge, MA 02138, USA
9 Max-Planck-Institut für Radioastronomie, Auf dem Hügel 69, 53121 Bonn, Germany
10 The Johns Hopkins University, 3400 North Charles St, Baltimore, MD 21218, USA
11 N. Copernicus Astronomical Center, Rabiańska 8, 87-100 Toruń, Poland
12 Joint ALMA Observatory, El Golf 40, Las Condes, Santiago, Chile
13 Department of Astrophysics/IMAPP, Radboud University Nijmegen, Nijmegen, The Netherlands
14 Astronomical Institute, Utrecht University, Princetonplein 5, 3584 CC Utrecht, The Netherlands
15 Department of Astronomy, AlbaNova University Center, Stockholm University, 10691 Stockholm, Sweden
Received: 7 July 2011
Accepted: 27 September 2011
Abstract
Aims. We aim to study the physical conditions, particularly the excitation state, of the intermediate-temperature gas in protoplanetary nebulae and young planetary nebulae (PPNe, PNe). The information that the observations of the different components deliver is of particular importance for understanding the evolution of these objects.
Methods. We performed Herschel/HIFI observations of intermediate-excitation molecular lines in the far-infrared/submillimeter range in a sample of ten nebulae. The high spectral resolution provided by HIFI allows the accurate measurement of the line profiles. The dynamics and evolution of these nebulae are known to result from the presence of several gas components, notably fast bipolar outflows and slow shells (that often are the fossil AGB shells), and the interaction between them. Because of the diverse kinematic properties of the different components, their emissions can be identified in the line profiles. The observation of these high-energy transitions allows an accurate study of the excitation conditions, particularly in the warm gas, which cannot be properly studied from the low-energy lines.
Results. We have detected FIR/sub-mm lines of several molecules, in particular of 12CO, 13CO, and H2O. Emission from other species, like NH3, OH, H218O, HCN, SiO, etc., has been also detected. Wide profiles showing sometimes spectacular line wings have been found. We have mainly studied the excitation properties of the high-velocity emission, which is known to come from fast bipolar outflows. From comparison with general theoretical predictions, we find that CRL 618 shows a particularly warm fast wind, with characteristic kinetic temperature Tk ≳ 200 K. In contrast, the fast winds in OH 231.8+4.2 and NGC 6302 are cold, Tk ~ 30 K. Other nebulae, like CRL 2688, show intermediate temperatures, with characteristic values around 100 K. We also discuss how the complex structure of the nebulae can affect our estimates, considering two-component models. We argue that the differences in temperature in the different nebulae can be caused by cooling after the gas acceleration (that is probably caused by shocks); for instance, CRL 618 is a case of very recent acceleration, less than ~100 yr ago, while the fast gas in OH 231.8+4.2 was accelerated ~1000 yr ago. We also find indications that the densest gas tends to be cooler, which may be explained by the expected increase of the radiative cooling efficiency with the density.
Key words: stars: AGB and post-AGB / circumstellar matter / stars: mass-loss / planetary nebulae: general
Herschel is an ESA space observatory with science instruments provided by European-led Principal Investigator consortia and with important participation from NASA.
Appendix A is available in electronic form at http://www.aanda.org
© ESO, 2012
1. Introduction
Asymptotic giant branch (AGB) stars, together with the thick circumstellar envelopes (CSEs) around them, evolve to form planetary nebulae (PNe) through the phase of protoplanetary nebulae (PPNe). The AGB stars are mass-losing red giants surrounded by spherical, slowly expanding CSEs, while PNe, surrounding blue or white dwarfs, show in most cases strong axial symmetry or ring-like geometries and very fast bipolar jets. The transition time between these very different stages is extremely short, only about 1000 yr, during which the intermediate PPNe develop a wide variety of structures.
The PPNe and young PNe already present fast bipolar outflows, along with slower components with velocities similar to those of AGB envelopes. These bipolar flows typically reach velocities of 50–100 km s-1, and affect a sizable fraction of the nebular mass, ~0.1–0.3 M⊙ (Bujarrabal et al. 2001). This remarkable dynamics is thought to be the result of the interaction between the AGB and post-AGB winds: axial, very fast jets ejected in the very first post-AGB phases would collide with the denser material ejected during the AGB phase (e.g. Balick & Frank 2002). The presently observed bipolar outflows would then correspond to a part of the relatively dense shells ejected during the last AGB phase, mostly their polar regions, accelerated by the shocks that propagate during the PPN phase. Many aspects of this process are, however, not yet well understood.
The massive bipolar outflows in PPNe, as well as the unaltered remnants of the AGB shells, usually show strong emission in molecular lines (e.g. Bujarrabal et al. 2001), which is the best tool to study these nebulae. Several PPNe have been extensively observed in mm-wave lines, including interferometric maps with resolutions ~1′′. Thanks to those observations, the structure, dynamics, and physical conditions in a number of PPNe are quite well known. The profiles of the molecular lines have been found to be composite, showing in most sources a central core plus wide line wings. Maps indicate that the line core basically comes from the remnant of the slow AGB wind, which is found to be roughly spherical or confined to equatorial regions. On the other hand, the line wings come from the fast bipolar outflows, which are more or less elongated in the direction of the nebular axis and show a strong velocity gradient in most sources, the velocity increasing proportionally to the distance to the star. See examples in Sánchez Contreras et al. (2004); Fong et al. (2006); Alcolea et al. (2007); Castro-Carrizo et al. (2010), and further references given below.
However, observations of the low-J transitions are not very useful for studying the warm gas components, in particular those heated by the shocks. The often observed J = 2–1 and J = 1–0 transitions of CO only require temperatures Tk ~15 K to be excited. Indeed, their maximum emissivity occurs for excitation temperatures of 10–20 K, and the line intensities and line intensity ratios depend only slightly on the excitation state in relatively warm gas. Of course, observations in the visible or near-infrared ranges tend to select hot regions with typical temperatures over 1000 K. The proper study of warm gas, 100 K ≲ Tk ≲ 1000 K, therefore requires observations at intermediate wavelengths, in the far-infrared (FIR) and sub-mm ranges.
Because of the crucial role of shocks in the formation of PNe, these warm regions are particularly important for understanding the nebular structure and evolution. In some well-studied cases, e.g. M 1–92, OH 231.8+4.2, and M 2–56 (Bujarrabal et al. 1998; Alcolea et al. 2001; Castro-Carrizo et al. 2002), the high-velocity, massive outflows seem to be very cold, with temperatures ≲ 20–30 K, which implies very fast cooling in the shock-accelerated gas. No warm component, presumably heated by recent shocks, has been identified in these sources until now.
The only PPN in which detailed studies of warm accelerated gas have been peformed is CRL 618. Interferometric imaging of the 12CO J = 2–1 line shows that dense gas in axial structures presents higher temperatures, typically ~50–100 K (Sánchez Contreras et al. 2004). But precisely because of their relatively high excitation, the temperature estimate in these components from CO J = 2–1 is uncertain. Maps of 12CO J = 6–5 were also obtained by Nakashima et al. (2007), but with much less information on the nebular structure. A first attempt to study these warm regions in the FIR was performed by Justtanont et al. (2000), from ISO measurements of CO lines as high as J = 37–36 in CRL 618, CRL 2688, and NGC 7027. These authors indeed found temperatures of several hundred degrees in these sources. The lack of spectral resolution in the ISO data prevented any discussion on the components responsible for the line emission, which made the interpretation of these results difficult in nebulae that show very complex structure and dynamics. (This work and other previous ones are discussed in more detail in Sect. 3.2.) Recent Herschel/HIFI observations in the FIR/sub-mm of CRL 618 (Bujarrabal et al. 2010) with sufficiently high spectral resolution have confirmed that the temperature is relatively high in various kinematic components. The temperature derived by Sánchez Contreras et al. (2004) was found to be too low in some cases, the fast gas showing temperatures typically ~200 K in the bipolar outflow, and significantly higher in its base. Similar high temperatures were found in the innermost regions of the slow component.
The Herschel Space Telescope is well-suited for studying warm gas around evolved stars in the FIR and sub-mm. The high spectral resolution that can be achieved with the heterodyne instrument HIFI (better than 1 km s-1) is particularly important in our case: it is useful to identify the different nebular components in the profiles and allows the analysis of the kinematics, a fundamental parameter in the study of this warm, shocked gas. Here we present Herschel/HIFI observations in a sample of ten PPNe and young PNe of several intermediate-excitation lines of abundant molecules: 12CO and 13CO, H2O, OH, NH3, HCN, SiO, etc. These observations have been obtained as part of the Herschel guaranteed-time key program HIFISTARS, which is devoted to the study of intermediate-excitation molecular lines in nebulae around evolved stars.
2. Observations
We used the HIFI heterodyne spectrometer on board the Herschel Space Telescope (Pilbratt et al. 2010; de Graauw et al. 2010) to observe a number of molecular lines in a total of ten protoplanetary nebulae (PPNe). The observed objects are given in Table 1, where we quote the observed coordinates and additional properties of the sources.
Observed sources.
Herschel/HIFI is an instrument very well suited to observe molecular lines in the FIR and sub-mm domains, providing a very high spectral resolution that allows the line profiles to be resolved. The data were taken using the two orthogonal HIFI receivers, H and V, available at each band, which were systematically averaged after checking that there was no significant difference in the lines detected in both receivers. The spectrometer works in double side-band (DSB) mode, which effectively doubles the instantaneous IF coverage. Care was taken when choosing the local oscillator frequency, maximizing the number of interesting lines that could be observed simultaneously.
A total of nine frequency settings were used (not all of them in all sources), between 557 and 1843 GHz. The settings were chosen to observe the 12CO and 13CO J = 6–5, J = 10–9, and J = 16–15 lines and the H2O 11,0–10,1, 11,1–00,0, 32,1–31,2, 31,2–22,1, 42,2–41,3, and 73,4–72,5 lines. Owing to the wide simultaneous frequency bands observable with HIFI and the double side-band system used, each frequency setting often included other lines. Interesting molecular transitions also placed within the observed bands are the NH3J,K = 1, 0–0,0 and OH  3/2–1/2 rotational lines, as well as lines of C18O, H218O, vibrationally excited H2O, SiO, HCN, CN, etc.
The observed full-band spectra are reproduced in the appendix. In those figures we indicate the upper and lower side-band (USB and LSB) frequency scales and the frequencies of interesting lines placed within the observed bands. Continuum was subtracted in all spectra presented in this paper.
The observations were obtained in the dual-beam-switching (DBS) mode. In this mode, the HIFI internal steering mirror chops between the source position and an emission-free position 3′ away. The telescope then alternatively locates the source in either of the chopped beams, providing a double-difference calibration scheme, which allows a more efficient cancellation of the residual standing waves in the spectra. This procedure works very well except for the highest frequencies (HIFI band 7, above 1700 GHz), where noticeable ripples were found in some spectra, especially in the V-receiver. Other spurious effects in the baselines were found in a few cases, particularly around 1200 GHz owing to very different behaviors of the sub-band baselines, which were sometimes difficult to remove.
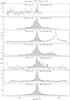 |
Fig. 1 HIFI observations including detected 12CO, 13CO, and C18O lines in CRL 618 (Tmb vs. LSR velocities). The shadowed regions indicate the velocity ranges in which we can expect emission from the considered line, often mixed with emission from other lines. Note for instance the emission of HCN superposed to 12CO 10–9 and the overlapping lines 12CO 16–15 and OH 3/2–1/2 (for more details, see the observed full-band spectra in the appendix). |
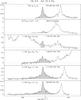 |
Fig. 2 HIFI observations of CRL 618 including detected lines of H2O, OH, and NH3 (Tmb vs. LSR velocities). The shadowed regions indicate the velocity ranges in which we can expect emission from the considered line, often mixed with emission from other lines (see identifications in Fig. A.1). |
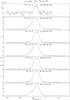 |
Fig. 3 HIFI observations including detected 12CO, 13CO, and C18O lines in CRL 2688 (Tmb vs. LSR velocities). |
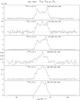 |
Fig. 4 HIFI observations including detected 12CO, 13CO, and C18O lines in NGC 7027 (Tmb vs. LSR velocities). |
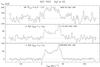 |
Fig. 5 HIFI observations of NGC 7027 including detected lines of H2O and OH (Tmb vs. LSR velocities). |
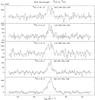 |
Fig. 6 HIFI observations including detected 12CO and 13CO lines in the Red Rectangle (Tmb vs. LSR velocities). |
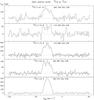 |
Fig. 7 HIFI observations including detected 12CO and 13CO lines in IRAS 22272+5435 (Tmb vs. LSR velocities). |
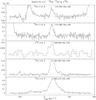 |
Fig. 8 HIFI observations including detected 12CO, 13CO, and C18O lines in OH 231.8+4.2 (Tmb vs. LSR velocities). Note that other lines appear in some spectra, see Fig. A.6. |
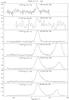 |
Fig. 9 HIFI observations of OH 231.8+4.2 including detected lines of H2O (Tmb vs. LSR velocities). Note that other lines appear in some spectra, see Fig. A.6. |
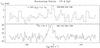 |
Fig. 10 HIFI observations including detected 12CO and H2O lines in the Boomerang Nebula (Tmb vs. LSR velocities). |
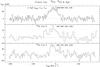 |
Fig. 11 HIFI observations including detected 12CO, 13CO, and H2O lines in Frosty Leo (Tmb vs. LSR velocities). |
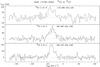 |
Fig. 12 HIFI observations including detected 12CO and 13CO lines, Tmb vs. LSR velocities, in IRAS 17436+5003 (HD 161796). |
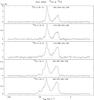 |
Fig. 13 HIFI observations including detected 12CO and 13CO lines in NGC 6302 (Tmb vs. LSR velocities). |
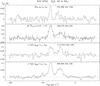 |
Fig. 14 HIFI observations including detected lines of H2O, OH, and NH3 in NGC 6302 (Tmb vs. LSR velocities). |
The HIFI data shown here were taken using the Wide-Band Spectrometer (WBS), an acousto-optical spectrometer that provides simultaneous coverage of the full instantaneous IF-band in the two available orthogonal receivers, with a spectral resolution of about 1.1 MHz. In some cases, the spectra were smoothed to improve the S/N ratio.
We processed the data using the standard HIFI pipeline in the HIPE software, with a modified version of the level 2 algorithm that yields unaveraged spectra with all spectrometer sub-bands stitched together. Later on, the spectra were exported to CLASS using the hiClass tool within HIPE, for further inspection, “flagging” data with outstanding ripple residuals, final averaging and calibration, and baseline removal. Even if spurious effects in the baselines were in a few cases impossible to remove, we have only considered baselines of moderate degree, in general just of degree 1, at most of degree 3.
The data were originally calibrated in antenna temperature units and later converted into main-beam temperatures (Tmb). A summary of the telescope characteristics and observational uncertainties, including the spatial resolution and the conversion factors to main-beam units, can be found in the Herschel observers’ manual and the HIFI instrument and calibration web page (see http://herschel.esac.esa.int). We recall that the FWHM beam sizes range between about 33 and 12 arcsec (inversely proportional to the observed frequency) and Tmb/TA ratios range between 1.3 and 1.5.
In Figs. 1 to 14 we show zoom-ups of selected lines detected in our sources, in LSR velocity and Tmb units. In CRL 618 some of these lines were already presented and discussed by Bujarrabal et al. (2010); here we have reanalyzed all data and included new observations. In Figs. 1 and 2, corresponding to CRL 618, we have indicated in gray the velocity range expected for each line profile because of the very complex spectra and wide profiles characteristic of this nebula. Data of the most interesting sources will be described and analyzed in detail in forthcoming papers.
3. Results
In several objects, namely in CRL 618, CRL 2688, OH 231.8+4.2, NGC 6302, Frosty Leo, and IRAS 17436+5003 (HD 161796), we can separate the emission of the line central core (which is the dominant peak in almost all cases) from that of the line wings, which are expected to come from the fossil AGB envelope and from the fast outflows resulting from the post-AGB axial acceleration respectively (Sect. 1). We have already studied in detail the case of CRL 618 (Bujarrabal et al. 2010); our data of CRL 2688 and OH 231.8+4.2, which are also well-known nebulae, will also be analyzed in more depth in forthcoming papers.
In others (the Red Rectangle, the Boomerang Nebula, and IRAS 22272+5435) we detected no line wings. The Red Rectangle shows a peculiar dynamics dominated by rotation, involving only moderate speeds (Bujarrabal et al. 2005); see preliminary analysis of our data in Sect. 3.1. In IRAS 22272+5435 no fast flows have been detected to date and molecules are apparently abundant only in a relatively slow-moving shell (Bujarrabal et al. 2001; Fong et al. 2006). The Boomerang Nebula, a less well studied object, shows a low-velocity warm component plus, probably, very cold high-velocity gas, which cannot be detected in high-J CO emission (Bujarrabal & Bachiller 1991; Sahai & Nyman 1997).
Finally, NGC 7027 is a complex nebula mainly composed of a slightly elongated (empty) shell that shows many peculiarities (Nakashima et al. 2010). Our line profiles are composite and intense, as expected in view of mm-wavelength data. In this source, we did not try any simplified discussion in terms of line-core and -wing emission because of its complex structure. The interpretation is also hindered by the relatively large angular extent of the nebula. Our single-point observations of CO J = 2–1 (from the 30 m telescope) and J = 16–15 (from Herschel), those showing the highest angular resolution, are more sensitive to the central part of the nebula image. Therefore, these data tend to detect only the extreme LSR velocities (~10 and 40 km s-1), because owing to projection effects the emission in these velocities comes from the central regions of the expanding shell image. The optically thin 13CO lines and C18O J = 6–5 show high intensity in the central velocities; they should come from slow gas with very high column density. 12CO J = 6–5 shows a very strong self-absorption in the blue part of the spectrum, expected in optically thick lines from expanding gas. This self-absorption is much stronger in this line than in the J = 2–1 and J = 1–0 ones, indicating particularly high opacity and relatively warm gas in the shell. Finally we note that H2O lines clearly come from the fastest gas, though in this case the spatial resolution is not very high. These results suggest that H2O formation in this C-rich environment is a result of the shocks that accelerated the gas. Curiously, the OH emission (observed with higher spatial resolution) is not intense in high-velocity features. Obviously, NGC 7027 is one of the sources for which the high-excitation molecular emission requires a careful modeling; results will soon be reported (Santander-García et al. 2011, in prep.).
In Table 2 we show characteristic intensities of the CO lines averaged over representative regions of the profiles, the center and the blue and red wings, in the sources in which they can be adequately defined. Intensities of H2O lines in the same velocity ranges are shown in Table 3. The adopted velocity ranges are given in those tables. To follow a procedure as objective as possible, avoiding any bias from a priori ideas about the nature of the sources, intensities are averaged in all cases over velocity ranges 5 km s-1 wide and defined following a standard procedure. This width seems a good compromise to yield an intensity average over a relatively large number of spectral channels, but it is narrow enough to allow the separation of each spectral feature, as we will see below, and to avoid integrating spectral regions whose emission is too weak. In the definition of these velocity ranges, we have taken into account previous observations of low-J CO lines to identify the different components in the line profiles, which are not always easily seen in our profiles. In particular, values of the systemic and expansion velocities of the slow components are mainly based on data and estimates of these parameters by Bujarrabal et al. (2001). We have also confirmed the identification of these features in terms of kinematical components from published maps and checked possible contaminations between their emissions. For the line wings, the representative velocity slots were slightly more separated from the center than the slow-component expansion velocity to avoid contamination from that component, in particular the relative minima caused by absorption by the outer slow gas, which can be clearly seen in some profiles. In a few cases, the line core may also be contaminated by emissions of fast outflows that, owing to projection effects, may show LSR velocities close to the systemic one; we have checked for each individual nebula, taking into account the existing information (see below), that this contamination is negligible for the used velocity slots.
We can see detailed information on the structure and kinematics of CRL 618 in Sánchez Contreras et al. (2004); maps of IRAS 17436+5003 are shown by Castro-Carrizo et al. (2004). Both sources show an extended slow component, inside which fast bipolar flows are placed, whose emissions can be well identified in single-dish profiles (Bujarrabal et al. 2001). The general structure of CRL 2688 is similar, but the fast gas structure is complex and several collimated jets exist, see Fong et al. (2006) and Cox et al. (2000, note that the extended component is significantly filtered out in these interferometric data). The relatively narrow velocity slot in the center used here minimizes contamination by emission from jets running almost in the plane of the sky, which can be present in this source; on the other hand, the contribution of the fast component to the single-dish profiles is delimited well by the absorption feature seen in single-dish observations. The fast bipolar flows in Frosty Leo are more extended than the slow molecular gas (though smaller than the optical nebula), emissions from both components being clearly separated in LSR velocity (Bujarrabal et al. 2001; Castro-Carrizo et al. 2005). The resulting LSR velocity ranges taken for CRL 618 are [− 24.5, − 19.5] km s-1 (line center), [− 49, − 44] km s-1 (blue wing) and [0, +5] km s-1 (red wing); for CRL 2688, we took [− 37.5, − 32.5], [− 62, − 57], and [− 13, − 8] km s-1; for Frosty Leo we took [− 13.5, − 8.5], [− 27, − 22], and [0, +5] km s-1; and for IRAS 17436+5003 we assumed the ranges [− 37.5, − 32.5], [− 54, − 49], and [− 21, − 16] km s-1.
The case of OH 231.8+4.2 is different because it shows a very elongated CO-rich component with a very well-defined velocity gradient (Alcolea et al. 2001), in which the fossil AGB envelope is not clearly identified. In this nebula, we selected the LSR ranges [+30.5, +35.5] (line core), [0, +5] (blue wing), [+61, +66] (red wing). The two high-velocity ranges correspond to regions clearly different from the central condensation (in clumps I2 and I4 in the nomenclature of Alcolea et al. 2001, which have been very probably accelerated along the nebular axis), but not very far from the center, to be sure that their emissions are intense and well within the telescope beamsize. The central velocity range we selected represents the central clump, which, in view of its structure, kinematics, and chemistry, does not seem to be affected by post-AGB shocks (Alcolea et al. 2001; Sánchez Contreras et al. 1997).
Characteristic intensities of the central core (or peak) and wings of CO lines in the sources in which they can easily be identified.
Characteristic intensities of the central core (or peak) and wings of H2O and OH lines in the cases in which they can be measured.
In NGC 6302 most of the molecular gas occupies an equatorial torus or disk, in moderate expansion (~15 km s-1) and perpendicular to the spectacular optical lobes, see maps in mm-wave CO by Peretto et al. (2007) and Dinh-V-Trung et al. (2008). These authors argue that the equatorial structure is probably the remnant of the (late) AGB mass loss, not strongly altered during the post-AGB phase. The two-horn dominant feature of our profiles appears as a result of the shape and relatively constant velocity of this component. There are also high-velocity clumps extending partially along the lobes; but they are very patchy and only those at relatively negative velocity (associated to the southeast part of the nebula) are intense enough to be analyzed here. Efficient photodissociation due to the UV radiation from the very hot central star is probably the reason for the distribution of molecule-rich gas found in NGC 6302. Therefore, in this source we just considered its blue wing, range [− 53, − 48] km s-1, and the line core, range [−25, −20] km s-1. We will assume that these velocity ranges represent the high-velocity molecular gas and the unaccelerated remnant of the AGB shell, respectively, but keeping in mind that the nature of both components in this source may be different than in other nebulae studied here and the existence of large amounts of nebular gas not detected in molecular emission.
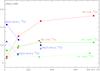 |
Fig. 15 Line-wing over line-core main-beam temperature ratio of the observed CO lines in the well studied sources CRL 618, CRL 2688, and OH 231.8+4.2 (J = 2–1 data are taken from previous works); see Table 2. Note the different behavior of the relative line-wing intensity between CRL 618, which shows particularly hot high-velocity outflows, and OH 231.8+4.2, in which the flows remain quite cold. CRL 2688 is an intermediate case. Squares (continuous line) represent 12CO data and triangles (dashed lines) show 13CO data. Each rotational transition is represented by the energy (in K) of its upper level. |
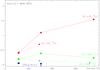 |
Fig. 16 Wing intensity ratio between the observed lines and the CO J = 2–1 transition (from previous works) in the well-studied sources CRL 618, CRL 2688, and OH 231.8+4.2; see Table 2. A comparison between these ratios and estimates from our simple, general models reveals values of the characteristic temperature compatible with estimates from detailed models (see text). Squares (continuous line) represent 12CO data and triangles (dashed lines) show 13CO data. Each rotational transition is represented by the energy (in K) of its upper level. |
We have computed wing/core CO intensity ratios and ratios between the observed lines and previous data of the CO J = 2–1 transitions (for previous observations, see Table 1, Bujarrabal et al. 2001, and references therein). For the wings we considered the average of both line wings, except for NGC 6302, in which only the blue wing was considered. See results in Table 2 and in Figs. 15–17. Obviously, there is a wide variety of excitation conditions in the high-velocity (presumably shocked) gas. In Fig. 15 we can see the wing/core intensity ratios for three well-known sources. These variations are not caused by significant differences in the central core intensities, for which the ratio with respect to the 2–1 transition varies very slightly from line to line and from source to source. The 12CO and 13CO line-wing ratios with respect to the J = 2–1 line are shown in Fig. 16, these ratios are also a measurement of the excitation state of the high-velocity gas. The fast increase of the wing/core ratio with the energy of the levels in CRL 618 shows that the temperature in its fast outflow must be high; the case of OH 231.8+4.2 is completely different, with a clear decrease of this ratio, showing a cool fast flow; CRL 2688 seems to be an intermediate case. For CRL 618 and OH231.8+4.2 we have an accurate idea of the temperature in the outflows from detailed model fitting of Herschel CO data, which indeed confirms this preliminary interpretation. Bujarrabal et al. (2010) showed that the temperature of the fast flow of CRL 618 is high, Tk ≳ 200 K. However, we know that the fast flow temperature in OH 231.8+4.2 is always cooler than about 30 K (Alcolea et al. 2011, in prep.).
 |
Fig. 17 Line-wing over line-core main-beam temperature ratio of the observed CO lines in sources that are less well studied in molecular emission: Frosty Leo, NGC 6302, and IRAS 17436+5003. We can identify hotter and cooler fast outflows in these cases as well. Squares (continuous line) represent 12CO data and triangles (dashed lines) show 13CO data. Each rotational transition is represented by the energy (in K) of its upper level. |
3.1. Comparison with simplified calculations of CO line emission
Our line profiles must be compared with theoretical predictions to derive the physical properties of the nebular gas from the empirical data. Here we just present a simplified description of the analysis to be performed, mostly based on single-component, standard calculations. More detailed modeling of the nebulae will be performed in dedicated papers, where their complex structures will be taken into account.
A comparison of the wing intensity ratio between our lines and J = 2–1 (see Fig. 16) with theoretical predictions can be used to perform a rough estimate of the physical conditions in the fast outflows in our sources, particularly the characteristic temperature. Results from plain rotational diagrams, which require optically thin and thermalized lines, are not accurate in our cases, because lines as high as J = 16–15 are only thermalized for densities ≳ 107 cm-3 and optically thin emission is not expected in 12CO lines (even 13CO lines seem often to present moderate values of the optical depth).
To perform a very simplified estimate of the excitation conditions in our nebulae, we carried out theoretical calculations of line ratios for a variety of values of the density and temperature (ntot and Tk), using the well known LVG (large velocity gradient) formalism. We assumed standard values for the rest of the parameters that enter the calculation: distance to the center R = 6 × 1016 cm, expansion velocity Vexp = 30 km s-1, and relative abundances X(12CO) = 2 10-4, X(13CO) = 10-5. Obviously, those conditions cannot be applied to all nebulae, because we assume a single value for the product R X/Vexp (ntotR X/Vexp represents the column density in the opacity under the LVG approximation). However, this approach is enough for our purpose of understanding the general properties of the line intensities from the theoretical point of view, particularly to give examples of the behavior of the line intensities and ratios depending on the temperature and density. Opacity effects are taken into account in the calculations under the usual assumptions of this formalism.
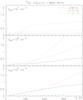 |
Fig. 18 Predictions for the wing intensity ratios between the observed 12CO lines and the 12CO J = 2–1 transition obtained from our non-LTE calculations for our three lines, J = 6–5, J = 10–9, and J = 16–15, dashed (black in electronic version), dotted (red), and dash-dot (green) lines. Intensity ratios are shown as functions of the kinetic temperature in the three panels for densities equal to 107, 106, and 105 cm-3. |
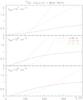 |
Fig. 19 Predictions for the wing intensity ratios between the observed 13CO lines and the 13CO J = 2–1 transition obtained from our non-LTE calculations for our three lines, J = 6–5, J = 10–9, and J = 16–15, dashed (black in electronic version), dotted (red), and dash-dot (green) lines. Intensity ratios are shown as functions of the kinetic temperature in the three panels for densities equal to 107, 106, and 105 cm-3. |
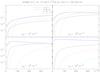 |
Fig. 20 12CO line intensities from our simplified model calculations, for several values of the temperature and density, see intensity normalization procedure in Sect. 3.1. |
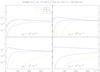 |
Fig. 21 13CO line intensities from our simplified model calculations, for several values of the temperature and density, see intensity normalization procedure in Sect. 3.1. |
The LVG approximation itself is fully justified in our case, because it is well known that PPNe often show strong velocity gradients, with radial expansion velocities increasing more or less proportionally to the distance to the star. For this reason, we do not expect strong radiative interactions between points separated by a long distance that show very different physical conditions. This approximation is appropriate for our purposes also because it does not require that details on the large-scale nebula structure are included in the code, provided that no radiative interaction between distant points takes place, which allows a general description of the line excitation for a number of different objects. Moreover, in our bipolar flows, which are often elongated and show steep velocity gradients, the emission at each LSR velocity must come from a relatively compact region. In this way, the code gives characteristic values of the brightness for each line, from which we can readily calculate line intensity ratios. Line intensities at a given velocity can be also estimated if we assume an angular size for the emitting region.
Results of our calculations for 13CO and 12CO are shown in Figs. 18–21. In our analysis, we will focus on the line intensity ratios because they depend only slightly on the linear and angular extent of the source and are more easily described by general models. Figures 18 and 19 show predicted line ratios for several densities and temperatures within the ranges needed to explain our data. In this case we assumed that the lines come from a region significantly smaller than the telescope spatial resolution (which is justified in our case), so that the comparison of the predicted line brightness ratios must be corrected for the respective telescope beam widths (half-maximum beam widths of the Herschel observations are given in Sect. 2; we adopted a value of 12′′ for the 30m-telescope observations of CO J = 2–1). In Figs. 20 and 21 we show predicted intensities; normalized units are used to allow a better comparison between the intensities of the different lines and sets of physical conditions. The chosen units correspond to Tmb(K) calculated assuming that the model nebula with density ntot = 106 cm-3 occupies a region 1′′ wide, and taking the different telescope beams into account (which are again much larger than the emitting region). To facilitate the comparison between predictions for other densities, we have taken varying values of the emitting angular size, inversely proportional to the density, such that the total emitting mass is similar for the different model condensations. We can check that the intensities are on the order of those observed: for instance a model clump ~2′′ wide, with Tk = 100 K and ntot = 106 cm-3 would yield a typical brightness Tmb(12CO J = 10–9) ~ 1 K, similar to some of our observed line-wing intensities.
The dependence of the predicted high-J line intensity on the temperature is clear, as expected, and can be seen both in line ratios (Figs. 18 and 19) and intensities (Figs. 20 and 21). The intensity of the relevant lines increases with temperature, but from a certain value of Tk it saturates and even decreases. Of course, the temperature limit of intensity saturation increases for higher values of J, which imply higher level energies. We can also see that the line intensity ratios tend to increase with the volume density, particularly for the highest J-values, but the dependence is less clear than with respect to the temperature. The general properties of the excitation of the high-J CO lines discussed here are therefore different from those of low-excitation transitions of high dipole moment species, such as HCO+, SiO, etc., which are often observed with ground-based telescopes. In these low-energy transitions with high radiative decay rates, the emission strongly depends on the density (the intensity per unit volume being roughly proportional to  ), because collisional de-excitation is much less probable than radiative transitions. However, its dependence on the temperature is in fact very moderate because the intensity saturation level is low.
From the comparison of our 13CO observational results with the model predictions in Fig. 19, we derive that the high-velocity CO emission in CRL 618 essentially comes from a region at Tk ~ 150 K and with a density ntot ~ 106 cm-3 (as we will see below, our 12CO data indicate that the temperature could be somewhat higher). In OH 231.8+4.2 our data are compatible with a temperature ~ 30 K and a lower density. Both results agree well with detailed model estimates (see the above discussion and Bujarrabal et al. 2010; Alcolea et al. 2011, in prep.).
Our 12CO observations of CRL 618 are compatible with the predictions in Fig. 18 for a density of about 106 cm-3 and a temperature of about 270 K, which is higher than the value deduced from 13CO data. This discrepancy may arise because, in sources showing significant variations of the density within the region emitting at a given velocity, the optically thick 12CO emission selects very dense regions less efficiently than the 13CO lines since those denser regions are probably cooler (see the discussion on the line ratios predicted by two-component models below). Bujarrabal et al. (2010) deduce from their detailed model fitting that the temperature of the high-velocity outflow must vary within this range, with typical values around 200 K, probably higher in the base of the outflow. Sánchez Contreras et al. (2004) deduce a density similar to that given here (which was also assumed by Bujarrabal et al. 2010). For OH 231.8+4.2 we derive from the 12CO lines Tk ~ 30 K and ntot ~ 105 cm-3, which are again comparable to the values obtained from detailed models (Alcolea et al. 2011, in prep.).
The 12CO line ratios of CRL 2688 are compatible with a temperature of about 100 K and ntot ~ 106 cm-3. These conditions are also roughly compatible with our 13CO data. It is probable that in this case the complex nebula also harbors gas with variable physical conditions.
Evidently, the values we derive are quite self-consistent and consistent with other more accurate results from detailed modeling even if the procedure depicted here is simple.
We can also perform the same kind of analysis for the less well studied sources NGC 6302, Frosty Leo, and IRAS 17436+5003. Obviously, fast winds in NGC 6302 and Frosty Leo show a very low excitation. In Frosty Leo, Castro-Carrizo et al. (2005) predicted a low temperature from low-J observations, but our data indicate a slightly warmer component at high velocity, with a temperature ~ 60 K (assuming ntot ~ 104 cm-3, following Castro-Carrizo et al.). In NGC 6302, the fast gas must present a low temperature ~ 40 K, and the density must be of about a few 105 cm-3; both results are compatible with estimates by Dinh-V-Trung et al. (2008) from interferometric J = 2–1 mapping. The fast flow in the less well studied IRAS 17436+5003 must be more excited, with Tk ~ 60 K and ntot ~ 106 cm-3. In this object, the properties of the molecular component and the evolutionary stage seem to be similar to those of CRL 2688 (see e.g. Bujarrabal et al. 2001, note that the lines in IRAS 17436+5003 are weaker, mainly because it is more distant).
As mentioned, these estimates are crude in any case, particularly in view of the probably complex structure of the emitting regions. To investigate those effects in general terms, we must consider our predictions of the line intensities in Figs. 20 and 21. Let us take a two-component case. In general, we can see that when there is a massive component with ntot ≲ 105 cm-3 and Tk ≲ 200 K the J = 2–1 emission is always dominant in it and, even if a denser/warmer component exists, the total intensity ratios J = 10–9/J = 2–1 and J = 16–15/J = 2–1 can hardly be higher than ~ 1/2. If there is a significant component with Tk ≳ 200 K and ntot ≳ 105 cm-3, its J = 10–9 and J = 16–15 emission would always be dominant over that of a diffuse/cool component. This would explain the general trend of relatively low J = 10–9/J = 2–1 and J = 16–15/J = 2–1 ratios found in our data.
We can also suppose that relatively diffuse, accelerated components are systematically warmer if the cooling after shock passage is radiative (and, therefore, denser gas cools faster). This would yield regions with ntot ~ 105 cm-3 and Tk ≳ 200 K, whose emission is intense in 12CO lines, but relatively weak in 13CO lines (with respect to dense regions). After taking the emission of more cool/dense components into account, one would obtain relatively high 12CO J = 10–9/J = 2–1 and J = 16–15/J = 2–1 line ratios, higher than the corresponding 13CO ratios. Therefore, the presence of relatively weak line-wing emission in 13CO high-J lines, as are often found in our observational data, could be caused by a significant relatively diffuse component, detectable in 12CO emission but practically not in 13CO lines.
The presence of self-absorption by outer, less excited layers (not included in our simple discussion) could also help to explain this trend. In this case, self-absorption would mostly affect low-J12CO lines, because they present the highest opacities in low-excitation regions. This would yield relatively low 12CO J = 2–1 intensities and then relatively high 12CO J = 10–9/J = 2–1 and J = 16–15/J = 2–1 ratios. The existence of self-absorption under these conditions is confirmed by the observed absorption features in mm-wave CO profiles.
As mentioned, we studied the case of CRL 618 by means of detailed modeling of its line emission based in our good knowledge of the structure of the nebulae from low-J CO data (Bujarrabal et al. 2010), and we are analyzing in depth in other papers the high-J lines of OH 231.8+4.2, CRL 2688, and NGC 7027, which are also well known.
We will also study in detail the CO emission from the Red Rectangle in a different paper, so here we just present a brief, simplified discussion. The Red Rectangle is the only PPNe or young PNe in which an equatorial disk in rotation around the central star has been properly detected (from mm-wave mapping, Bujarrabal et al. 2005). This disk is, as far as we know, the only molecule-rich component of the nebula. The structure of the line profiles in this source is accordingly peculiar, because the outer part of the profiles come from the inner disk regions in fast rotation (rotation is exactly Keplerian in them), which are relatively hot and very small. Meanwhile, the central part of the profiles mainly comes from the outer disk. Let us take representative LSR velocities around the systemic one V ± = ± 1.65 km s-1 (the LSR velocity of the center of gravity of this source is ~0 km s-1). These velocities correspond to the rotation velocity at the point at which the dynamics change from pure Keplerian rotation to rotation plus expansion (Rkep in the notation used by Bujarrabal et al. 2005), and there is a clear maximum of the CO lines in them. We can see in our spectra that 12CO J = 6–5 and J = 10–9 show very similar values of the main-beam brightness at V ± . This is true even for J = 16–15, in spite of the poor-quality profile at this frequency. 13CO J = 6–5 and J = 10–9 also show practically the same intensities at V ± . As we discussed above (Sect. 1), mm-wave CO data are adequate to measure densities and total masses, but often yield underestimates of the temperature because those lines tend to select the coolest components. So, if we assume the density estimated in these regions by Bujarrabal et al. (2005), 105–106 cm-3, we conclude from the comparison with our predicted intensities that the temperature in this representative region is ≳ 150 K, at least twice as high as the temperature deduced from mm-wave lines. This result has important consequences for the structure and dynamics of the equatorial disk in the Red Rectangle. In the framework of the standard theory of the passive rotating disks, the gas temperature directly controls the disk extent from the equator (but comparison with observations is difficult because the angular resolution of the existing maps is not high enough to properly measure the disk width). These high temperatures are also the most probable explanation of the detection of evaporation of gas in this source (i.e. of expansion from a certain radius Rkep); indeed, we can readily show that the thermal velocity dispersion becomes comparable to the rotation velocity at Rkep for Tk ~ 200 K.
3.2. Comparison with previous estimates
As mentioned in Sect. 1, warm molecular gas in CRL 618 and CRL 2688 was studied in several previous papers.
Justtanont et al. (2000) deduce the presence of warm gas from ISO data of 12CO emission for transitions between J = 14–13 and J = 37–36. These authors clearly detect the presence of gas at temperatures higher than the typical values found here, of ~380 K in CRL 2688 and ~700 K in CRL 618, using simple rotational diagrams. This result is not unexpected because higher-J transitions tend to come from hotter regions. However, the lack of information on the profile shapes (ISO spectra did not resolve the line profiles) prevents any attempt to discern from which nebular components these emissions arise. In the case of CRL 618, this hot component could be very close to the inner HII region, but any conclusion on its properties remains very uncertain. We finally point out that it is well known that simple rotational diagrams can overestimate the characteristic rotational temperature, because lower transitions typically show higher opacities.
Martin-Pintado & Bachiller (1992) observed cm-wave inversion transitions of NH3 up to J,K = 7,7, requiring several hundred K to be excited. They measured a typical temperature of about 150 K in CRL 2688, compatible with our results, but without a clear distinction between the nebular components. In CRL 618, they detected lines mostly in absorption against the central free-free continuum source. They were able to identify two independent components. One of them, in slow expansion and showing a temperature of about 270 K, is very probably the slow-expanding inner shell responsible for the narrow line core found from Herschel high-J CO data, see Bujarrabal et al. (2010). The other component corresponds to the fast outflow also discussed by Bujarrabal et al. (2010), and its temperature from NH3 data is about 150 K. The temperature derived by Martin-Pintado & Bachiller (1992) for the slow component is very similar to that of the very inner central region in slow expansion studied by means of our CO data; but the NH3 temperature of the fast outflow is slightly lower than the one found from our results. We note that because Martin-Pintado & Bachiller (1992) detected lines in absorption it is very difficult to identify which part of the fast outflow is actually absorbing the continuum, perhaps the warmest regions of the outflow are not placed in front of the very small continuum source and were not actually detected in ammonia lines.
Finally, we mention the observations by Pardo et al. (2004) of CRL 618 in a high number of rotational transitions of HC3N in the ground and excited vibrational states. These authors deduce the presence of a central, molecule-rich region with Tk ~ 250–300 K. The excitation conditions and extent of this component are very similar to those deduced by Bujarrabal et al. (2010) for the inner nebula from the Herschel CO profiles.
4. Conclusions
We presented observations of FIR/sub-mm molecular lines in ten protoplanetary or young planetary nebulae (PPNe, PNe), see Table 1, obtained with the heterodyne spectrometer HIFI on board the Herschel Space Telescope. We focused on observing CO and H2O rotational lines. We have detected 12CO and 13CO J = 6–5, J = 10–9, and J = 16–15 lines, and we also reported observations of H2O 11,0–10,1, 11,1–00,0, 32,1–31,2, 31,2–22,1, 42,2–41,3, 63,5–62,4, and 73,4–72,5 lines. 12CO was detected in all the sources. At least one H2O line was detected from all but three objects, IRAS 22227+5435, the Red Rectangle, and IRAS 17436+5003. In the most intense emitters, we also found other lines within the (wide) receiver bands; the NH3J,K = 1, 0–0,0 and OH 3/2–1/2 rotational transitions are particularly interesting; we also detected lines of C18O, H218O, vibrationally excited H2O, SiO, HCN, and CN.
The obtained full-band spectra are presented in the appendix (in electronic form only). Selected lines are shown in Figs. 1 to 14.
Particularly rich are the spectra of CRL 618, CRL 2688, NGC 7027, and OH 231.8+4.2, which have been or will soon be discussed in dedicated papers. Several spectra of CRL 618 were presented in a preliminary paper (Bujarrabal et al. 2010); here we show those spectra again, after careful reanalysis and calibration, as well as new recent observations.
We have performed a simplified interpretation of the CO line intensity in terms of general excitation state of the two main components of the profiles: the line core and the line wings. It is known (Sects. 1, 3) that the line core comes from a slowly expanding component that can be identified with the remnant of the AGB shell. On the other hand, the line wings come from fast bipolar outflows, which are thought to be accelerated and heated by shocks during the post-AGB phase. We argued (Sects. 1 and 3.1) that those FIR/submm lines are the best tool to study intermediate-excitation regions in the temperature ranges 100 K ≲ Tk ≲ 1000 K, which are not adequately probed by mm-wave or optical/NIR observations.
In Table 2 we gave typical CO intensities of these features, as well as intensity ratios between them or between the observed lines and the J = 2–1 line (from IRAM 30-m telescope observations), both for 12CO and 13CO. Significant ratios are represented in Figs. 15 to 17, see full description of the parameters in Sect. 3. As we can see, in CRL 618 the line wings are particularly intense and relatively more intense for the highest-J transitions, indicating particularly high temperatures in the fast gas in this source, as already found by Bujarrabal et al. (2010). In others, notably in OH 231.8+4.2 and in agreement with detailed models (Alcolea et al. 2011, in prep.), the fast gas seems significantly cooler.
We also presented theoretical predictions of FIR/submm line intensities for wide ranges of the kinetic temperature and density, performed for a quite general case, see details in Sect. 3.1 and results in Figs. 18 to 21. From comparison between these theoretical expectations and our data, we estimated characteristic physical conditions of the fast gas in six nebulae, focusing on the kinetic temperatures.
We must remember that this comparison is not straightforward, in particular because of the very probable complex structure and dynamics of the emitting regions. Indeed, in view of some general trends in the comparison of our observational and theoretical results, we argued (Sect. 3.1) that several components may be systematically present and that the densest parts of the fast gas may be systematically cooler (see below).
Characteristic temperatures of the fast outflows derived in this work compared with other nebular parameters.
In the best-studied objects, information obtained from previous investigations helped us to understand the contributions of the various nebular components, and our discussion is more reliable. For CRL 618 and OH 231.8+4.2, we were able to compare our estimates with results from detailed modeling of the FIR/sub-mm line emission and we found that both results are quite consistent. Therefore, we believe that our estimates of the density and temperature, although simple, are good approximations to the average physical conditions in the fast outflows of the studied nebulae. We derived a relatively high temperature for the high-velocity gas in CRL 618, with typical values Tk ~ 200 K, probably higher in the base of its (relatively compact) bipolar outflow. However, the fast gas in OH 231.8+4.2 is quite cold, at around 30 K, and shows no signs of significantly higher temperatures in any part of its very elongated and extended outflow. In CRL 2688, a nebula that is also relatively well studied, the characteristic temperature of the high-velocity gas is intermediate, Tk ~ 100 K. Table 4 shows a summary of the derived characteristic temperatures, as well as the time elapsed since the acceleration of bipolar flows (or flow lifetime) and an estimate of the characteristic density in that component. (In the estimates of the lifetimes and densities, we take results from previous studies into account, see references in the table.) As we can see, there is a clear relation between the temperature of the fast gas and the time elapsed since its acceleration, with clear extreme values for OH 231.8+4.2 and CRL 618, and intermediate values for CRL 2688 and other nebulae. We interpret this result as showing that the gas was accelerated and heated by the passage of a shock and it is being cooled down since then. The density seems also to play a role, as expected, because radiative cooling increases with the gas density. For instance, the relatively diffuse gas in Frosty Leo and NGC 6302 is somewhat warmer than in OH 231.8+4.2, for comparable times.
We have also discussed briefly other cases of interest: NGC 7027 and the Red Rectangle (Sect. 3). NGC 7027 shows complex profiles corresponding to its well known very complex structure (Nakashima et al. 2010). The molecule-rich shell is elongated and very inhomogeneous and shows a composite velocity field. Detailed modeling is absolutely necessary to understand the molecular emission from this nebula. The molecular gas in the Red Rectangle forms an equatorial disk in rotation (Bujarrabal et al. 2005, it is the only PPNe or PNe in which gas in rotation has been clearly detected). From a first-approach comparison between our profiles in the Red Rectangle and theoretical predictions, we derive a characteristic temperature Tk ≳ 150 K (for the gas responsible for the profile maxima), which is at least twice the previous estimates from mm-wave data. Owing to the important role of thermal diffusion in this case (Sect. 3.1), the high temperature in the disk must have strong effects on its shape and kinematics and can, in particular, explain the presence of gas evaporation in the outer parts of the disk.
Online material
Appendix A: Observational results
In this appendix we show the full DSB spectra obtained in our program. The USB and LSB frequencies are indicated in the figures. We also show the frequencies of some remarkable molecular lines, which does not mean that these lines have been detected in the corresponding sources. Depending on the line widths and S/N ratio, the spectral resolutions were averaged to channel widths ranging between 0.5 and 1.5 km s-1 (except for the narrow lines of the Red Rectangle, for which we adopted a resolution of 0.2 km s-1). Selected lines are shown in more detail (and in LSR velocity scale) in Figs. 1 to 14.
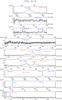 |
Fig. A.1 Full-band spectra obtained in CRL 618. We show Tmb vs. upper- and lower-side band frequencies. Frequencies of some relevant lines are indicated (which does not mean that they are detected in this source). All frequencies are corrected for Doppler shifts caused by the relative velocity of the source and therefore correspond to rest frequencies. Continuum was subtracted in all the spectra presented in this paper. |
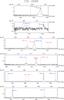 |
Fig. A.2 Full-band spectra obtained in CRL 2688; see caption of Fig. A.1. |
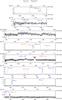 |
Fig. A.3 Full-band spectra obtained in NGC 7027; see caption of Fig. A.1. |
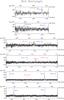 |
Fig. A.4 Full-band spectra obtained in the Red Rectangle; see caption of Fig. A.1. |
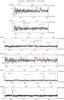 |
Fig. A.5 Full-band spectra obtained in IRAS 22272+5435; see caption of Fig. A.1. |
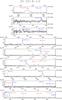 |
Fig. A.6 Full-band spectra obtained in OH 231.8+4.2; see caption of Fig. A.1. |
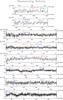 |
Fig. A.7 Full-band spectra obtained in the Boomerang Nebula; see caption of Fig. A.1. |
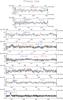 |
Fig. A.8 Full-band spectra obtained in Frosty Leo; see caption of Fig. A.1. |
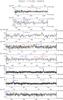 |
Fig. A.9 Full-band spectra obtained in IRAS 17436+5003; see caption of Fig. A.1. |
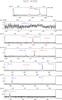 |
Fig. A.10 Full-band spectra obtained in NGC 6302; see caption of Fig. A.1. |
Acknowledgments
HIFI has been designed and built by a consortium of institutes and university departments from across Europe, Canada, and the United States under the leadership of SRON Netherlands Institute for Space Research, Groningen, The Netherlands, and with major contributions from Germany, France, and the US. Consortium members are: Canada: CSA, U. Waterloo; France: CESR, LAB, LERMA, IRAM; Germany: KOSMA, MPIfR, MPS; Ireland, NUI Maynooth; Italy: ASI, IFSI-INAF, Osservatorio Astrofisico di Arcetri-INAF; The Netherlands: SRON, TUD; Poland: CAMK, CBK; Spain: Observatorio Astronómico Nacional (IGN), Centro de Astrobiología (CSIC-INTA). Sweden: Chalmers University of Technology – MC2, RSS & GARD; Onsala Space Observatory; Swedish National Space Board, Stockholm University – Stockholm Observatory; Switzerland: ETH Zurich, FHNW; USA: Caltech, JPL, NHSC. HCSS/HSpot/HIPE is a joint development (are joint developments) by the Herschel Science Ground Segment Consortium, consisting of
ESA, the NASA Herschel Science Center, and the HIFI, PACS, and SPIRE consortia. This work has been partially supported by the Spanish MICINN, program CONSOLIDER INGENIO 2010, grant “ASTROMOL” (CSD2009-00038). R.Sz. and M.Sch. acknowledge support from grant N203 581040 of the Polish National Science Center. K.J. acknowledges the funding from SNSB. J.C. acknowledges funding from MICINN, grant AYA2009-07304. This research was performed, in part, through a JPL contract funded by the National Aeronautics and Space Administration.
References
- Alcolea, J., Bujarrabal, V., Sánchez Contreras, C., Neri, R., & Zweigle, J. 2001, A&A, 373, 932 [NASA ADS] [CrossRef] [EDP Sciences] [Google Scholar]
- Alcolea, J., Neri, R., & Bujarrabal, V. 2007, A&A, 468, L41 [NASA ADS] [CrossRef] [EDP Sciences] [Google Scholar]
- Balick, B., & Frank, A. 2002, ARA&A, 40, 439 [NASA ADS] [CrossRef] [Google Scholar]
- Bujarrabal, V., & Bachiller, R. 1991, A&A, 242, 247 [NASA ADS] [Google Scholar]
- Bujarrabal, V., Alcolea, J., & Neri, R. 1998, ApJ, 504, 915 [NASA ADS] [CrossRef] [Google Scholar]
- Bujarrabal, V., Castro-Carrizo, A., Alcolea, J., & Sánchez Contreras, C. 2001, A&A, 377, 868 [NASA ADS] [CrossRef] [EDP Sciences] [Google Scholar]
- Bujarrabal, V., Castro-Carrizo, A., Alcolea, J., & Neri, R. 2005, A&A, 441, 1031 [NASA ADS] [CrossRef] [EDP Sciences] [Google Scholar]
- Bujarrabal, V., Alcolea, J., Soria-Ruiz, R., et al. 2010, A&A, 521, L3 [NASA ADS] [CrossRef] [EDP Sciences] [Google Scholar]
- Castro-Carrizo, A., Bujarrabal, V., Sánchez Contreras, C., Alcolea, J., & Neri, R. 2002, A&A, 386, 633 [NASA ADS] [CrossRef] [EDP Sciences] [Google Scholar]
- Castro-Carrizo, A., Neri, R., & Winters, J. M. 2004, Asymmetrical Planetary Nebulae III: Winds, Structure and the Thunderbird, 313, 314 [Google Scholar]
- Castro-Carrizo, A., Bujarrabal, V., Sánchez Contreras, C., Sahai, R., & Alcolea, J. 2005, A&A, 431, 979 [NASA ADS] [CrossRef] [EDP Sciences] [Google Scholar]
- Castro-Carrizo, A., Quintana-Lacaci, G., Neri, R., et al. 2010, A&A, 523, A59 [NASA ADS] [CrossRef] [EDP Sciences] [Google Scholar]
- Cox, P., Lucas, R., Huggins, P. J., et al. 2000, A&A, 353, L25 [NASA ADS] [Google Scholar]
- de Graauw, T., Helmich, F. P., Phillips, T. G., et al. 2010, A&A, 518, L6 [Google Scholar]
- Dinh-V-Trung, Bujarrabal, V., Castro-Carrizo, A., Lim, J., & Kwok, S. 2008, ApJ, 673, 934 [NASA ADS] [CrossRef] [Google Scholar]
- Fong, D., Meixner, M., Sutton, E. C., Zalucha, A., & Welch, W. J. 2006, ApJ, 652, 1626 [NASA ADS] [CrossRef] [Google Scholar]
- Hoogzaad, S. N., Molster, F. J., Dominik, C., et al. 2002, A&A, 389, 547 [NASA ADS] [CrossRef] [EDP Sciences] [Google Scholar]
- Justtanont, K., Barlow, M. J., Tielens, A. G. G. M., et al. 2000, A&A, 360, 1117 [NASA ADS] [Google Scholar]
- Martin-Pintado, J., & Bachiller, R. 1992, ApJ, 391, L93 [Google Scholar]
- Nakashima, J.-I., Fong, D., Hasegawa, T., et al. 2007, AJ, 134, 2035 [NASA ADS] [CrossRef] [Google Scholar]
- Nakashima, J.-I., Kwok, S., Zhang, Y., & Koning, N. 2010, AJ, 140, 490 [NASA ADS] [CrossRef] [Google Scholar]
- Pardo, J. R., Cernicharo, J., Goicoechea, J. R., & Phillips, T. G. 2004, ApJ, 615, 495 [NASA ADS] [CrossRef] [Google Scholar]
- Peretto, N., Fuller, G., Zijlstra, A., & Patel, N. 2007, A&A, 473, 207 [NASA ADS] [CrossRef] [EDP Sciences] [Google Scholar]
- Pilbratt, G. L., Riedinger, J. R., Passvogel, T., et al. 2010, A&A, 518, L1 [CrossRef] [EDP Sciences] [Google Scholar]
- Sahai, R., & Nyman, L.-Å. 1997, ApJ, 487, L155 [NASA ADS] [CrossRef] [Google Scholar]
- Sanchez Contreras, C., Bujarrabal, V., & Alcolea, J. 1997, A&A, 327, 689 [NASA ADS] [Google Scholar]
- Sánchez Contreras, C., Bujarrabal, V., Castro-Carrizo, A., Alcolea, J., & Sargent, A. 2004, ApJ, 617, 1142 [NASA ADS] [CrossRef] [Google Scholar]
All Tables
Characteristic intensities of the central core (or peak) and wings of CO lines in the sources in which they can easily be identified.
Characteristic intensities of the central core (or peak) and wings of H2O and OH lines in the cases in which they can be measured.
Characteristic temperatures of the fast outflows derived in this work compared with other nebular parameters.
All Figures
|
Fig. 1 HIFI observations including detected 12CO, 13CO, and C18O lines in CRL 618 (Tmb vs. LSR velocities). The shadowed regions indicate the velocity ranges in which we can expect emission from the considered line, often mixed with emission from other lines. Note for instance the emission of HCN superposed to 12CO 10–9 and the overlapping lines 12CO 16–15 and OH 3/2–1/2 (for more details, see the observed full-band spectra in the appendix). |
| In the text | |
|
Fig. 2 HIFI observations of CRL 618 including detected lines of H2O, OH, and NH3 (Tmb vs. LSR velocities). The shadowed regions indicate the velocity ranges in which we can expect emission from the considered line, often mixed with emission from other lines (see identifications in Fig. A.1). |
| In the text | |
|
Fig. 3 HIFI observations including detected 12CO, 13CO, and C18O lines in CRL 2688 (Tmb vs. LSR velocities). |
| In the text | |
|
Fig. 4 HIFI observations including detected 12CO, 13CO, and C18O lines in NGC 7027 (Tmb vs. LSR velocities). |
| In the text | |
|
Fig. 5 HIFI observations of NGC 7027 including detected lines of H2O and OH (Tmb vs. LSR velocities). |
| In the text | |
|
Fig. 6 HIFI observations including detected 12CO and 13CO lines in the Red Rectangle (Tmb vs. LSR velocities). |
| In the text | |
|
Fig. 7 HIFI observations including detected 12CO and 13CO lines in IRAS 22272+5435 (Tmb vs. LSR velocities). |
| In the text | |
|
Fig. 8 HIFI observations including detected 12CO, 13CO, and C18O lines in OH 231.8+4.2 (Tmb vs. LSR velocities). Note that other lines appear in some spectra, see Fig. A.6. |
| In the text | |
|
Fig. 9 HIFI observations of OH 231.8+4.2 including detected lines of H2O (Tmb vs. LSR velocities). Note that other lines appear in some spectra, see Fig. A.6. |
| In the text | |
|
Fig. 10 HIFI observations including detected 12CO and H2O lines in the Boomerang Nebula (Tmb vs. LSR velocities). |
| In the text | |
|
Fig. 11 HIFI observations including detected 12CO, 13CO, and H2O lines in Frosty Leo (Tmb vs. LSR velocities). |
| In the text | |
|
Fig. 12 HIFI observations including detected 12CO and 13CO lines, Tmb vs. LSR velocities, in IRAS 17436+5003 (HD 161796). |
| In the text | |
|
Fig. 13 HIFI observations including detected 12CO and 13CO lines in NGC 6302 (Tmb vs. LSR velocities). |
| In the text | |
|
Fig. 14 HIFI observations including detected lines of H2O, OH, and NH3 in NGC 6302 (Tmb vs. LSR velocities). |
| In the text | |
|
Fig. 15 Line-wing over line-core main-beam temperature ratio of the observed CO lines in the well studied sources CRL 618, CRL 2688, and OH 231.8+4.2 (J = 2–1 data are taken from previous works); see Table 2. Note the different behavior of the relative line-wing intensity between CRL 618, which shows particularly hot high-velocity outflows, and OH 231.8+4.2, in which the flows remain quite cold. CRL 2688 is an intermediate case. Squares (continuous line) represent 12CO data and triangles (dashed lines) show 13CO data. Each rotational transition is represented by the energy (in K) of its upper level. |
| In the text | |
|
Fig. 16 Wing intensity ratio between the observed lines and the CO J = 2–1 transition (from previous works) in the well-studied sources CRL 618, CRL 2688, and OH 231.8+4.2; see Table 2. A comparison between these ratios and estimates from our simple, general models reveals values of the characteristic temperature compatible with estimates from detailed models (see text). Squares (continuous line) represent 12CO data and triangles (dashed lines) show 13CO data. Each rotational transition is represented by the energy (in K) of its upper level. |
| In the text | |
|
Fig. 17 Line-wing over line-core main-beam temperature ratio of the observed CO lines in sources that are less well studied in molecular emission: Frosty Leo, NGC 6302, and IRAS 17436+5003. We can identify hotter and cooler fast outflows in these cases as well. Squares (continuous line) represent 12CO data and triangles (dashed lines) show 13CO data. Each rotational transition is represented by the energy (in K) of its upper level. |
| In the text | |
|
Fig. 18 Predictions for the wing intensity ratios between the observed 12CO lines and the 12CO J = 2–1 transition obtained from our non-LTE calculations for our three lines, J = 6–5, J = 10–9, and J = 16–15, dashed (black in electronic version), dotted (red), and dash-dot (green) lines. Intensity ratios are shown as functions of the kinetic temperature in the three panels for densities equal to 107, 106, and 105 cm-3. |
| In the text | |
|
Fig. 19 Predictions for the wing intensity ratios between the observed 13CO lines and the 13CO J = 2–1 transition obtained from our non-LTE calculations for our three lines, J = 6–5, J = 10–9, and J = 16–15, dashed (black in electronic version), dotted (red), and dash-dot (green) lines. Intensity ratios are shown as functions of the kinetic temperature in the three panels for densities equal to 107, 106, and 105 cm-3. |
| In the text | |
|
Fig. 20 12CO line intensities from our simplified model calculations, for several values of the temperature and density, see intensity normalization procedure in Sect. 3.1. |
| In the text | |
|
Fig. 21 13CO line intensities from our simplified model calculations, for several values of the temperature and density, see intensity normalization procedure in Sect. 3.1. |
| In the text | |
|
Fig. A.1 Full-band spectra obtained in CRL 618. We show Tmb vs. upper- and lower-side band frequencies. Frequencies of some relevant lines are indicated (which does not mean that they are detected in this source). All frequencies are corrected for Doppler shifts caused by the relative velocity of the source and therefore correspond to rest frequencies. Continuum was subtracted in all the spectra presented in this paper. |
| In the text | |
|
Fig. A.2 Full-band spectra obtained in CRL 2688; see caption of Fig. A.1. |
| In the text | |
|
Fig. A.3 Full-band spectra obtained in NGC 7027; see caption of Fig. A.1. |
| In the text | |
|
Fig. A.4 Full-band spectra obtained in the Red Rectangle; see caption of Fig. A.1. |
| In the text | |
|
Fig. A.5 Full-band spectra obtained in IRAS 22272+5435; see caption of Fig. A.1. |
| In the text | |
|
Fig. A.6 Full-band spectra obtained in OH 231.8+4.2; see caption of Fig. A.1. |
| In the text | |
|
Fig. A.7 Full-band spectra obtained in the Boomerang Nebula; see caption of Fig. A.1. |
| In the text | |
|
Fig. A.8 Full-band spectra obtained in Frosty Leo; see caption of Fig. A.1. |
| In the text | |
|
Fig. A.9 Full-band spectra obtained in IRAS 17436+5003; see caption of Fig. A.1. |
| In the text | |
|
Fig. A.10 Full-band spectra obtained in NGC 6302; see caption of Fig. A.1. |
| In the text | |
Current usage metrics show cumulative count of Article Views (full-text article views including HTML views, PDF and ePub downloads, according to the available data) and Abstracts Views on Vision4Press platform.
Data correspond to usage on the plateform after 2015. The current usage metrics is available 48-96 hours after online publication and is updated daily on week days.
Initial download of the metrics may take a while.