| Issue |
A&A
Volume 537, January 2012
|
|
|---|---|---|
| Article Number | A8 | |
| Number of page(s) | 25 | |
| Section | Interstellar and circumstellar matter | |
| DOI | https://doi.org/10.1051/0004-6361/201117646 | |
| Published online | 20 December 2011 | |
Online material
Appendix A: Observational results
In this appendix we show the full DSB spectra obtained in our program. The USB and LSB frequencies are indicated in the figures. We also show the frequencies of some remarkable molecular lines, which does not mean that these lines have been detected in the corresponding sources. Depending on the line widths and S/N ratio, the spectral resolutions were averaged to channel widths ranging between 0.5 and 1.5 km s-1 (except for the narrow lines of the Red Rectangle, for which we adopted a resolution of 0.2 km s-1). Selected lines are shown in more detail (and in LSR velocity scale) in Figs. 1 to 14.
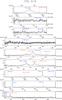 |
Fig. A.1
Full-band spectra obtained in CRL 618. We show Tmb vs. upper- and lower-side band frequencies. Frequencies of some relevant lines are indicated (which does not mean that they are detected in this source). All frequencies are corrected for Doppler shifts caused by the relative velocity of the source and therefore correspond to rest frequencies. Continuum was subtracted in all the spectra presented in this paper. |
| Open with DEXTER | |
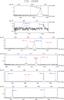 |
Fig. A.2
Full-band spectra obtained in CRL 2688; see caption of Fig. A.1. |
| Open with DEXTER | |
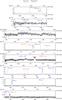 |
Fig. A.3
Full-band spectra obtained in NGC 7027; see caption of Fig. A.1. |
| Open with DEXTER | |
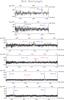 |
Fig. A.4
Full-band spectra obtained in the Red Rectangle; see caption of Fig. A.1. |
| Open with DEXTER | |
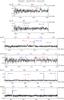 |
Fig. A.5
Full-band spectra obtained in IRAS 22272+5435; see caption of Fig. A.1. |
| Open with DEXTER | |
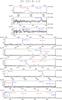 |
Fig. A.6
Full-band spectra obtained in OH 231.8+4.2; see caption of Fig. A.1. |
| Open with DEXTER | |
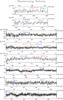 |
Fig. A.7
Full-band spectra obtained in the Boomerang Nebula; see caption of Fig. A.1. |
| Open with DEXTER | |
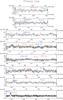 |
Fig. A.8
Full-band spectra obtained in Frosty Leo; see caption of Fig. A.1. |
| Open with DEXTER | |
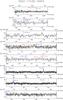 |
Fig. A.9
Full-band spectra obtained in IRAS 17436+5003; see caption of Fig. A.1. |
| Open with DEXTER | |
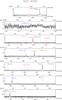 |
Fig. A.10
Full-band spectra obtained in NGC 6302; see caption of Fig. A.1. |
| Open with DEXTER | |
© ESO, 2012
Current usage metrics show cumulative count of Article Views (full-text article views including HTML views, PDF and ePub downloads, according to the available data) and Abstracts Views on Vision4Press platform.
Data correspond to usage on the plateform after 2015. The current usage metrics is available 48-96 hours after online publication and is updated daily on week days.
Initial download of the metrics may take a while.