Fig. 19
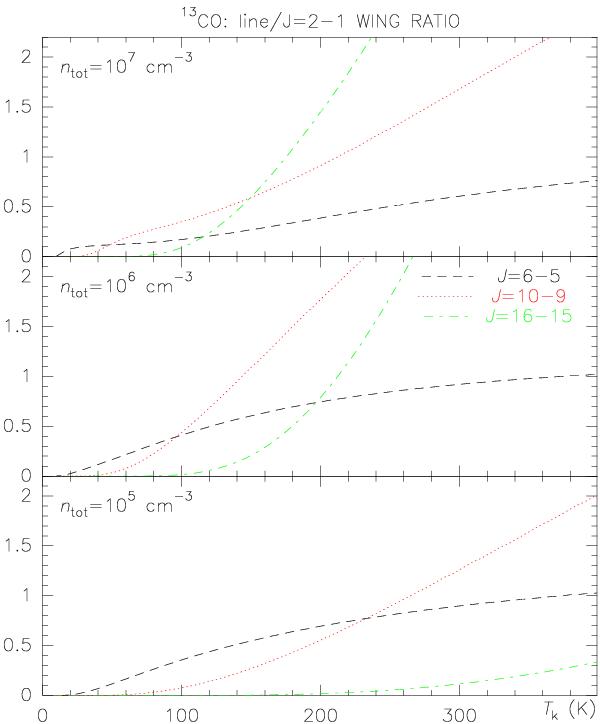
Predictions for the wing intensity ratios between the observed 13CO lines and the 13CO J = 2–1 transition obtained from our non-LTE calculations for our three lines, J = 6–5, J = 10–9, and J = 16–15, dashed (black in electronic version), dotted (red), and dash-dot (green) lines. Intensity ratios are shown as functions of the kinetic temperature in the three panels for densities equal to 107, 106, and 105 cm-3.
Current usage metrics show cumulative count of Article Views (full-text article views including HTML views, PDF and ePub downloads, according to the available data) and Abstracts Views on Vision4Press platform.
Data correspond to usage on the plateform after 2015. The current usage metrics is available 48-96 hours after online publication and is updated daily on week days.
Initial download of the metrics may take a while.