Free Access
Fig. 2
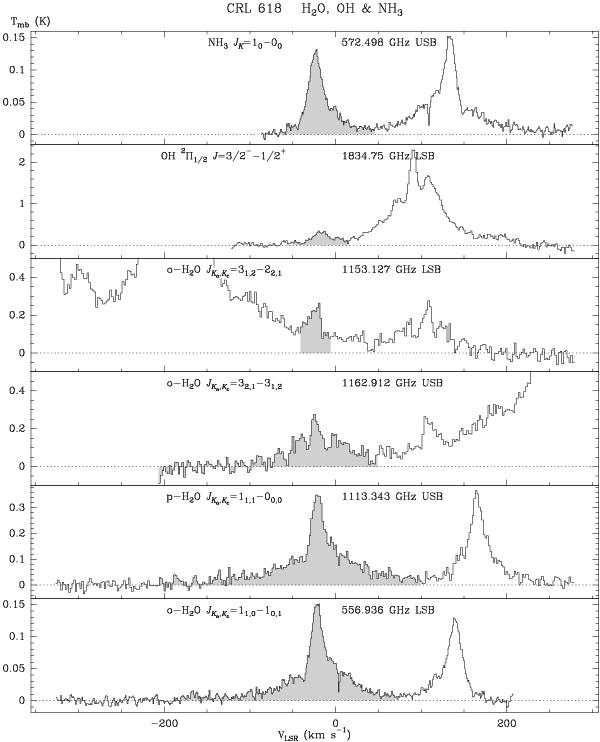
HIFI observations of CRL 618 including detected lines of H2O, OH, and NH3 (Tmb vs. LSR velocities). The shadowed regions indicate the velocity ranges in which we can expect emission from the considered line, often mixed with emission from other lines (see identifications in Fig. A.1).
Current usage metrics show cumulative count of Article Views (full-text article views including HTML views, PDF and ePub downloads, according to the available data) and Abstracts Views on Vision4Press platform.
Data correspond to usage on the plateform after 2015. The current usage metrics is available 48-96 hours after online publication and is updated daily on week days.
Initial download of the metrics may take a while.