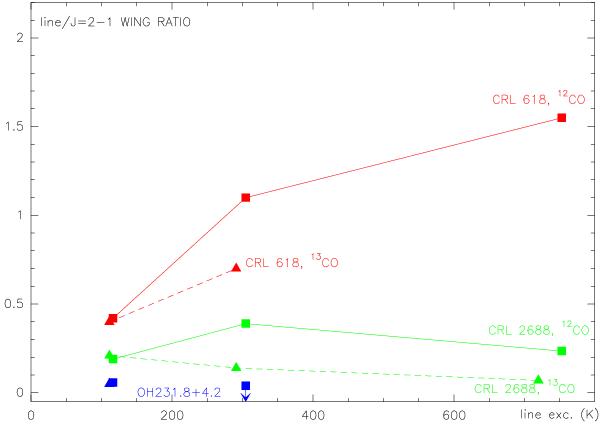
Fig. 16

Wing intensity ratio between the observed lines and the CO J = 2–1 transition (from previous works) in the well-studied sources CRL 618, CRL 2688, and OH 231.8+4.2; see Table 2. A comparison between these ratios and estimates from our simple, general models reveals values of the characteristic temperature compatible with estimates from detailed models (see text). Squares (continuous line) represent 12CO data and triangles (dashed lines) show 13CO data. Each rotational transition is represented by the energy (in K) of its upper level.
Current usage metrics show cumulative count of Article Views (full-text article views including HTML views, PDF and ePub downloads, according to the available data) and Abstracts Views on Vision4Press platform.
Data correspond to usage on the plateform after 2015. The current usage metrics is available 48-96 hours after online publication and is updated daily on week days.
Initial download of the metrics may take a while.


