| Issue |
A&A
Volume 533, September 2011
|
|
|---|---|---|
| Article Number | A103 | |
| Number of page(s) | 10 | |
| Section | Interstellar and circumstellar matter | |
| DOI | https://doi.org/10.1051/0004-6361/201117445 | |
| Published online | 12 September 2011 | |
Discovery of the source HESS J1356-645 associated with the young and energetic PSR J1357-6429
1
Universität Hamburg, Institut für Experimentalphysik,
Luruper Chaussee 149,
22761
Hamburg,
Germany
2
Laboratoire Univers et Particules de Montpellier, Université
Montpellier 2, CNRS/IN2P3, CC 72,
Place Eugène Bataillon, 34095
Montpellier Cedex 5,
France
e-mail: This email address is being protected from spambots. You need JavaScript enabled to view it.
; This email address is being protected from spambots. You need JavaScript enabled to view it.
3
Max-Planck-Institut für Kernphysik, PO Box 103980, 69029
Heidelberg,
Germany
4 Dublin Institute for Advanced Studies, 31 Fitzwilliam Place,
Dublin 2, Ireland
5 National Academy of Sciences of the Republic of Armenia,
Yerevan
6
Yerevan Physics Institute, 2 Alikhanian Brothers St., 375036
Yerevan,
Armenia
7
Universität Erlangen-Nürnberg, Physikalisches
Institut, Erwin-Rommel-Str.
1, 91058
Erlangen,
Germany
8
Nicolaus Copernicus Astronomical Center, ul. Bartycka
18, 00-716
Warsaw,
Poland
9
CEA Saclay, DSM/IRFU, 91191
Gif-Sur-Yvette Cedex,
France
10
University of Durham, Department of Physics,
South Road, Durham
DH1 3LE,
UK
11 Astroparticule et Cosmologie (APC), CNRS, Université Paris
7 Denis Diderot, 10 rue Alice Domon et Léonie Duquet, 75205 Paris Cedex 13, France (UMR 7164: CNRS, Université Paris VII, CEA, Observatoire de Paris )
12
Laboratoire Leprince-Ringuet, École Polytechnique,
CNRS/IN2P3, 91128
Palaiseau,
France
13
Institut für Theoretische Physik, Lehrstuhl IV: Weltraum und
Astrophysik, Ruhr-Universität Bochum, 44780
Bochum,
Germany
14
Landessternwarte, Universität Heidelberg,
Königstuhl, 69117
Heidelberg,
Germany
15
Institut für Physik, Humboldt-Universität zu Berlin,
Newtonstr. 15, 12489
Berlin,
Germany
16
LUTH, Observatoire de Paris, CNRS, Université Paris
Diderot, 5 place Jules
Janssen, 92190
Meudon,
France
17 LPNHE, Université Pierre et Marie Curie Paris 6, Université
Denis Diderot Paris 7, CNRS/IN2P3, 4 place Jussieu, 75252, Paris Cedex 5, France
18
Institut für Astronomie und Astrophysik, Universität
Tübingen, Sand 1,
72076
Tübingen,
Germany
19
Astronomical Observatory, The University of Warsaw,
Al. Ujazdowskie 4, 00-478
Warsaw,
Poland
20
Unit for Space Physics,North-West University,
Potchefstroom
2520, South
Africa
21
Laboratoire d’Annecy-le-Vieux de Physique des Particules,
Université de Savoie, CNRS/IN2P3, 74941
Annecy-le-Vieux,
France
22
Oskar Klein Centre, Department of Physics, Stockholm University,
Albanova University Center, 10691
Stockholm,
Sweden
23 University of Namibia, Department of Physics, Private Bag
13301, Windhoek, Namibia
24
Laboratoire d’Astrophysique de Grenoble, INSU/CNRS, Université
Joseph Fourier, BP
53, 38041
Grenoble Cedex 9,
France
25
Department of Physics and Astronomy, The University of Leicester,
University Road, Leicester, LE1
7RH, UK
26
Instytut Fizyki Ja¸drowej PAN, ul. Radzikowskiego
152, 31-342
Kraków,
Poland
27
Institut für Astro- und Teilchenphysik,
Leopold-Franzens-Universität Innsbruck, 6020
Innsbruck,
Austria
28
Obserwatorium Astronomiczne, Uniwersytet Jagielloński, ul. Orla
171, 30-244
Kraków,
Poland
29
Toruń Centre for Astronomy, Nicolaus Copernicus
University, ul. Gagarina
11, 87-100
Toruń,
Poland
30
School of Chemistry & Physics, University of
Adelaide, Adelaide
5005,
Australia
31 Charles University, Faculty of Mathematics and Physics,
Institute of Particle and Nuclear Physics, V Holešovičkách 2, 180 00 Prague 8, Czech Republic
32
School of Physics & Astronomy, University of
Leeds, Leeds
LS2 9JT,
UK
33
European Associated Laboratory for Gamma-Ray
Astronomy, jointly supported
by CNRS and MPG,
France
Received: 9 June 2011
Accepted: 8 August 2011
Abstract
Context. Several newly discovered very-high-energy (VHE; E > 100 GeV) γ-ray sources in the Galaxy are thought to be associated with energetic pulsars. Among them, middle-aged (≳ 104 yr) systems exhibit large centre-filled VHE nebulae, offset from the pulsar position, which result from the complex relationship between the pulsar wind and the surrounding medium, and reflect the past evolution of the pulsar.
Aims. Imaging Atmospheric Cherenkov Telescopes (IACTs) have been successful in revealing extended emission from these sources in the VHE regime. Together with radio and X-ray observations, this observational window allows one to probe the energetics and magnetic field inside these large-scale nebulae.
Methods. H.E.S.S., with its large field of view, angular resolution of ≲0.1° and unprecedented sensitivity, has been used to discover a large population of such VHE sources. In this paper, the H.E.S.S. data from the continuation of the Galactic Plane Survey (− 80° < ℓ < 60°, |b| < 3°), together with the existing multi-wavelength observations, are used.
Results. A new VHE γ-ray source was discovered at RA (J2000) = 13h56m00s, Dec (J2000) = −64°30′00′′ with a 2′ statistical error in each coordinate, namely HESS J1356−645. The source is extended, with an intrinsic Gaussian width of (0.20 ± 0.02)°. Its integrated energy flux between 1 and 10 TeV of 8 × 10-12 erg cm-2 s-1 represents ~11% of the Crab Nebula flux in the same energy band. The energy spectrum between 1 and 20 TeV is well described by a power law dN/dE ∝ E−Γ with photon index Γ = 2.2 ± 0.2stat ± 0.2sys. The inspection of archival radio images at three frequencies and the analysis of X-ray data from ROSAT/PSPC and XMM-Newton/MOS reveal the presence of faint non-thermal diffuse emission coincident with HESS J1356−645.
Conclusions. HESS J1356−645 is most likely associated with the young and energetic pulsar PSR J1357−6429 (d = 2.4 kpc, τc = 7.3 kyr and Ė = 3.1 × 1036 erg s-1), located at a projected distance of ~5 pc from the centroid of the VHE emission. HESS J1356−645 and its radio and X-ray counterparts would thus represent the nebula resulting from the past history of the PSR J1357−6429 wind. In a simple one-zone model,
Supported by CAPES Foundation, Ministry of Education of Brazil.
Supported by Erasmus Mundus, External Cooperation Window.
© ESO, 2011
constraints on the magnetic field strength in the nebula are obtained from the flux of the faint and extended X-ray emission detected with ROSAT and XMM-Newton. Fermi-LAT upper limits in the high-energy (HE; 0.1−100 GeV) domain are also used to constrain the parent electron spectrum. From the low magnetic field value inferred from this approach (~3−4 μG), HESS J1356−645 is thought to share many similarities with other known γ-ray emitting nebulae, such as Vela X, as it exhibits a large-scale nebula seen in radio, X-rays and VHE gamma-rays.
Key words. surveys – gamma rays: general – ISM: individual objects: PSR J1357−6429 – ISM: individual objects: HESS J1356−645
1. Introduction
The survey of the Galactic plane conducted with the H.E.S.S. (High Energy Stereoscopic System) experiment since 2004, covering essentially the whole inner Galaxy (Aharonian et al. 2006a; Chaves et al. 2008), has led to the discovery of about fifty new sources in the very-high-energy (VHE; E > 100 GeV) γ-ray domain (Hinton & Hofmann 2009). A significant fraction of these sources remain without any clear counterpart at lower (radio and X-rays) energies (Aharonian et al. 2008a). Pulsar wind nebulae (PWNe), which represent the largest population of identified Galactic VHE sources so far, could naturally account for a large fraction of these unclassified sources (de Jager et al. 2009). These bubbles of relativistic particles and magnetic field are created when the ultra-relativistic pulsar wind interacts with the surrounding medium (see Gaensler & Slane 2006; Bucciantini 2008, for recent reviews). Such interaction leads to the formation of a so-called termination shock, which is thought to be the site of particle acceleration beyond hundreds of TeV. Luminous nebulae are thus observed across the entire electromagnetic spectrum, in the synchrotron emission from radio to hard X-rays, and through inverse Compton processes and potentially π0 decay from p-p interactions (Amato et al. 2003; Bednarek & Bartosik 2003; Horns et al. 2006), in the VHE domain. Radio and X-ray observations have revealed the complex morphology of the inner PWN structure at the arcsecond scale (Gaensler & Slane 2006). Moreover, H.E.S.S. has proven itself to be capable of measuring, in HESS J1825-137 (Aharonian et al. 2006d), spatially resolved spectra at the tens of arcmin scale. These VHE observations, together with the on-going Fermi-LAT (Large Area Telescope) observations in the high-energy (HE; 0.1−100 GeV) gamma-ray domain (Atwood et al. 2009), permit one to probe the particle spectra in these sources, and provide a unique approach to determining the average magnetic field strength (see de Jager & Djannati-Ataï 2009, for a discussion in this regard).
Two classes of VHE PWNe have recently emerged, based on their observational properties: young systems, such as the Crab nebula (Aharonian et al. 2006c), G0.9+0.1 (Aharonian et al. 2005a), MSH 15−52 (Aharonian et al. 2005b) and the newly discovered H.E.S.S. sources associated with the Crab-like pulsars of G21.5−0.9 and Kes 75 (Djannati-Ataï et al. 2008), and the middle-aged sources (i.e. with characteristic ages τc ≳ 104 yr1), as exemplified by Vela X (Aharonian et al. 2006b), HESS J1825−137 (Aharonian et al. 2006d), HESS J1718−385 and HESS J1809−193 (Aharonian et al. 2007). In the former case, the VHE emission is usually unresolved and centered on the pulsar, while in the latter case, these VHE PWNe were found to be significantly extended and offset from the pulsar position. The large differences in the measured sizes of the VHE and X-ray emission regions, ranging from a factor of a few to ~100, can be explained by the difference in the cooling timescales of particles radiating in the two domains (see e.g. Aharonian et al. 2006d). The evolution of the supernova remnant (SNR) blastwave into an inhomogeneous interstellar medium (ISM; Blondin et al. 2001) and/or the high velocity of the pulsar (van der Swaluw et al. 2004) may both explain these large offset centre-filled VHE sources as being the ancient nebulae from the history of the pulsar wind inside its host SNR (de Jager & Djannati-Ataï 2009).
This paper deals with the results from the H.E.S.S. observations and data analysis of one of these VHE PWN candidates, HESS J1356−645. This source lies close to PSR J1357−6429, a young (τc = 7.3 kyr) and energetic (with a spin-down luminosity Ė = 3.1 × 1036 erg s-1) 166 ms pulsar, discovered during the Parkes multibeam survey of the Galactic Plane (Camilo et al. 2004). At a distance of 2.4 d2.4 kpc (with d2.4 = d/2.4 kpc), as inferred from dispersion measure, PSR J1357−6429 may be, after the Crab, the nearest young (τc < 104 yr) pulsar known. Follow-up X-ray observations with XMM-Newton and Chandra have been performed (Esposito et al. 2007; Zavlin 2007). Using radio ephemerides, an indication of a high X-ray pulsed fraction (pf ≳ 50%) was found by Zavlin (2007). The X-ray spectrum of PSR J1357−6429 is well described by a non-thermal (magnetospheric, Γ = 1.4 ± 0.5) component plus a blackbody radiation at 0.16 keV (Esposito et al. 2007), the latter being detected in only a few young radio pulsars. The fraction of the spin-down energy channeled into the observed 0.5−10 keV flux of ~7.4 × 10⁻⁵  represents one of the lowest ever observed amongst the rotation-powered pulsars. As noticed by Esposito et al. (2007), PSR J1357−6429 shares similarities in this regard with the Vela pulsar and PSR B1706−44, for which thermal emission has also been detected. These authors found a 3σ marginal evidence of diffuse emissive region at the 10′′ scale in the XMM-Newton/EPIC 2−4 keV band and set a 3σ 2−10 keV upper limit on a putative PWN with Chandra data of 2.8 × 1031 erg s-1. On the other hand, Zavlin (2007) reported the presence of a faint tail-like emission extending northeast at a distance of ~2′′ from PSR J1357−6429, with a 0.5−10 keV luminosity of 2.3 × 1031 erg s-1. Since the proper motion of the pulsar has not yet been measured, the nature of this elongated feature is still under debate.
The H.E.S.S. observations, data analysis and the characteristics of HESS J1356−645 are provided in Sect. 2. Results from the analysis of archival radio continuum and X-ray (ROSAT/PSPC and XMM-Newton/MOS) data are presented in Sect. 3, together with those recently obtained from Fermi-LAT observations and presented in the companion paper of Lemoine-Goumard et al. (2011). A general discussion is given in Sect. 4.
2. H.E.S.S. observations and results
H.E.S.S. comprises four identical 12 m diameter IACTs located in the Khomas Highland of Namibia at a height of 1800 m above sea level. Sensitive to γ-rays above ~100 GeV, the H.E.S.S. array commonly achieves an event-by-event angular resolution of ≲0.1° and a relative energy resolution of ~15%. The observations discussed here were first taken between April and June 2005, as part of the on-going H.E.S.S. Galactic Plane survey which now covers the band −80° < ℓ < 60° in longitude and |b| < 3° in latitude. Additionally, two sets of dedicated observations were taken in May 2006 and March 2007 in the direction of the pulsar PSR J1357−6429 in so-called wobble mode (Daum et al. 1997), where data are taken with an alternating offset from the target position of typically ± 0.7°. Events within 3° of PSR J1357−6429 and recorded when at least three of the four telescopes were operational were considered. After applying quality selection to discard data affected by unstable weather conditions or problems related to the hardware, the resulting dataset was analyzed using the standard H.E.S.S. survey analysis scheme (Aharonian et al. 2006a). A radius of the on-source region θcut of 0.22°, a ring background region with a mean radius of 0.8° and the hard cuts were used. These cuts include a minimum requirement of 200 photo electrons per shower image, parametrized using the Hillas moment-analysis technique (Hillas 1996), for γ-ray selection. The zenith angles of the observations range from 39° to 54° (with a mean value of 45°) inferring a mean energy threshold of 800 GeV. The acceptance-corrected live time is ~10 h at the position of the VHE emission.
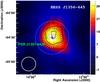 |
Fig. 1 Image of the VHE γ-ray excess centered on HESS J1356−645, smoothed with a Gaussian of width 0.13°. The linear colour scale is in units of excess counts per arcmin2. The black contours correspond to the 5, 7 and 9σ levels for an integration radius of 0.22°. The black cross indicates the best fit position of the source centroid together with its statistical error. The intrinsic Gaussian source size is shown by the white dashed circle. The dotted circle indicates the region of spectral extraction (see Fig. 2). The position of PSR J1357−6429 is marked with a green triangle. The white solid circle represents the 68% containment radius of the resulting point spread function. |
The H.E.S.S. excess count image, smoothed with a Gaussian profile of width 0.13° in order to mitigate statistical fluctuations, is shown in Fig. 1. An excess of VHE emission is found with a pre-trials peak significance of 10σ, i.e. 8.5σ after taking into account the number of trials (see e.g. Aharonian et al. 2006a). The centroid position and intrinsic Gaussian width of the source were determined by fitting the uncorrelated excess map with a symmetric Gaussian convolved by the nominal H.E.S.S. point spread function (PSF) for this dataset (with a 68% containment radius of ~0.08°). This led to a best-fit position of RA (J2000) = 13h56m00s, Dec (J2000) = −64°30′00′′ with statistical error of 2′ for each coordinate, and an intrinsic width of 0.20° ± 0.02°stat, as shown by the black cross and the dashed circle in Fig. 1, respectively. Therefore, HESS J1356−645 is clearly an extended source, well described by a Gaussian profile at the level of available statistics.
The spectral analysis was performed on observations at less than 2° from the best-fit position of HESS J1356−645, to avoid any systematical effect arising from larger uncertainties in the reconstructed energy for showers which are reconstructed far off-axis. The source spectrum was determined within a circular region of 0.34° radius, as shown by the dotted circle in Fig. 1. This region represents an ~80% source enclosure, which is a compromise between the optimal signal to noise ratio and the independence to the source morphology. Using the same cuts as for the imaging analysis, the background is estimated using the reflected-region technique, where background events are selected from circular off-source regions of same angular size and offset from the observation position as the on-source region (Berge et al. 2007). The resulting spectrum of HESS J1356−645 shown in Fig. 2 is well described between 1 and 20 TeV by a power-law of the form dN/dE = N0 (E/1 TeV)−Γ with photon index Γ = 2.2 ± 0.2stat ± 0.2sys and flux normalization at 1 TeV N0 = (2.7 ± 0.9stat ± 0.4sys) × 10-12 cm-2 s-1 TeV-1 (χ2/d.o.f. = 1.8/4, with an associated p-value of 0.77). Adding an exponential cutoff to the power-law does not improve the fit. A lower limit on the cutoff energy of 3.5 TeV at the 95% confidence level was derived. The 1−10 TeV integrated energy flux of 8 × 10-12 erg cm-2 s-1 represents ~11% of the Crab Nebula flux (Aharonian et al. 2006c), in the same energy band.
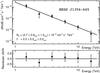 |
Fig. 2 Differential energy spectrum of HESS J1356−645, extracted within the dotted circular region shown in Fig. 1. Events with energies between 0.8 and 30 TeV were binned in order to reach a significance of at least 2σ per resulting bin. The data points were fitted with a power law whose best fit is shown with the black solid line. Also shown are the residuals in the bottom panel. |
3. Search for counterparts
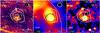 |
Fig. 3 Radio images (in square root scale) centered on HESS J1356−645. The colour scale is such that the blue-to-red transition occurs at about the respective measured rms (see Table 1). In each case, the beamsize of the instrument is depicted by the white circle in the upper right corner. The position of PSR J1357−6429 is marked with a green cross and the white contours represent the levels of the H.E.S.S. correlated significance, as shown in Fig. 1. The black circle denotes the region within which flux densities were calculated. Left: Molonglo Observatory Synthesis Telescope (MOST) image at 843 MHz from the MGPS-2 (Murphy et al. 2007). The grey circle denotes the position of the catalogued point-like source MGPS J135623-643323. Middle: Parkes image at 2.4 GHz (Duncan et al. 1995). The three grey ellipses mark the positions of the SNR candidates G309.8-2.6 (in the centre), G310.6-2.0 and G310.5-3.5 (only partly shown in the image) found by Duncan et al. (1997). Right: Parkes-MIT-NRAO (PMN) image at 4.85 GHz (Griffith & Wright 1993). The grey ellipses mark the positions of the two catalogued extended sources, PMN J1355-6433 and PMN J1355-6435 (Wright et al. 1994). |
3.1. General considerations
Catalogues of Galactic SNRs (Green 2009), HII regions (Paladini et al. 2003), star-forming complexes (Russeil 2003) and WR stars (van der Hucht 2001) do not list any potential VHE emitters in the vicinity of HESS J1356−645. However, at a projected distance of ~7′ (i.e. 5 d2.4 pc) from the centroid position of HESS J1356−645, PSR J1357−6429 appears to be the most plausible counterpart, within the context of VHE PWN candidates described in Sect. 1, given that its spin-down luminosity Ė = 3.1 × 1036 erg s-1 would imply a conversion efficiency of L1−10 TeV/Ė = (0.9−2.8) × 10-3 . Moreover, Camilo et al. (2004) have shown that PSR J1357−6429 is located near the radio SNR candidate G309.8−2.6 (see Sect. 3.2), previously discovered and catalogued as an elongated area of enhanced radio emission by Duncan et al. (1997), from the Parkes 2.4 GHz survey of the Southern Galactic Plane (Duncan et al. 1995, see Sect. 3.2).
The distance estimate of PSR J1357−6429 would result in a VHE intrinsic source size of ~9 d2.4 pc. The observed offset between PSR J1357−6429 and the centroid of the VHE emission could be accounted for as a result of either a high proper motion of the pulsar (van der Swaluw et al. 2004), or a density gradient in the surrounding medium (Blondin et al. 2001). In the former case, the required transverse velocity is ~650 d2.4  km s-1, where τ7.3 is the true age of the pulsar relative to its characteristic age of 7.3 kyr. Such a velocity is relatively large in comparison with the mean value reported by Hobbs et al. (2005) (with a mean 2D speed for pulsars with τc < 3 Myr of 307 ± 47 km s-1) from a sample of 233 pulsar proper motions, but similar to what has been measured for a few PSRs. In the latter case, the location of PSR J1357−6429, ~105 d2.4 pc from the Galactic Plane, i.e. beyond the thin disc known to be highly inhomogeneous, would argue against the scenario of Blondin et al. (2001), where the offset PWN would be explained by the asymmetry in the SNR geometry due to the inhomogeneities in the ISM. However, the lack of available molecular line data in the direction of PSR J1357−6429 prevents one from drawing firm conclusions in this regard.
Regardless of the physical explanation for the observed offset between PSR J1357−6429 and the VHE centroid, the system should have already experienced the reverse shock interaction phase, where the reverse shock has collided with the entire shock surface bounding the pulsar wind. After this phase, an offset PWN from the initial energetic stage of the pulsar wind is formed. HESS J1356−645 would then correspond to such a nebula radiating in the VHE domain. According to the hydrodynamical model of van der Swaluw et al. (2004), this phase occurs on a timescale of ≲103  (Mej/M⊙)5/6
  yrs, where E51 is the total mechanical energy of the SN explosion in units of 1051 erg, Mej is the mass in the SN ejecta, and n0 is the ambient number density in units of cm-3. Even in the case of a core-collapse event (Mej = 10 M⊙, with E51 and n0 equal to unity), this timescale is smaller than the characteristic age of PSR J1357−6429, which renders this scenario plausible.
3.2. Radio continuum observations
As discussed in Sect. 1, PWNe are commonly detected in X-rays and radio. Interestingly enough, the above-mentioned SNR candidate G309.8−2.6 turns out to be located at only ~0.1° away from HESS J1356−645. Archival radio images from the Molonglo Galactic Plane Survey (MGPS-2) at 843 MHz (Murphy et al. 2007), from the Parkes 2.4 GHz Survey (Duncan et al. 1995) and from the Parkes-MIT-NRAO (PMN) survey at 4.85 GHz (Griffith & Wright 1993) have been inspected in order to shed light on the nature of this SNR candidate. The main characteristics of these three surveys are reported in Table 1.
Radio continuum observations towards HESS J1356−645.
Images from these three radio surveys and centered on HESS J1356−645 are shown in Fig. 3, with the position of PSR J1357−6429 denoted by the green cross and the H.E.S.S. significance contours from Fig. 1 overlaid in white. Extended emission is seen in each image, partly coincident with HESS J1356−645. On the left image, the grey circle marks the position of the point-like source MGPS J135623-643323, with a flux density of 18.2 ± 2.8 mJy, as measured by Murphy et al. (2007). Duncan et al. (1997) have catalogued a list of SNR candidates from the Parkes 2.4 GHz Survey. The selection was based on the source morphology, on the absence (or faint level) of coincident thermal emission by inspecting the IRAS images at 60 μm, and on the level of polarization. Three of them, namely G309.8−2.6 (at the centre of the image, 15′ × 35′ in size), G310.6-2.0 (on the north-western region, 45′ in diameter) and G310.5-3.5 (2.7° × 3.5° in diameter), with respective flux densities of 3.9 ± 1.0, 11 ± 3 and 19 ± 5 Jy, are shown in grey in Fig. 3 (middle). Based on the polarized intensity images, Duncan et al. (1997) suggested that the first two SNR candidates may be unrelated to the larger G310.5-3.5, but there is no distance estimate for any of these three sources. On the right image, the two grey ellipses denote the positions of the two extended sources PMN J1355-6433 and PMN J1355-6435, with respective flux densities of 158 ± 11 and 140 ± 10 mJy, as catalogued by Wright et al. (1994). The black circle shown in Fig. 3 represents the region of spectral extraction (with a radius of 0.18°) and was chosen to enclose most of the diffuse radio emission seen in the MGPS-2 and PMN images. It should be noted that the MOST telescope does not detect structures on angular scales larger than 20−30 arcmin (Murphy et al. 2007), and that such large sources are also partially suppressed during the PMN data reduction (Condon et al. 1993). This would explain why the larger SNR candidates G310.6-2.0 and G310.5-3.5 are not detected in the MGPS-2 and PMN images, while present in the image processed by Duncan et al. (1995) at 2.4 GHz.
In the MGPS-2 image2, the flux density of the point-like source MGPS J135623-643323 was removed, after summing all the pixels inside the black circle and correcting for the beam. With an average brightness (~3 mJy beam-1) of only two times the local rms noise, the flux density of this extended emission at 843 MHz (see Table 1) must be considered with caution.
In the Parkes 2.4 GHz image3, G309.8−2.6 lies above the broad and faint shell-like emission of the very large SNR candidate G310.5-3.5, which might be responsible for much of the diffuse emission, as mentioned by Duncan et al. (1997). Therefore its flux density as well as its morphology have to be taken into consideration. Assuming that the three SNR candidates are unrelated to each other, the underlying contribution of G310.5-3.5 to the final flux density within the region of interest was estimated by modelling G310.5-3.5 as a uniform elliptical shell of 19 Jy, with external sizes of 2.7° × 3.5° as given by Duncan et al. (1997) and internal sizes half as large. This underlying emission amounts to ~0.48 ± 0.13 Jy and was subtracted from the total flux density (corrected for the beam).
In the PMN image at 4.85 GHz4, the two catalogued sources have not been considered as such in the calculation, given that some complex diffuse objects like the one shown in Fig. 3 (right) may have been considered as multiple sources by the automatical procedure, which was optimized to primarily detect point sources (Wright et al. 1994). Instead, individual fluxes have been simply summed within the black circle and the flux density was corrected for the beam.
The flux densities and respective errors at these three frequencies are reported in Table 1. Fitting these data points with a power-law gives a normalization at 1 GHz of 0.54 ± 0.04 Jy and a slope α = 0.01 ± 0.07 (where Sν ∝ να), with χ2/d.o.f. = 1.14/1. As seen in Table 1, the 2.4 GHz flux density is ~2σ above the baseline formed by the two data points at 0.843 and 4.85 GHz. However, as presented above, estimating the contribution of the large and faint shell-like emission from G310.5-3.5 is a difficult task, and the flux density measured at 2.4 GHz has certainly to be taken as an upper limit. For instance, the tail-like structure north-east to the central bright emission, originally considered by Duncan et al. (1997) as part of G309.8−2.6, could simply be a region of enhanced shell emission within G310.5-3.5. In any case, the 2.4 GHz measurement only influences the normalization of the radio spectrum. A power-law fit on the two other data points, with a normalization at 1 GHz fixed to 0.54 Jy, gives a consistent spectral index of α = 0.01 ± 0.06. Changing the size of the region defined for calculating the flux densities does not change the results significantly. Such a flat radio spectrum suggests G309.8−2.6 to be a PWN rather than a shell-type SNR given that typical indices for PWNe are −0.3 ≲ α ≲ 0 (Gaensler & Slane 2006), while those for shell-type SNRs are usually close to −0.5 (Green 2009). The lack of evidence for a shell-type morphology in the MGPS-2 and PMN images strengthens this scenario.
3.3. X-ray observations
VHE PWNe may also be detected in the X-ray domain, as exemplified by Vela X, for which the VHE emission matches quite well the extended structure seen by ROSAT and ASCA (Aharonian et al. 2006b; Horns et al. 2007). Such an extended X-ray emission has also been measured recently in the direction of HESS J1825-137 (Uchiyama et al. 2009) and HESS J1809-193 (Kargaltsev & Pavlov 2007). XMM-Newton and Chandra observations towards HESS J1356−645 have been performed and analyzed by Esposito et al. (2007) and Zavlin (2007), but no clear evidence of a PWN has been found yet, with the exception of a faint tail-like emission reported by the latter group.
3.3.1. ROSAT
ROSAT/PSPC archival data5, with an average angular resolution of 45′′ (FWHM, according to the Calibration Memo CAL/ROS/93-015), have been inspected in order to search for diffuse X-ray emission towards HESS J1356−645. Figure 4 shows the ROSAT/PSPC image (smoothed with a Gaussian with σ = 5′) of the vignetting-corrected and background-subtracted count rate in the 1−2.5 keV band, centered on HESS J1356−645. The observed extended and faint emission cannot be explained by point-like sources since only two very faint sources, flagged as true detections, were found within 0.2° from the centroid of the extended emission, in the ROSAT All-Sky Survey Source Catalogs (Voges et al. 1999, 2000): 1RXS J135615.9-642757 is marked with a very low reliability, while 1RXS J135605.5-642902 has a faint count rate of (4.81 ± 1.33) × 10-2 s-1. In order to calculate the flux and significance of this extended X-ray emission, a source region and four background regions were defined, as depicted by the yellow dashed circles of 0.2° in radius in Fig. 4.
After summing counts within the source (Csrc) and background (Cbkg) regions, the excess count rate was calculated as Csrc – α × Cbkg, where α represents the ratio of the exposure times in the source and background regions. Since the ROSAT/PSPC exposure map of the region centered on HESS J1356−645 is quite uniform (with a mean value of ~0.45 ks and a dispersion of about 3%), α is simply 1/4. The associated significance was computed according to the prescription of Li & Ma (1983). The excess count rate of the X-ray diffuse emission is found to be 0.142 s-1 at the 6σ confidence level. Varying the sizes of the source region between 0.15 and 0.25° does not change the results significantly. A 2D symmetrical Gaussian fit was applied to the ROSAT/PSPC image to quantify the significance of the observed source extent. The best-fit Gaussian width is found to be 0.14° ± 0.04° (90% confidence level), much larger than the PSPC angular resolution. This extended emission does not appear in the images at lower energies (i.e. in the 0.11−0.4 and 0.4−1 keV bands), most likely because of the relatively large hydrogen column density. Therefore, its flux has been calculated through the HEASARC software WebPIMMS6. With NH = (2−7) × 1021 cm-2, as measured by Esposito et al. (2007) towards PSR J1357−6429, and assuming a power-law with spectral index between 2 and 2.4 (as measured by H.E.S.S., see also Sect. 4), the ROSAT/PSPC count rate of ~0.142 s-1 translates into an unabsorbed 1−2.5 keV flux of 3.6 × 10⁻¹² erg cm-2 s-1.
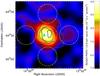 |
Fig. 4 ROSAT/PSPC image of the vignetting-corrected and background-subtracted count rate in the 1−2.5 keV band. The image has been smoothed with a Gaussian of width σ = 5′. The white contours denote the levels of the H.E.S.S. correlated significance, as in Fig. 1. The position of the pulsar PSR J1357−6429 is marked with a green triangle. The yellow dashed circles show the source and background regions used to estimate the significance of the extended X-ray emission. |
3.3.2. XMM-Newton
Due to the low level of statistics in the ROSAT data, no spectral information on the nebula could be derived. In order to constrain the spectral properties of the extended X-ray emission seen by PSPC, a 85 ks archival XMM-Newton observation (PI: G. Pavlov, ObsId: 0603280101), centered on PSR J1357−6429, was analyzed using SAS v9.0.0. To remove the proton flare contamination during the observation, a histogram of the 10−12 keV count rates of the two MOS cameras was built. A Gaussian fit was then performed on this 10−12 keV count rate distribution in order to remove time intervals where the count rates were beyond 3σ from the mean value (Pratt & Arnaud 2002). The remaining exposure time after flare screening is 55 ks. Note that, for this observation, the PN camera was operated in timing mode and is therefore not used in the analysis. The instrumental background was derived from the compilation of filter wheel closed observations7, in the same detector area as the source, and renormalized in the 10−12 keV band over the whole field of view. Events from the list of the 42 point sources (PSR J1357−6429 included), automatically detected in the observation by the XMM-Newton Survey Science Center (for a total 0.5−6 keV flux of 1.4 × 10⁻¹² erg cm-2 s-1), were removed in order to focus on the properties of the diffuse X-ray emission.
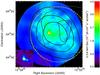 |
Fig. 5 XMM-Newton/MOS image of the 0.5−6 keV flux, adaptively smoothed to a signal-to-noise ratio of 15 (using asmooth from the SAS software) with all the detected point sources, except PSR J1357−6429, removed. Small-scale structures close to PSR J1357−6429 are better revealed in the inset image with a colour scale ranging from 0 to 8 × 10⁻⁵ ph cm-2 s-1 arcmin-2. The solid white contours denote the levels of the H.E.S.S. correlated significance, while the black contours correspond to the ROSAT/PSPC smoothed excess count rates. The yellow dashed circle shows the source region used for spectral extraction, as in Fig. 4. |
The vignetting-corrected and background-subtracted combined image of the MOS 1 and MOS 2 cameras in the 0.5−6 keV band is shown in Fig. 5. An extended emission is clearly seen around the position of PSR J1357−6429, matching the extended emission seen with ROSAT/PSPC. Small-scale structures are also seen close to PSR J1357−6429, and are discussed in more details, using Chandra observations, in the companion paper of Lemoine-Goumard et al. (2011).
The yellow dashed circle shown in Fig. 5 represents the region of spectral extraction for the X-ray nebula, which corresponds to the ROSAT/PSPC source extraction region shown in Fig. 4. The astrophysical background was extracted over the rest of the field-of-view. The latter spectrum is well described by an absorbed APEC8 model (kT = 0.21 keV, norm = 4.4 × 10⁻³ cm-5) + power-law (Γ = 1.95, N0 = 7.9 × 10⁻⁴ cm-2 s-1 keV-1 at 1 keV) model, with χ2 = 711 for 624 d.o.f. The hydrogen column density was fixed for both components to the best-fit value derived by Lemoine-Goumard et al. (2011) from Chandra observations of PSR J1357−6429 NH = (3.9 ± 0.4) × 1021 cm-2. When let free in our model, the best-fit column density is NH = (2.9 ± 0.9) × 1021 cm-2 (errors are quoted at the 90% confidence level), similar to the value derived on the pulsar.
These two best-fit models have been renormalized to the area of the source region and were used as fixed components in the fit of the spectrum of the source region (see Fig. 6). The spectrum of the X-ray nebula (in red) is described by an absorbed power-law with the column density fixed to the value derived on the pulsar, Γ = 1.82 ± 0.04 and N0 = (2.65 ± 0.07) × 10-3 cm-2 s-1 keV-1 at 1 keV, with χ2 = 683 for 631 d.o.f. The unabsorbed 1−2.5 keV flux then amounts to (4.25 ± 0.20) × 10-12 erg cm-2 s-1, which is in agreement with the ROSAT/PSPC flux estimated in Sect. 3.3.1, within the respective uncertainties.
In order to estimate the level of systematics arising from such a large X-ray emission (~0.2° in radius, of the same order as the XMM-Newton field of view), several source positions around PSR J1357−6429 have been tested. The resulting systematic uncertainties on the nebula’s best-fit parameters are 0.1 on the photon index and 10% on the normalization.
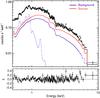 |
Fig. 6 XMM-Newton/MOS 0.5–10 keV spectrum of the total emission (in black) in the source region shown in Fig. 5. The background spectrum (in blue) is best described by an absorbed power-law + APEC model, while the source spectrum (in red) is fitted with an absorbed power-law. A rebinning was applied in order to reach 10σ/bin. Residuals are shown in the bottom panel. |
3.4. Fermi-LAT observations
After nearly three years of observation, the LAT instrument onboard Fermi has been successful in identifying the HE counterpart of several PWNe powered by energetic PSRs, all of them being also detected in the VHE domain (see Slane et al. 2010; Ackermann et al. 2011, and references therein). The high spin-down flux at Earth of PSR J1357−6429 (≃ 5.4 × 1035  erg s-1 kpc-2) is in the range of the previously LAT-detected PWNe (Ackermann et al. 2011). Lemoine-Goumard et al. (2011) have recently discovered γ-ray pulsations from PSR J1357−6429 using more than two years of Fermi-LAT data, together with radio rotational ephemerides obtained with the Parkes radiotelescope. Upper limits on the emission from the associated PWN HESS J1356−645 in the 100 MeV−100 GeV range have also been reported, by assuming a Gaussian shape with σ = 0.2°, as measured with H.E.S.S. These 95% CL (confidence level) upper limits, shown in Fig. 7, were derived using off-pulse data below 4.5 GeV, and from the whole dataset above 4.5 GeV, where no pulsed emission is detected.
4. Discussion
It was shown in the previous section that an extended radio structure, originally catalogued as a SNR candidate, and an extended X-ray emission lie close to the newly discovered VHE source HESS J1356−645. Such radio-X-ray-VHE association is usually the observational feature of shell-type and plerionic SNRs. Regarding the morphology alone, the current VHE data do not allow us to firmly distinguish between these two scenarios. Despite the high confidence level of the H.E.S.S. detection, the VHE emission could only be characterized as a 0.2° symmetric Gaussian. The extended emission seen at 843 MHz appears as a faint blob of ~0.18° in radius with an average flux density of only twice as high as the rms noise, while that seen at 2.4 GHz, catalogued as G309.8−2.6, lies within a complex diffuse emission, potentially associated with another SNR candidate. Only the radio emission observed at 4.85 GHz is safely detected. The ROSAT/PSPC extended emission in the 1−2.5 keV band roughly exhibits the same size as those in the radio and VHE domains, but given its significance of 6σ, it could not be well characterized neither morphologically nor spectrally. However, thanks to a deep XMM-Newton observation towards PSR J1357−6429, this faint and extended X-ray emission has been clearly detected. Therefore, the presence of a nearby energetic and young pulsar PSR J1357−6429, the spectral index of the extended structure measured in radio and the X-ray-VHE association all point towards the scenario of a PWN associated with the past evolution of PSR J1357−6429. In the following, it is then assumed that the radio and X-ray sources are really the counterparts of HESS J1356−645, and the reliability of such a scenario based on qualitative arguments will be discussed, keeping in mind that further multi-wavelength observations are needed in order to trigger more detailed calculations.
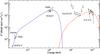 |
Fig. 7 Spectral Energy Distribution of HESS J1356−645. The blue and red lines represent the SYN and IC emissions respectively, derived from a parent electron spectrum in the form of a power-law with an exponential cutoff (see text). The multi-wavelength data are presented in Sects. 2 and 3. The magnetic field strength is set to 3.5 μG. |
In a one-zone leptonic model, a distribution of accelerated electrons cools radiatively by means of synchrotron (SYN) and inverse-Compton (IC) channels in a single volume. The IC scattering is assumed to take place in the Thomson regime. Within this emission volume, a constant and entangled magnetic field and a homogeneous seed photon distribution from the cosmic microwave background radiation (CMB) only are considered. For a power-law distribution of accelerated electrons Kγ−p, the general equation relating the SYN energy flux (FSYN) produced by electrons with Lorentz factors between γ1,SYN and γ2,SYN and the IC energy flux (FIC) radiated between γ1,IC and γ2,IC can be expressed as in Aharonian et al. (2009): 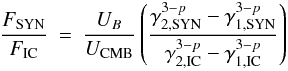 (1)where UB (~2.5
  eV cm-3, where B-5 is the magnetic field value in units of 10 μG) and UCMB (=0.26 eV cm-3) are the energy densities of the magnetic field and of the CMB photon field, respectively. It is further assumed that electrons emit synchrotron and inverse-Compton photons at the following characteristic energies (the so-called δ-functional approximation, see Aharonian et al. 1997):
 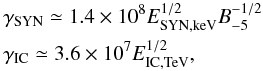 where ESYN,keV and EIC,TeV are the SYN and IC photon energies in units of keV and TeV, respectively. Substituting the above relations into Eq. (1) leads to the general expression of the magnetic field:
 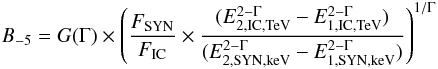 (2)where G(Γ) ≃ (0.1 × 15Γ−2)1/Γ, and Γ = (p + 1)/2 is the common photon index (dN/dE ∝ E−Γ) of SYN and IC spectra. In case the SYN and IC fluxes both originate from the same population of electrons, and for Γ = 2 (i.e. p = 3), Eq. (2) reduces to the standard formula: FSYN/FIC ≃ 10 (Aharonian et al. 1997).
Within this simple leptonic model, the VHE (H.E.S.S.) and X-ray (ROSAT/PSPC and XMM-Newton) measurements then permit an exploration of the acceptable range of B-field values in HESS J1356−645. Since ROSAT/PSPC does not provide any spectral index, Γ is simply assumed to be that measured by H.E.S.S. ΓVHE = 2.2 ± 0.2. The X-ray flux measured in the 1−2.5 keV energy range is provided in Sect. 3.3.1. As for the XMM-Newton results, the photon index ΓX = 1.82 ± 0.119 is marginally consistent with ΓVHE at the 2σ confidence level, so that Γ is supposed to lie between 1.8 and 2. Accounting for all the uncertainties in the VHE and X-ray measurements, Eq. (2) leads to a B-field of 4.5 (2.5−8.5) μG from ROSAT/PSPC and 3.5 (2.5−4.5) μG from XMM-Newton.
The extended structure seen in the X-ray and VHE γ-ray domains would then represent the ancient PWN from the early phases of PSR J1357−6429, where electrons which had been accelerated in the past simply age nowadays through radiative losses. Thus, a maximal energy is obtained by equating the PSR age (=2 τc/(n−1), with n the braking index) to the total radiation lifetime (see Eq. (6) in de Jager & Djannati-Ataï 2009). The associated maximal energies of IC and SYN photons then read:
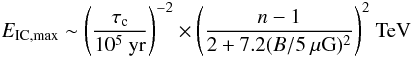 (3)
(3)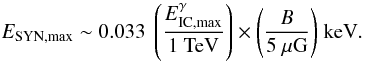 (4)
For a B-field in the nebula of 3.5 μG and a PSR age of 7.3 kyr (with n = 3), the IC and SYN photon maximal energies would then lie at ~17 TeV and ~0.5 keV, respectively. The latter value seems too low to account for the X-ray spectrum as measured with XMM-Newton, well fitted with a power-law up to ~7 keV. However, it should be noted that the relevant timescale τ in such Emax estimates is rather the time elapsed since the end of the PWN crushing phase, which typically ends a few kyrs after the pulsar birth (Blondin et al. 2001; van der Swaluw et al. 2004), i.e. at the time the ancient PWN such as HESS J1356−645 is formed. Therefore, for a B-field of 3.5 μG, Eqs. (3) and (4) give EIC,max ~ 200 (τ/2.5 kyr)-2 TeV and ESYN,max ~ 5 (τ/2.5 kyr)-2 keV, compatible with the XMM-Newton and H.E.S.S. measurements. Such a maximal energy in the VHE domain, at 13.8 ± 2.3 TeV, has been detected in Vela X (Aharonian et al. 2006b). This measurement led de Jager & Djannati-Ataï (2009) to constrain the magnetic field in the nebula to be as low as ~3 μG, comparable to what is found here for HESS J1356−645. The VHE spectrum of the latter is well fitted with a power-law between 1 and 20 TeV, and the 95% CL lower limit on a cutoff energy of 3.5 TeV derived in Sect. 2 is compatible with these estimates.
(4)
For a B-field in the nebula of 3.5 μG and a PSR age of 7.3 kyr (with n = 3), the IC and SYN photon maximal energies would then lie at ~17 TeV and ~0.5 keV, respectively. The latter value seems too low to account for the X-ray spectrum as measured with XMM-Newton, well fitted with a power-law up to ~7 keV. However, it should be noted that the relevant timescale τ in such Emax estimates is rather the time elapsed since the end of the PWN crushing phase, which typically ends a few kyrs after the pulsar birth (Blondin et al. 2001; van der Swaluw et al. 2004), i.e. at the time the ancient PWN such as HESS J1356−645 is formed. Therefore, for a B-field of 3.5 μG, Eqs. (3) and (4) give EIC,max ~ 200 (τ/2.5 kyr)-2 TeV and ESYN,max ~ 5 (τ/2.5 kyr)-2 keV, compatible with the XMM-Newton and H.E.S.S. measurements. Such a maximal energy in the VHE domain, at 13.8 ± 2.3 TeV, has been detected in Vela X (Aharonian et al. 2006b). This measurement led de Jager & Djannati-Ataï (2009) to constrain the magnetic field in the nebula to be as low as ~3 μG, comparable to what is found here for HESS J1356−645. The VHE spectrum of the latter is well fitted with a power-law between 1 and 20 TeV, and the 95% CL lower limit on a cutoff energy of 3.5 TeV derived in Sect. 2 is compatible with these estimates.
Within this one-zone leptonic framework, the exact expressions of SYN and IC emissions from a parent electron spectrum have been calculated (Blumenthal & Gould 1970) and qualitatively fitted to the multi-wavelength data for a B-field of 3.5 μG, as shown in Fig. 7. Besides the CMB, the Galactic interstellar radiation field at the location of HESS J1356−645, used to calculate the IC emission, was derived from the latest estimates of Porter & Strong (2005)10. It comprises the Galactic infrared (from dust, at T ~ 35 K and 350 K) and optical (from stars, at T ~ 4600 K) emission, with energy densities of 0.66 and 0.94 eV cm-3, respectively. In addition to the radio, X-ray and VHE γ-ray data, the Fermi-LAT upper limits discussed in Sect. 3.4 (Lemoine-Goumard et al. 2011), are also shown. The parent electron spectrum is in the form dNe/dEe ∝ Ee−p exp(− Ee/Ecut) for Ee ∈ [Emin,Emax] , with spectral index p = 2.5, Emin = 13 GeV (and Emax set to 1 PeV), Ecut = 350 TeV, and a total lepton energy Etot = 5 × 1047 erg. Note that a low energy cutoff of 13 GeV in the electron spectrum is in the range of minimum particle energies considered in several works (Kennel & Coroniti 1984; Ackermann et al. 2011). The total particle energy must be compared to the rotational kinetic energy of PSR J1357−6429 since birth, Esd = ( −
−  )I/2, where the spin periods Pi = 2π/Ωi (the indices 0 and t denote the initial and current values, respectively) and I is the moment of inertia of the neutron star (taken to be 1.4 × 1045 g cm2). With Pt = 166 ms, a lower limit on the rotational kinetic energy Esd ≳ 5 × 1048 erg is derived for any intial period P0 ≲ 70 ms. Therefore, this spin-down energy implies a reasonable conversion efficiency η = Etot/Esd ≲ 0.1 .
It should be noted that these calculations implicitely assume that the observed radio, X-ray and VHE morphologies indeed probe the same emissive region, whereas in Figs. 4 and 5, there seems to be a slight offset between the ROSAT/XMM-Newton and H.E.S.S. extended emissions, X-rays coming from a more compact region closer to PSR J1357−6429, i.e. where the magnetic field could be higher. Only through detailed calculations which take into account the spatial and temporal evolution of both particles and magnetic field in such PWN system (see e.g. Gelfand et al. 2009), could these key parameters be efficiently constrained.
5. Conclusion
A new VHE source, namely HESS J1356−645, has been discovered during the continuation of the H.E.S.S. Galactic Plane Survey. This extended source lies close to PSR J1357−6429, a recently discovered young (τc = 7.3 kyr), nearby (d = 2.4 kpc) and energetic pulsar (Ė = 3.1 × 1036 erg s-1). Archival radio and X-ray data have revealed an extended structure, though faint, coincident with the VHE emission. Given the faintness of the emission seen in these energy domains, the poor information on its morphology prevents one from distinguishing between shell-type and plerionic SNR as the origin of HESS J1356−645. However, (1) the presence of an energetic pulsar; (2) the centre-filled morphology with a flat spectral index measured in radio; and (3) the existence of a diffuse X-ray emission point towards the scenario of an evolved and offset VHE PWN.
Besides comparable ages, HESS J1356−645 shares several similarities with the Vela PWN (whose pulsar PSR B0833−45 has a τc = 11.3 kyr and lies at a distance of 290 pc), regarding both the pulsar (very low LX/Ė efficiencies and presence of thermal X-ray emission) and the PWN (similar ratios of compact/X-ray to diffuse/radio PWN sizes) properties. The 2′′ tail-like X-ray emission close to PSR J1357−6429 (Zavlin 2007) could be the pulsar jet, which is observed in the Vela pulsar at the sub-arcmin scales. The radio counterpart of HESS J1356−645, ~0.35° in size, would thus correspond to the bright 2° × 3° radio structure (the so-called Vela X), extending southwest of the Vela pulsar. In terms of the broad-band non-thermal emission, the so-called Vela cocoon, a 45′-long collimated X-ray filament extending southward of PSR B0833−45, has been detected in VHE γ-rays (Aharonian et al. 2006b), while the whole Vela X radio structure was recently detected in the GeV domain with AGILE (Pellizzoni et al. 2010) and Fermi-LAT (Abdo et al. 2010). These measurements seem to point towards the scenario of two distinct lepton spectral components, first suggested by de Jager (2007), and later studied by de Jager et al. (2008) and LaMassa et al. (2008). However, follow-up H.E.S.S. observations have recently allowed for the detection of significant VHE emission beyond the cocoon, up to 1.2° from the VHE barycentre, with a spectrum similar to that of the cocoon (Dubois et al. 2009). In the case of HESS J1356−645, at the estimated distance of PSR J1357−6429, the putative “cocoon-like” structure would appear as nearly point-like (~0.09° long) for H.E.S.S. However, such structure cannot be the dominant VHE component as HESS J1356−645 is well fitted simply with a Gaussian width of 0.2° (see Sect. 2). HESS J1356−645 would then represent the VHE counterpart to the “Vela X-like” radio structure (see Sect. 3.2), detected also in X-rays with ROSAT/PSPC and XMM-Newton (see Sect. 3.3). Thus, given the observational limitations of the current radio and VHE γ-ray data, the broad-band spectrum of HESS J1356−645 can be explained by a single lepton population with reasonable parameters, as presented in Sect. 4.
From qualitative arguments, it was shown that the magnetic field within HESS J1356−645 must be quite low (~3−4 μG), of the same order as what has been implied in other PWNe (e.g. Vela PWN, see de Jager et al. 2008), under similar assumptions as investigated here. Follow-up observations in radio will help to constrain the pulsar braking index and proper motion, and confirm the nature of the extended emission. The combined GeV-TeV data from the continuation of Fermi observations and future VHE observations with the upcoming H.E.S.S. phase II will better constrain the spectral shape of the IC emission, in order to probe the magnetic field strength and the energetics of HESS J1356−645.
. A recent article by C. Chang, G. G. Pavlov and O. Kargaltsev on “X-ray observations of the young pulsar PSR J1357-6429 and its pulsar wind nebula” has been posted on astro-ph (arXiv:1107.1819) when this article was in the refereeing process. X-ray images reveal the PWN comprised of a compact (on 10 arcsec scales) and a more extended (on arcmin scale) component. The authors made use of the same archival radio continuum data as those presented in our article, and suggest that the observed diffuse emission is the relic PWN rather than the SNR.
Bearing in mind that the characteristic age may not reflect the true pulsar age, as this is valid only when the braking index and when the pulsar’s initial spin period is much smaller than that observed today.
ftp://ftp.atnf.csiro.au/pub/data/pmn/surveys/
Astrophysical plasma emission code, see http://hea-www.harvard.edu/APEC
Statistical and systematical errors on the spectral index and normalization, provided in Sect. 3.3.2, have been summed quadratically.
Acknowledgments
We would like to thank Frank Haberl for his help and precious advice on the ROSAT archival images, and Tara Murphy for helpful discussion about the MPGS-2 radio data. The support of the Namibian authorities and of the University of Namibia in facilitating the construction and operation of HESS is gratefully acknowledged, as is the support by the German Ministry for Education and Research (BMBF), the Max Planck Society, the French Ministry for Research, the CNRS-IN2P3 and the Astroparticle Interdisciplinary Programme of the CNRS, the UK Science and Technology Facilities Council (STFC), the IPNP of the Charles University, the Polish Ministry of Science and Higher Education, the South African Department of Science and Technology and National Research Foundation, and by the University of Namibia. We appreciate the excellent work of the technical support staff in Berlin, Durham, Hamburg, Heidelberg, Palaiseau, Paris, Saclay, and in Namibia in the construction and operation of the equipment.
References
- Abdo, A. A., Ackermann, M., Ajello, M., et al. (Fermi collaboration) 2010, ApJ, 713, 146 [NASA ADS] [CrossRef] [Google Scholar]
- Aharonian, F., Atoyan, A. M., & Kifune, T. 1997, MNRAS, 291, 162 [NASA ADS] [CrossRef] [Google Scholar]
- Aharonian, F., Akhperjanian, A. G., Aye, K.-M., et al. (H.E.S.S. collaboration) 2005a, A&A, 432, L25 [Google Scholar]
- Aharonian, F., Akhperjanian, A. G., Aye, K.-M., et al. (H.E.S.S. collaboration) 2005b, A&A, 435, L17 [NASA ADS] [CrossRef] [EDP Sciences] [Google Scholar]
- Aharonian, F., Akhperjanian, A. G., Bazer-Bachi, A. R., et al. (H.E.S.S. collaboration) 2006a, ApJ, 636, 777 [Google Scholar]
- Aharonian, F., Akhperjanian, A. G., Bazer-Bachi, A. R., et al. (H.E.S.S. collaboration) 2006b, A&A, 448, L43 [NASA ADS] [CrossRef] [EDP Sciences] [Google Scholar]
- Aharonian, F., Akhperjanian, A. G., Bazer-Bachi, A. R., et al. (H.E.S.S. collaboration) 2006c, A&A, 457, 899 [NASA ADS] [CrossRef] [EDP Sciences] [Google Scholar]
- Aharonian, F., Akhperjanian, A. G., Bazer-Bachi, A. R., et al. (H.E.S.S. collaboration) 2006d, A&A, 460, 365 [NASA ADS] [CrossRef] [EDP Sciences] [Google Scholar]
- Aharonian, F., Akhperjanian, A. G., Bazer-Bachi, A. R., et al. (H.E.S.S. collaboration) 2007, A&A, 472, 489 [NASA ADS] [CrossRef] [EDP Sciences] [Google Scholar]
- Aharonian, F., Akhperjanian, A. G., Barres de Almeida, U., et al. (H.E.S.S. collaboration) 2008a, A&A, 477, 353 [Google Scholar]
- Aharonian, F., Akhperjanian, A. G., Barres de Almeida, U., et al. (H.E.S.S. collaboration) 2008b, A&A, 484, 435 [NASA ADS] [CrossRef] [EDP Sciences] [Google Scholar]
- Aharonian, F., Akhperjanian, A. G., de Almeida, U. B., et al. (H.E.S.S. collaboration) 2009, ApJ, 692, 1500 [NASA ADS] [CrossRef] [Google Scholar]
- Ackermann, M., Ajello, M., Baldini, L., et al. 2011, ApJ, 726, 35 [NASA ADS] [CrossRef] [Google Scholar]
- Amato, E., Guetta, D., & Blasi, P. 2003, A&A, 402, 827 [NASA ADS] [CrossRef] [EDP Sciences] [Google Scholar]
- Atwood, W. B., Abdo, A. A., Ackermann, M., et al. (Fermi collaboration) 2009, ApJ, 697, 1071 [NASA ADS] [CrossRef] [Google Scholar]
- Bednarek, W., & Bartosik, M. 2003, A&A, 405, 689 [NASA ADS] [CrossRef] [EDP Sciences] [Google Scholar]
- Berge, D., Funk, S., & Hinton, J. 2007, A&A, 466, 1219 [Google Scholar]
- Blondin, J. M., Chevalier, R. A., & Frierson, D. M. 2001, ApJ, 563, 806 [NASA ADS] [CrossRef] [Google Scholar]
- Blumenthal, G. R., & Gould, R. J. 1970, Rev. Mod. Phys., 42, 237 [NASA ADS] [CrossRef] [Google Scholar]
- Bucciantini, N. 2008, AIP Conf. Proc., 983, 186 [NASA ADS] [CrossRef] [Google Scholar]
- Camilo, F., Manchester, R. N., Lyne, A. G., et al. 2004, ApJ, 611, L25 [NASA ADS] [CrossRef] [Google Scholar]
- Carter, J. A., & Read, A. M. 2007, A&A, 464, 1155 [NASA ADS] [CrossRef] [EDP Sciences] [Google Scholar]
- Chaves, R. C. G., de Oña Wilhemi, E., & Hoppe, S. (H.E.S.S. collaboration) 2008, AIP Conf. Proc., 1085, 219 [Google Scholar]
- Condon, J. J., Griffith, M. R., & Wright, A. E. 1993, AJ, 106, 1095 [NASA ADS] [CrossRef] [Google Scholar]
- Daum, A., Hermann, G., Hess, M., et al. (HEGRA collaboration) 1997, Astropart. Phys., 8, 1 [NASA ADS] [CrossRef] [Google Scholar]
- de Jager, O. C. 2007, ApJ, 658, 1177 [NASA ADS] [CrossRef] [Google Scholar]
- de Jager, O. C., & Djannati-Ataï, A. 2009, Neutron Stars and Pulsars, ASSL, 357, 451 [Google Scholar]
- de Jager, O. C., Slane, P. O., & LaMassa, S. M. 2008, ApJ, 689, L125 [NASA ADS] [CrossRef] [Google Scholar]
- de Jager, O. C., et al. 2009, Proc. 31st ICRC, in press [Google Scholar]
- Djannati-Ataï, A., de Jager, O. C., Terrier, R., et al. (H.E.S.S. collaboration) 2008, Proc. 30th ICRC, 2, 823 [Google Scholar]
- Dubois, F., et al. (H.E.S.S. collaboration) 2009, Proc. 31st ICRC, in press [Google Scholar]
- Duncan, A. R., Stewart, R. T., Haynes, R. F., & Jones, K. L. 1995, MNRAS, 277, 36 [NASA ADS] [Google Scholar]
- Duncan, A. R., Stewart, R. T., Haynes, R. F., & Jones, K. L. 1997, MNRAS, 287, 722 [NASA ADS] [Google Scholar]
- Esposito, P., Tiengo, A., de Luca, A., & Mattana, F. 2007, A&A, 467, L45 [NASA ADS] [CrossRef] [EDP Sciences] [Google Scholar]
- Gaensler, B. M., & Slane, P. O. 2006, ARA&A, 44, 17 [NASA ADS] [CrossRef] [Google Scholar]
- Gallant, Y. A., Carrigan, S., Djannati-Ataï, A., et al. 2008, AIP Conf. Proc., 983, 195 [NASA ADS] [CrossRef] [Google Scholar]
- Gelfand, J. D., Slane, P. O., & Zhang, W. 2009, ApJ, 703, 2051 [NASA ADS] [CrossRef] [Google Scholar]
- Green, D. A. 2009, BASI, 37, 45 [NASA ADS] [Google Scholar]
- Griffith, M. R., & Wright, A. E. 1993, AJ, 105, 1666 [NASA ADS] [CrossRef] [Google Scholar]
- Hillas, A. M. 1996, Space Sci. Rev., 75, 17 [NASA ADS] [CrossRef] [Google Scholar]
- Hinton, J. A., & Hofmann, W. 2009, ARA&A, 47, 523 [NASA ADS] [CrossRef] [Google Scholar]
- Hobbs, G., Lorimer, D. R., Lyne, A. G., & Kramer, M. 2005, MNRAS, 360, 974 [NASA ADS] [CrossRef] [Google Scholar]
- Horns, D., Aharonian, F., Santangelo, A., Hoffmann, A. I. D., & Masterson, C. 2006, A&A, 451, L51 [NASA ADS] [CrossRef] [EDP Sciences] [Google Scholar]
- Horns, D., Aharonian, F., Hoffmann, A. I. D., & Santangelo, A. 2007, Ap&SS, 309, 189 [NASA ADS] [CrossRef] [Google Scholar]
- Kargaltsev, O., & Pavlov, G. G. 2007, ApJ, 670, 655 [NASA ADS] [CrossRef] [Google Scholar]
- Kennel, C. F., & Coroniti, F. V. 1984, ApJ, 283, 710 [NASA ADS] [CrossRef] [Google Scholar]
- LaMassa, S. M., Slane, P. O., & de Jager, O. C. 2008, ApJ, 689, L121 [NASA ADS] [CrossRef] [Google Scholar]
- Lemoine-Goumard, M., Zavlin, V. E., Grondin, M.-H., et al. 2011, A&A, 533, A102 [NASA ADS] [CrossRef] [EDP Sciences] [Google Scholar]
- Li, T.-P., & Ma, Y.-Q. 1983, ApJ, 272, 317 [NASA ADS] [CrossRef] [Google Scholar]
- Murphy, T., Mauch, T., Green, A., et al. 2007, MNRAS, 382, 382 [NASA ADS] [CrossRef] [Google Scholar]
- Paladini, R., Burigana, C., Davies, R. D., et al. 2003, A&A, 397, 213 [NASA ADS] [CrossRef] [EDP Sciences] [Google Scholar]
- Pellizzoni, A., Trois, A., Tavani, M., et al. (AGILE collaboration) 2010, Science, 327, 663 [NASA ADS] [CrossRef] [PubMed] [Google Scholar]
- Porter, T. A., & Strong, A. W. 2005, Proc. 29th ICRC, 4, 77 [Google Scholar]
- Pratt, G. W., & Arnaud, M. 2002, A&A, 394, 375 [NASA ADS] [CrossRef] [EDP Sciences] [Google Scholar]
- Russeil, D. 2003, A&A, 397, 133 [NASA ADS] [CrossRef] [EDP Sciences] [Google Scholar]
- Slane, P., Castro, D., Funk, S., et al. 2010, ApJ, 720, 266 [NASA ADS] [CrossRef] [Google Scholar]
- Uchiyama, H., Matsumoto, H., Tsuru, T. G., et al. 2009, PASJ, 61, S189 [NASA ADS] [CrossRef] [Google Scholar]
- van der Hucht, K. A. 2001, New Astr. Rev., 45, 135 [NASA ADS] [CrossRef] [Google Scholar]
- van der Swaluw, E., Downes, T. P., & Keegan, R. 2004, A&A, 420, 937 [NASA ADS] [CrossRef] [EDP Sciences] [Google Scholar]
- Voges, W., Aschenbach, B., Boller, Th., et al. 1999, A&A, 349, 389 [NASA ADS] [Google Scholar]
- Voges, W., Aschenbach, B., Boller, Th., et al. 2000, IAUC Circ., 7432, 3 [Google Scholar]
- Wright, A. E., Griffith, M. R., Burke, B. F., & Ekers, R. D. 1994, ApJS, 91, 111 [NASA ADS] [CrossRef] [Google Scholar]
- Zavlin, V. E. 2007, ApJ, 665, L143 [NASA ADS] [CrossRef] [Google Scholar]
All Tables
All Figures
|
Fig. 1 Image of the VHE γ-ray excess centered on HESS J1356−645, smoothed with a Gaussian of width 0.13°. The linear colour scale is in units of excess counts per arcmin2. The black contours correspond to the 5, 7 and 9σ levels for an integration radius of 0.22°. The black cross indicates the best fit position of the source centroid together with its statistical error. The intrinsic Gaussian source size is shown by the white dashed circle. The dotted circle indicates the region of spectral extraction (see Fig. 2). The position of PSR J1357−6429 is marked with a green triangle. The white solid circle represents the 68% containment radius of the resulting point spread function. |
| In the text | |
|
Fig. 2 Differential energy spectrum of HESS J1356−645, extracted within the dotted circular region shown in Fig. 1. Events with energies between 0.8 and 30 TeV were binned in order to reach a significance of at least 2σ per resulting bin. The data points were fitted with a power law whose best fit is shown with the black solid line. Also shown are the residuals in the bottom panel. |
| In the text | |
|
Fig. 3 Radio images (in square root scale) centered on HESS J1356−645. The colour scale is such that the blue-to-red transition occurs at about the respective measured rms (see Table 1). In each case, the beamsize of the instrument is depicted by the white circle in the upper right corner. The position of PSR J1357−6429 is marked with a green cross and the white contours represent the levels of the H.E.S.S. correlated significance, as shown in Fig. 1. The black circle denotes the region within which flux densities were calculated. Left: Molonglo Observatory Synthesis Telescope (MOST) image at 843 MHz from the MGPS-2 (Murphy et al. 2007). The grey circle denotes the position of the catalogued point-like source MGPS J135623-643323. Middle: Parkes image at 2.4 GHz (Duncan et al. 1995). The three grey ellipses mark the positions of the SNR candidates G309.8-2.6 (in the centre), G310.6-2.0 and G310.5-3.5 (only partly shown in the image) found by Duncan et al. (1997). Right: Parkes-MIT-NRAO (PMN) image at 4.85 GHz (Griffith & Wright 1993). The grey ellipses mark the positions of the two catalogued extended sources, PMN J1355-6433 and PMN J1355-6435 (Wright et al. 1994). |
| In the text | |
|
Fig. 4 ROSAT/PSPC image of the vignetting-corrected and background-subtracted count rate in the 1−2.5 keV band. The image has been smoothed with a Gaussian of width σ = 5′. The white contours denote the levels of the H.E.S.S. correlated significance, as in Fig. 1. The position of the pulsar PSR J1357−6429 is marked with a green triangle. The yellow dashed circles show the source and background regions used to estimate the significance of the extended X-ray emission. |
| In the text | |
|
Fig. 5 XMM-Newton/MOS image of the 0.5−6 keV flux, adaptively smoothed to a signal-to-noise ratio of 15 (using asmooth from the SAS software) with all the detected point sources, except PSR J1357−6429, removed. Small-scale structures close to PSR J1357−6429 are better revealed in the inset image with a colour scale ranging from 0 to 8 × 10⁻⁵ ph cm-2 s-1 arcmin-2. The solid white contours denote the levels of the H.E.S.S. correlated significance, while the black contours correspond to the ROSAT/PSPC smoothed excess count rates. The yellow dashed circle shows the source region used for spectral extraction, as in Fig. 4. |
| In the text | |
|
Fig. 6 XMM-Newton/MOS 0.5–10 keV spectrum of the total emission (in black) in the source region shown in Fig. 5. The background spectrum (in blue) is best described by an absorbed power-law + APEC model, while the source spectrum (in red) is fitted with an absorbed power-law. A rebinning was applied in order to reach 10σ/bin. Residuals are shown in the bottom panel. |
| In the text | |
|
Fig. 7 Spectral Energy Distribution of HESS J1356−645. The blue and red lines represent the SYN and IC emissions respectively, derived from a parent electron spectrum in the form of a power-law with an exponential cutoff (see text). The multi-wavelength data are presented in Sects. 2 and 3. The magnetic field strength is set to 3.5 μG. |
| In the text | |
Current usage metrics show cumulative count of Article Views (full-text article views including HTML views, PDF and ePub downloads, according to the available data) and Abstracts Views on Vision4Press platform.
Data correspond to usage on the plateform after 2015. The current usage metrics is available 48-96 hours after online publication and is updated daily on week days.
Initial download of the metrics may take a while.