Fig. 4
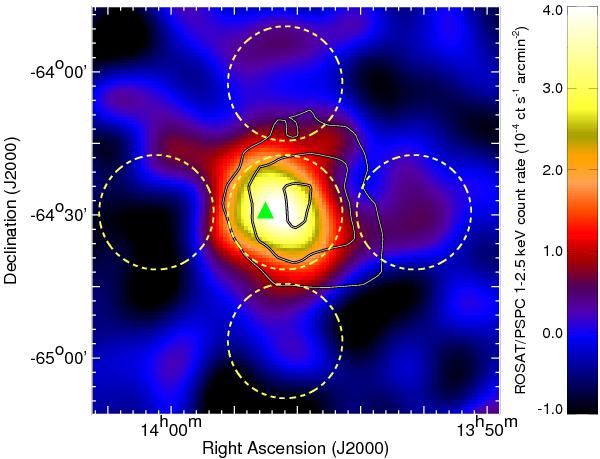
ROSAT/PSPC image of the vignetting-corrected and background-subtracted count rate in the 1−2.5 keV band. The image has been smoothed with a Gaussian of width σ = 5′. The white contours denote the levels of the H.E.S.S. correlated significance, as in Fig. 1. The position of the pulsar PSR J1357−6429 is marked with a green triangle. The yellow dashed circles show the source and background regions used to estimate the significance of the extended X-ray emission.
Current usage metrics show cumulative count of Article Views (full-text article views including HTML views, PDF and ePub downloads, according to the available data) and Abstracts Views on Vision4Press platform.
Data correspond to usage on the plateform after 2015. The current usage metrics is available 48-96 hours after online publication and is updated daily on week days.
Initial download of the metrics may take a while.