Fig. 3
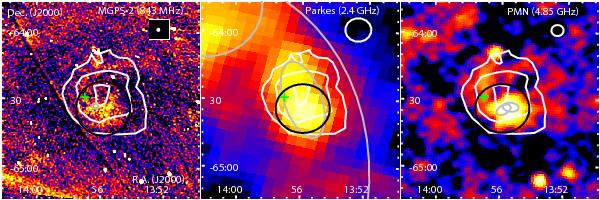
Radio images (in square root scale) centered on HESS J1356−645. The colour scale is such that the blue-to-red transition occurs at about the respective measured rms (see Table 1). In each case, the beamsize of the instrument is depicted by the white circle in the upper right corner. The position of PSR J1357−6429 is marked with a green cross and the white contours represent the levels of the H.E.S.S. correlated significance, as shown in Fig. 1. The black circle denotes the region within which flux densities were calculated. Left: Molonglo Observatory Synthesis Telescope (MOST) image at 843 MHz from the MGPS-2 (Murphy et al. 2007). The grey circle denotes the position of the catalogued point-like source MGPS J135623-643323. Middle: Parkes image at 2.4 GHz (Duncan et al. 1995). The three grey ellipses mark the positions of the SNR candidates G309.8-2.6 (in the centre), G310.6-2.0 and G310.5-3.5 (only partly shown in the image) found by Duncan et al. (1997). Right: Parkes-MIT-NRAO (PMN) image at 4.85 GHz (Griffith & Wright 1993). The grey ellipses mark the positions of the two catalogued extended sources, PMN J1355-6433 and PMN J1355-6435 (Wright et al. 1994).
Current usage metrics show cumulative count of Article Views (full-text article views including HTML views, PDF and ePub downloads, according to the available data) and Abstracts Views on Vision4Press platform.
Data correspond to usage on the plateform after 2015. The current usage metrics is available 48-96 hours after online publication and is updated daily on week days.
Initial download of the metrics may take a while.