Fig. 5
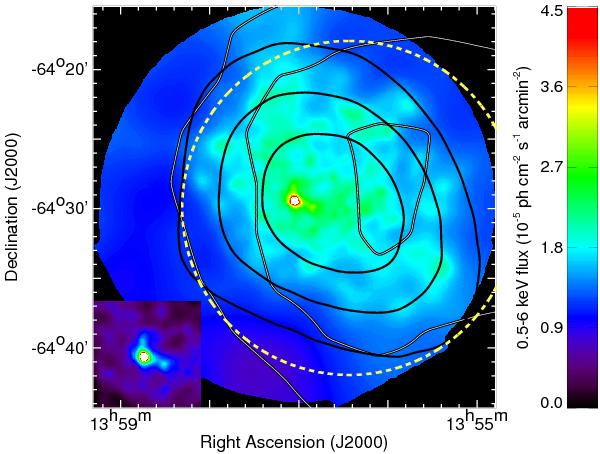
XMM-Newton/MOS image of the 0.5−6 keV flux, adaptively smoothed to a signal-to-noise ratio of 15 (using asmooth from the SAS software) with all the detected point sources, except PSR J1357−6429, removed. Small-scale structures close to PSR J1357−6429 are better revealed in the inset image with a colour scale ranging from 0 to 8 × 10⁻⁵ ph cm-2 s-1 arcmin-2. The solid white contours denote the levels of the H.E.S.S. correlated significance, while the black contours correspond to the ROSAT/PSPC smoothed excess count rates. The yellow dashed circle shows the source region used for spectral extraction, as in Fig. 4.
Current usage metrics show cumulative count of Article Views (full-text article views including HTML views, PDF and ePub downloads, according to the available data) and Abstracts Views on Vision4Press platform.
Data correspond to usage on the plateform after 2015. The current usage metrics is available 48-96 hours after online publication and is updated daily on week days.
Initial download of the metrics may take a while.