Fig. 6
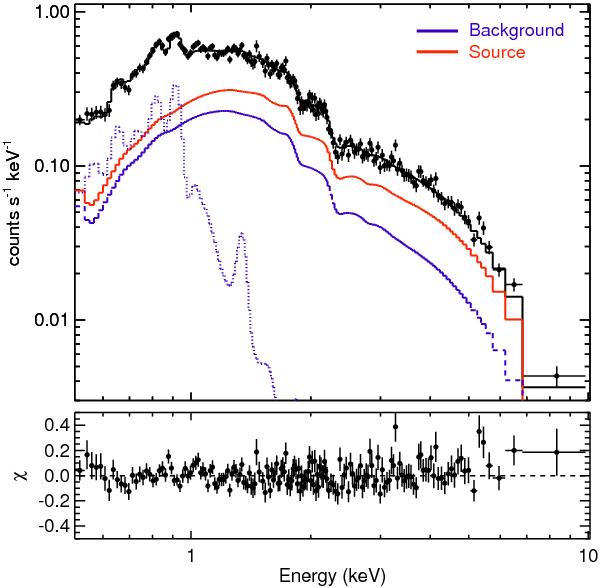
XMM-Newton/MOS 0.5–10 keV spectrum of the total emission (in black) in the source region shown in Fig. 5. The background spectrum (in blue) is best described by an absorbed power-law + APEC model, while the source spectrum (in red) is fitted with an absorbed power-law. A rebinning was applied in order to reach 10σ/bin. Residuals are shown in the bottom panel.
Current usage metrics show cumulative count of Article Views (full-text article views including HTML views, PDF and ePub downloads, according to the available data) and Abstracts Views on Vision4Press platform.
Data correspond to usage on the plateform after 2015. The current usage metrics is available 48-96 hours after online publication and is updated daily on week days.
Initial download of the metrics may take a while.