Fig. 1
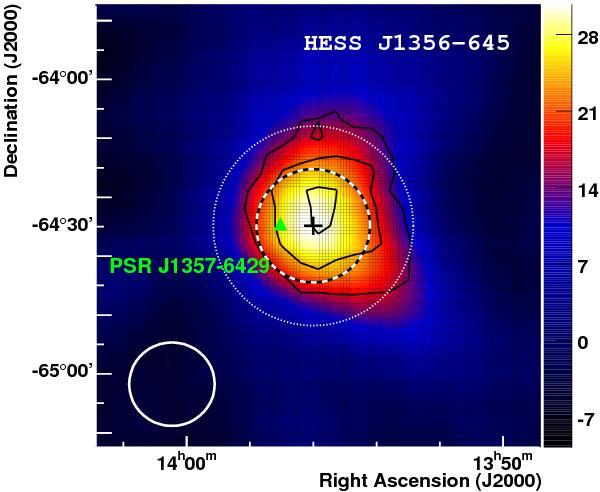
Image of the VHE γ-ray excess centered on HESS J1356−645, smoothed with a Gaussian of width 0.13°. The linear colour scale is in units of excess counts per arcmin2. The black contours correspond to the 5, 7 and 9σ levels for an integration radius of 0.22°. The black cross indicates the best fit position of the source centroid together with its statistical error. The intrinsic Gaussian source size is shown by the white dashed circle. The dotted circle indicates the region of spectral extraction (see Fig. 2). The position of PSR J1357−6429 is marked with a green triangle. The white solid circle represents the 68% containment radius of the resulting point spread function.
Current usage metrics show cumulative count of Article Views (full-text article views including HTML views, PDF and ePub downloads, according to the available data) and Abstracts Views on Vision4Press platform.
Data correspond to usage on the plateform after 2015. The current usage metrics is available 48-96 hours after online publication and is updated daily on week days.
Initial download of the metrics may take a while.