| Issue |
A&A
Volume 531, July 2011
|
|
|---|---|---|
| Article Number | A50 | |
| Number of page(s) | 12 | |
| Section | Interstellar and circumstellar matter | |
| DOI | https://doi.org/10.1051/0004-6361/201016306 | |
| Published online | 09 June 2011 | |
Massive young disks around Herbig Ae stars ⋆,⋆⋆
1
Istituto di Radioastronomia - INAF, via Gobetti 101, Bologna, Italy
e-mail: boissier@ira.inaf.it
2
ESO, Karl Schwarzschild Str. 2, 85748 Garching bei Muenchen, Germany
3
Institut de radioastronomie millimétrique, 300 rue de la piscine, Domaine universitaire, 38406 Saint-Martin d’Hères, France
4
Observatorio Astronómico Nacional (OAN), Apdo. 112, 28803 Alcalá de Henares, Madrid, Spain
5
Leiden Observatory, Leiden University, PO Box 9513, 2300 RA Leiden, The Netherlands
Received: 13 December 2010
Accepted: 18 April 2011
Context. Herbig Ae stars (HAe) are the precursors of Vega-type systems, hence crucial objects in planet formation studies. Thus far, only a few disks associated with HAe stars have been studied using millimetre interferometers.
Aims. Our aim is to determine the dust evolution and the lifetime of the disks associated with Herbig Ae stars.
Methods. We imaged the continuum emission at ~3 mm and ~1.3 mm of the Herbig Ae/Be stars BD+61154, RR Tau, VY Mon, and LkHα 198 using the Plateau de Bure Interferometer (PdBI). These stars are in the upper end of the stellar mass range of the Herbig Ae stars (M∗ > 3 M⊙). Our measurements were used to complete the spectral energy distribution (SED). The modelling of the SED, in particular the FIR-mm part, allows us to determine the masses and dust properties of these disks.
Results. We detected the disks associated with BD+61154, RR Tau, and VY Mon with disk masses of 0.35 M⊙, 0.05 M⊙, and 0.40 M⊙, respectively. The disk around LkHα 198 was not detected with an upper limit to the disk mass of 0.004 M⊙. We detected, however, the disks associated with the younger stellar objects LkHα 198-IR and LkHα 198-mm that are located in the vicinity of LkHα 198. The fitting of the mm part of the SED reveal that the grains in the mid-plane of the disks around BD+61154, RR Tau, and VY Mon have sizes of ~1–1000 μm. Therefore, grains have not grown to centimetre sizes in these disks yet.
Conclusions. These massive (M∗ > 3 M⊙) and young (~1 Myr) HAe stars are surrounded by massive (≳ 0.04 M⊙) disks with grains of micron-millimetre sizes. Although grain growth is proceeding in these disks, their evolutionary stage is prior to the formation of planetesimals. These disks are less evolved than those detected around T Tauri and Herbig Be stars.
Key words: stars: individual: BD+61154 / stars: individual: RR Tau / stars: pre-main sequence / stars: individual: VY Mon / protoplanetary disks / stars: individual: LkHα198
Based on observations carried out with the IRAM Plateau de Bure Interferometer. IRAM is supported by INSU/CNRS (France), MPG (Germany), and IGN (Spain).
The data used for the maps of Fig. 1 (FITS files) are only available at the CDS via anonymous ftp to cdsarc.u-strasbg.fr (130.79.128.5) or via http://cdsarc.u-strasbg.fr/viz-bin/qcat?J/A+A/531/A50
© ESO, 2011
1. Introduction
HAeBe stars, pre-main sequence intermediate-mass objects (M∗ ~ 2–8 M⊙), share many characteristics with high-mass stars, such as clustering and the presence of photo dissociation regions (PDR). HAeBe stars are, however, much closer to us and less embedded than higher mass stars, which makes the detection of circumstellar disks around these stars much more feasible and usefull for understanding the mechanisms of massive star formation in general. In addition, determining the lifetimes and disk dispersal mechanisms of circumstellar disks is important for planet formation studies. Disk lifetimes set an upper limit on the time available for the assembly of planetary systems. Determining the details of the gas and dust dispersal is necessary to establish the inital conditions for planet formation.
We are carrying out a comprehensive search for circumstellar disks around HAeBe stars using the IRAM Plateau de Bure Interferometer (PdBI). Our final goal is to investigate the properties of the disks around intermediate-mass stars to eventually determine their occurrence, lifetime, and evolution. We have completed the observations toward 11 HAeBe stars. The results corresponding to the first seven stars have already been published by Fuente et al. (2003, 2006), Alonso-Albi et al. (2008), and Alonso-Albi et al. (2009), which will be referred to hereafter as Paper I. Four stars are presented in the present paper.
List of sources.
The first 7-star sample was mainly composed of Be stars in the upper end of the intermediate-mass stellar range (M∗ > 7 M⊙). Our results showed that the disks associated with these hot stars have masses a factor of 5–10 lower than the masses of the disks associated with Tauri (TT) stars. Since all these massive stars are very young, <1 Myr, we concluded that disk dispersal is significantly more rapid at higher stellar masses (> 7 M⊙) than in the lower mass stars. This result is also consistent with recent conclusions by Berné et al. (2009) based on PAHs emission from disks. They found that the PAH emission observed toward hot HBe stars (>7 M⊙) is associated with the nebula instead of the disk proving either the non-existence or the existence of smaller disks around these stars. Regarding the dust properties, our results proved there are large grain sizes (~1 cm) in the midplane of the disks associated with these massive, >7 M⊙, stars. If planet formation occurs in these stars, it should occur on timescales of a few 105 yr.
Several groups have been observing the disks associated with Herbig Ae stars in the last decade (Testi et al. 2003; Piétu et al. 2003, 2005, 2006; Hamidouche et al. 2006; Hamidouche 2010; Isella et al. 2007; Alonso-Albi et al. 2008; Chapillon et al. 2008; Banzatti et al. 2011). These stars have typical ages of a few Myr and stellar masses between 2 and 3 M⊙. Evidence of grain growth has been found in many of these disks (see e.g. Testi et al. 2003; Isella et al. 2007; Alonso-Albi et al. 2008; Banzatti et al. 2011). Thus far, there is no evidence of a different evolution from that of the disks around T Tauri stars (TTs). No correlation between the disk mass, the stellar mass, or the stellar age have been found in TTs and Herbig Ae stars (see e.g. Natta et al. 2007; Ricci et al. 2010a,b).
These observational results agree with recent photo-evaporation models Gorti & Hollenbach (2009) that predict that the disk lifetimes are similar for disks associated to stars with stellar masses in the range of 0.3−7 M⊙, but rapidly decline for stars of higher masses (Be stars). However, observational data are still very scarce, especially in the ~3–7 M⊙ stellar mass range where the change between one regime and the other occurs. We present continuum interferometric observations using the PdBI and the subsequent SED modelling of four sources in this stellar mass range. Our goal is to get some insight into the physical characteristics of the circumstellar disks around these stars that are in the borderline between Herbig Ae and Be stars.
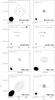 |
Fig. 1 Interferometric maps of the continuum emission of BD+61154, LkH α198, RR Tau, and VY Mon around ~3 mm (left panels) and ~1.3 mm (right panels) as observed with the Plateau de Bure interferometer. The exact observing wavelengths are indicated in the lower right corners. The level spacings (in units of map noise) are indicated in the upper left corners of the frames and were chosen according the signal-to-noise ratios of the detections (see Table 2 for the noise values). The synthesized beams are presented in the bottom left corners of the panels. The beam sizes and observing dates are given in Table 2. The measured fluxes (results of fits in the Fourier plane) are reported in Table 3. |
2. Observations
We carried out interferometric observations in the continuum at ~1.3 mm and ~3.0 mm toward the four stars listed in Table 1. These objects are HAeBe stars with stellar masses of ~3–7 M⊙ located at a distance of 600–800 pc from the Sun. All the sources were observed in 2008–2009 using the PdBI in different configurations. A summary of the observations is presented in Table 2, including dates, wavelengths, and beam sizes. The data reduction and analysis were performed using the GILDAS software package. The continuum maps presented in the following were built by summing all the channels free of line emission in the data. Natural weighting has been applied to the measured visibilities.
Plateau de Bure observations.
Results of the fits to the visibilities with uncertainties on the output parameters given in parenthesis.
3. Results
The observed ~1.3 mm and ~.0 mm continuum images are shown in Fig. 1. The original FITS files are available in electronic form at the CDS. We detected three out of the four targets observed with the PdBI. We measured the fluxes by fitting different source models to the visibilities in the Fourier plane (uv-plane). We selected the source models according to the signal-to-noise ratio (S/N) of the observations: point source for lower S/N, Gaussian distribution (circular or elliptical depending on the source) for higher S/N values. All the fit results (positions, fluxes and width for Gaussian fits) are reported in Table 3.
BD+61154 was previously observed with OVRO at 2.7 mm by Mannings and Sargent, who measured a flux of 11.2 mJy (quoted in the review by Natta et al. 2000). We measured a flux of 1.7 ± 0.3 mJy at 3.0 mm using the PdBI. This large difference in the flux is probably due to the different frequencies (a factor of 1.4 assuming a spectral index of 3) and to the higher angular resolution of our observations that filter out the extended emission. Wendker (1995) published a 1.3 mm continuum flux of 60 mJy based on single-dish observations carried out with the IRAM 30 m telescope in this same source. Our interferometric observations recovered ~50% of the continuum single-dish flux. These young stars are still embedded in the parent core and the single-dish emission is frequently dominated by the emission from the envelope (see Paper I). According to our fit of the ~1.3 mm data, the size of the emitting region is ~260 AU.
We did not detect any continuum emission toward LkHα 198 with an rms of 0.1 mJy/beam at 3.5 mm and 0.5 mJy/beam at 1.3 mm. Our upper limit to the ~3 mm continuum flux is a factor of 20 lower than obtained by di Francesco et al. (1997). Within the field of view of the LkHα 198 image, we detected two millimetre peaks that correspond to the mid-IR source LkHα 198-IR previously detected by Lagage et al. (1993) and the submillimetre protostar LkHα 198-mm detected by Sandell & Weintraub (1994). LkHα198-mm is located at the border of the primary beam at 1.3 mm, and for this reason, the flux is quite uncertain.
Our interferometric measurements toward RR Tau are the only ones at millimetre wavelengths. We detected a flux of 17.9 mJy at 1.3 mm and flux of 2.1 mJy at 3.5 mm and estimated the size of the emission region to ~720 AU from the 1.3 mm data.
Henning et al. (1998) measured a flux of 112 mJy for the dense core in VY Mon using the IRAM 30 m telescope. Our 1.3 mm PdBI observation gives a flux of 60.4 ± 1.4 mJy, therefore our interferometric observations filtered out about 50% of the core flux. Our 1.3 mm data suggest a size of ~980 AU for the emitting region in this source.
All the sizes derived above (~260 AU for BD+61154, ~720 AU for RR Tau, and ~980 AU for VY Mon) are typical of circumstellar disks around intermediate-mass stars. Although some emission from the envelope can be detected with our interferometric observations, the small source sizes confirm that the detected emission arises mainly from the disk. This interpretation is also reinforced by the SEDs we have constructed with our interferometric fluxes being well fitted, if assuming that all the emission detected in interferometry arises from the disk (envelope emission is negligible).
A fraction of the interferometric flux measured at ~ 1.3 mm and ~3.0 mm could come from the stellar wind emission instead of the dust thermal emission from the disk. We estimated the contribution of the free-free emission at millimetre wavelengths by extrapolating previous observations at centimetre wavelengths assuming the power-law Fν ∝ ν+0.6 (e.g. Olnon 1975). The spectral index, α = + 0.6, is expected for an optically thick isotropic wind. This value is fully consistent with those measured in Herbig Be stars using VLA observations by Alonso-Albi et al. (2008, 2009). It is also consistent, within the errors, with the values derived by Skinner et al. (1993) in most HAeBe stars, especially towards the most massive stars of their sample. Only in two cases, V645 Cyg and TY Cra, does the spectral index clearly differ from this value. The emission towards V645 Cyg was over-resolved and the derived spectal index was α ~ −0.2 ± 0.3. This value is consistent with optically thin free-free emission or with the emission from an HII region. In the case of TY Cra, a negative spectral index of −1.2 is found, as well as signs of variability pointing to a non-thermal emission mechanism (see also Lommen et al. 2009). Natta et al. (2004) found α ~ + 0.6 in HD 163296 and a value of ~0.0 for HD 35187. We consider that α ~ + 0.6 is a reasonable assumption when estimating the possible contribution of the gas continuum emission at millimetre wavelengths.
In Table 3, we show the millimetre spectral index derived from our data after subtracting the free-free emission when its contribution is not negligible. The millimetre spectral index is a good indicator of the grain sizes in the disk midplane. The values in Table 3 are higher than those found in the massive stars reported in Paper I, suggesting that the grain sizes are lower, so we are dealing with a class of less evolved disks.
4. Modelling the SED
We constructed the whole SED toward our sample by combining our PdB data with other results available in the literature and Spitzer photometry fluxes taken in the public archive. These source fluxes were extracted in a circular aperture of 10″ radius. Since these stars are bright, we took an off-source flux far away (~1′) from the source to avoid contamination. The off-source flux, containing zodiacal light and ISM contamination is subtracted to the on-source flux. The accuracy is about 10% for this method.
At optical and NIR wavelengths, observations are heavily affected by extinction. To correct this reddening we subtract the standard B − V colour corresponding to the spectral type of each star, as given by Johnson (1966), to the observed B − V colour. This colour excess E is used to calculate the visual extinction Av = RvE, by assuming a ratio of total to selective absorption Rv = 3.1 (Cardelli et al. 1989). With these two parameters we estimate the extinction corresponding to a particular observation using the parameterized extinction law of Cardelli et al. (1989), which can be applied to wavelengths between 0.12 and 3.5 μm. Most HAeBe stars are well known variable stars, a problem that becomes relevant in our case since we are using photometry recovered from the literature in the past few decades. The variability affects the B − V colour and produces some additional uncertainty in the extinction estimates. The disks have been fitted using the passive irradiated circumstellar disk model described by Alonso-Albi et al. (2008), which allows us to consider different grain populations for the midplane and surface layers. Grain populations are characterized by the silicate/graphite mixture, the maximum grain size (amax), and the slope of the grain size distribution (n). A standard grain mixture (SM: 86% silicate and 14% graphite) and a value of n = 3.5 are assumed for the midplane and surface layers. We allowed amax to vary between 0.1 μm and 1 cm in the midplane layer. Observations at millimetre and centimetre wavelengths are not sensitive to grains larger than a few centimetres. During the sedimentation process, large grains (> 1 mm) are expected to accumulate in the midplane, while the surface layer remains populated by smaller grains. For this reason, in the surface layer we only consider the values amax = 0.1, 1, 10, 100 μm. The gas-to-dust ratio is assumed to be 100. In addition to amax, we vary the inclination angle of the disk (i, in the range 10–80°), the rim temperature (Trim, in the range 1200–2000 K, the sublimation temperatures of silicates and graphite being 1500 and 2000 K, respectively) and the index of the density law (p, in the range –2.5–0). Finally, the disk outer radius (Rout) and dust mass (Mdisk) vary in ranges defined according to a first guess fit of the SED of the sources. These ranges are, respectively: 30–200 AU and 1.0 × 10⁻⁴–10.0 × 10⁻⁴ M⊙ for BD+6154; 30–150 AU and 2 × 10⁻⁴–32.0 × 10⁻⁴ M⊙ for RR Tau; 100–500 AU and 2.0 × 10⁻⁴–50.0 × 10⁻⁴ M⊙ for VY Mon.
The goodness of the fit is estimated with a dispersion parameter (χ) defined as 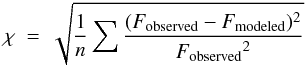 (1)where F is the flux and where the sum is extended for all detections in the SED from 3 μm and beyond, where n is the number of them (upper limits are not considered). Assuming that flux uncertainties are dominated by calibration errors, which we assume to be constant all over the SED (and of the order of 10%), this dispersion is proportional to the standard χ. The same dispersion definition was used in Paper I. We report the best-fit parameter set in Table 4, which corresponds to the minimum value of χ, for the three sources we detected with the PdBI. Table 4 contains as well the limits (Min and Max values) of the intervals within which χ is lower than ~ 1.3 χmin. They were calculated by varying each parameter separately while keeping all the others to their best-fit values.
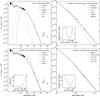 |
Fig. 2 a) The model fitted to the SED of BD+61154 with all the model contributions: interior layer (blue medium sized dashes), surface layer (red short and medium sized dashes), inner rim (pink dotted line), star (green short and large sized dashes), and total sum of previous contributions (black solid line). b) The SED changes when one varies the value of the maximum grain size in the interior layer (amax). The inset shows the projected dispersion curve (see Eq. (1) for the definition of the dispersion χ) when only amax varies, all other parameters being fixed at their best-fit values. c) The same as b), but varying the outer radius. d) The same as b), but varying the disk mass. The x axis of panels b) and d) has been reduced to λ > 100 μm, were the SED is more affected by a change of the parameters amax and disk mass, respectively. |
As Mdisk and amax affect only the fluxes in the FIR and mm ranges, where we only have a few measurements (sometimes only our two PdBI fluxes at ~1.3 mm and ~3.0 mm), their changes faintly affect the normalized dispersion as defined in Eq. (1). To enhance their impact, we estimated their Min and Max values considering only the restricted SED range of λ > 100 μm. Our fits are shown in Figs. 2 to 4. In the following we comment on the individual sources and the uncertainties in our estimates.
Disk models.
5. Individual sources
5.1. BD+61154
BD+61154 (also designated as MWC 419 or V594 Cas) has spectral type B8 (Herbig 1960), luminosity 330 L⊙ (Hillenbrand et al. 1992), and is at a distance of 650 pc (Hillenbrand et al. 1992). Testi et al. (1998) estimated an age of 0.1 Myr assuming Teff = 11 220 K and a luminosity of 300 L⊙. Later, Alonso-Albi et al. (2009) derived an age of 1.4 Myr adopting a lower value of the luminosity of 220 L⊙. This low value of the luminosity cannot fit the NIR part of the SED. We need a luminosity of ~300 L⊙ to fit the SED, which implies that the star is younger than 1 Myr (see Table 1).
Based on previous VLA observations published by Skinner et al. (1993), we estimated that the maximum contributions of the free-free emissions are 0.44 and 0.8 mJy at 3.0 and 1.1 mm respectively, which is negligible in comparison with the fluxes measured at the PdBI. Consequently, the free-free emission is not taken into account in the fit of the SED for BD+61154. In Fig. 2a we show our best fit to the SED of this star. The bump appearing in the SED between 1 and 4 microns is well reproduced assuming a rim temperature of 1800 K. The agreement between our model and observations is quite good and allows us to constrain some disk parameters. The best fit is obtained with an inclination of 70°, an outer radius of 50 AU and a density distribution slope of − 0.7. Our millimetric data constrain the dust disk mass to 3.5 × 10⁻⁴ M⊙ and the dust maximum grain size to 100 μm in the midplane layer. Within the errors, the radius of the disk obtained by fitting the SED of BD+61154 is consistent with the derived one from the fitting of the PdBI ~ 1.3 mm continuum emission (~125 AU), which reinforces our interpretation that the interferometric millimetre fluxes originate in the disk.
One has to keep in mind, however, that the outer radius is determined by the FIR part of the SED, and we have very few flux measurements in this region (see Fig. 2). Photometry in the 100–1000 μm wavelength range is necessary for a more accurate estimate of the outer radius.
5.2. RR Tau
RR Tau is a highly variable HAeBe star also classified as UVOR-type (The et al. 1994; Oudmaijer et al. 2001; Rodgers et al. 2002), making the estimate of its stellar parameters difficult. It has been classified between B8-A4 by different authors, with the most recent estimate as A2 (Hernández et al. 2004). Even more uncertain is its distance. Testi et al. (1998) give a value of 800 pc. Blondel & Djie (2006) modelled the UV spectra and derived a distance of 600 pc. More recently, Montesinos et al. (2009) modelled the SED at UV and NIR wavelengths and derived a distance of ~2100 pc. The authors discussed, however, that the obtained value is very dependent on the assumed extinction and the distance could be lower if a circumstellar disk blocks the stellar light. In this paper, we have adopted a distance of 800 pc and Teff = 9000 K that seems a good compromise considering the data in the literature. The values of disk mass and dust spectral index derived from our modelling do not strongly depend on the stellar effective temperature, provided it is between 8000 K and 10 000 K as expected for a B6-A4 star. The distance, however, has a strong impact on the disk mass estimate, because it scales as D2.
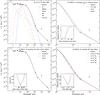 |
Fig. 4 Same figure as Fig. 2 for VY Mon. Note that in this case we also consider the free-free emission component (large grey dashes). |
Using a distance of 800 pc, we had a satisfactory fit of the SED. Given the upper limit on the continuum flux at 3.6 cm (Skinner et al. 1993) and the spectral index of +0.6 for the free-free emission, it could account for at most 0.3 mJy at 3.5 mm and 0.6 mJy at 1.3 mm, which would not change the SED fitting process significantly. Therefore, we did not include it in the fit. The bump appearing in the SED between 1 and 2 microns is reproduced well when assuming a rim temperature of 1200 K. The geometry of the disk is constrained by the mid infrared part of the SED, and the best agreement between our model and the observations is obtained for a disk outer radius of 80 AU, an inclination of 70° and a dust density slope p = −1.5. Our interferometric measurements at millimetre wavelengths are the only ones that are not upper limits above 500 μm. They allow us to estimate the dust mass of the disk, Mdust = 5 × 10⁻⁴ M⊙ and the maximum size of dust grains in the midplane, amax = 1000 μm. The measurements performed by IRAS and ISO around 200 μm are not used in our fit because given their large beams, the fluxes measured in these observations are likely dominated by the cloud emission. Assuming a standard gas-to-dust ratio of 100, the total dust + gas mass of the disk is 0.05 M⊙. The size of the disk as determined by fitting the SED is smaller than derived from the millimetre interferometric observations. The large dispersion of the flux measurements between 100 μm and 1000 μm cast some doubts about the accuracy of this estimate. On the other hand, the disk could have a complex geometry in the outer part that it is not described well by our simple model. The existence of spiral arms and rings are not unusual in HAeBe stars (AB Aur: Piétu et al. 2005; MWC297: Alonso-Albi et al. 2009)
5.3. VY Mon
VY Mon is a B8 star located at a distance of 800 pc. It is the most massive star in our sample. We have not been able to find a good fit for λ < 1 μm probably because the poorly known extinction and photospheric fluxes in this variable star. This, however, does not affect our fit to the disk since the stellar effective temperature and the distance are well known. The free-free emission that was detected at 6 cm by Wendker (1995) corresponds to a flux of 8.4 mJy at 3 mm after extrapolating with a 0.6 spectral index. This flux dominates the emission we observed with the Plateau de Bure. At 1 mm, the free-free emission contributes to 14.3 mJy, i.e. a third of the observed flux. Henning et al. (1998) imaged the region at 1.3 mm using the IRAM 30 m telescope. They derived the existence of an extended component of ~53″ × 49″ and a total flux of 0.25 Jy, and a compact component, < 13″ with a flux of 0.11 Jy. The ISO 200 μm flux and the SCUBA 850 μm fluxes are also expected to be dominated by the emission from the extended component. At wavelengths longer than 100 μm, we only consider the interferometric observations for our fit. Our millimetric data constrain the dust mass (0.004 M⊙) and the dust maximum grain size to 1 μm in the midplane and 0.1 μm in the surface of the disk. Assuming a standard gas-to-dust ratio of 100, the total dust + gas mass of the disk is 0.40 M⊙. The disk size derived from the SED fitting is consistent with that estimated from the 1.3 mm PdBI images.
Interferometric fluxes and masses for LkHα198 field sources.
5.4. LkHα 198
LkHα 198 (V* V633 Cas, IRAS 00087+5833) is a HAeBe star located at 600 pc (Chavarria-K. 1985). Hillenbrand et al. (1992) classified LkHα 198 as an A5 pre main-sequence star, while Hernández et al. (2004) find a spectral type of B9 ± 2.5.
A strong CO bipolar outflow is associated with this region. However it is not centred on LkHα 198, but is northwest of it (Canto et al. 1984; Bally & Lada 1983). A small cluster of intermediate-mass young stellar objects is surrounding LkHα 198. V376 Cas is another HAeBe star located about 40″ north of LkHα 198. An infrared companion (LkHα 198-IR) was detected ~ 6″ north of LkHα 198 by Lagage et al. (1993). A submillimetre source (LkHα 198-mm) was identified 19″ northwest of LkHα 198 by Sandell & Weintraub (1994). Hajjar & Bastien (2000) classified this source as an extreme Class I object. Extreme class I objects have been proposed by Lada (1991) to refer to early class I objects that are seen through an edge-on disk, thus explaining why they cannot be observed at NIR wavelengths. BIMA observations by Matthews et al. (2007) have revealed that the single-dish outflow detected by Canto et al. (1984) is indeed the combination of the several bipolar outflows associated with these stars. Evidence of bipolar outflows associated with V376 Cas and LkHα 198 have been found. One, even two outflows seem to be associated with LkHα 198, the most prominent in the CO emission with its axis in the northeast-southwest direction. A strong north-south outflow is associated with LkHα 198-mm. Although CO emission is detected toward LkHα 198-IR, there is no evidence of outflow in this IR source.
We did not detect any millimetre emission toward LkHα 198 at ~ 1.3 mm and ~ 3.0 mm. Intense emission is found, however, associated with LkHα 198-IR and LkHα 198-mm (see Fig. 1 and Table 5). We used our 3σ upper limit to the ~ 1.3 mm emission to derive an upper limit to the mass of the disk associated with this HAeBe star. This limit was calculated assuming optical thin emission at 1.3 mm, that is the usual case in disks around TT and Herbig Ae/Be stars, an average disk temperature of ~ 40 K in agreement with the predictions of Natta et al. (2000) for a B7 star, a dust opacity κ1.3 mm = 1.0 cm2 g-1, and a gas-to-dust ratio of 100. We found that the gas+dust mass of the disk associated with LkHα 198 is lower than 0.004 M⊙. Alternatively, we can have a small optically thick disk. In this case, our upper limit gives an upper limit to the disk size but does not say anything about its mass. Assuming that the disk average temperature is ~ 40 K, the radius of the disk should be < 9 AU to be consistent with our 3-σ upper limit to the 1.3 mm emission. LkHα 198-IR and LkHα 198-mm are two intermediate-mass young objects. LkHα 198-mm dominates the flux at 1 mm of the region and drives an energetic bipolar outflow. Therefore, the existence of a circumstellar disk is expected. LkHα 198-IR is supposed to be a more evolved object. The two sources have millimetre spectral indices ~ 2.4, consistent with the emission arising from a disk and with the values measured for BD+61154 and RR Tau. To derive the disk masses, we assumed temperatures ranging from 15–40 K for the dust, which are reasonable values for disk associated with HAe stars. We obtained that disk masses of 0.07–0.26 M⊙, 0.42–1.42 M⊙ for LkHα 198-IR, and LkHα 198-mm, respectively.
5.5. Uncertainties in the disk mass, maximum grain size, and disk outer radius
The assumptions made in the SED fitting process introduce some uncertainties in the values derived for the disk properties. The grain size distribution is usually taken to be n(a) = n0 × a − n for a < amax, where n0 is a normalization factor and amax is the maximum grain size. Experimental studies of fragmentation find that the value of n could vary between 1.9 for low-velocity collisions, and 4 for catastrophic impacts (Davis & Ryan 1990).
Tanaka et al. (1996) argue that the standard n = 3.5 power law is a very general result that only depends on the assumption that the fragmentation process is self-similar and that the collision rate varies as a2. Simulations by Tanaka et al. (2005) of particle growth in stratified protoplanetary disks give vertically integrated size distributions that at late times are described well by a power law n = 3.0 for a < amax, plus a population of much larger bodies. The 1.3 mm/2.7 mm spectral index is considered a good indicator of the grain properties. In the Rayleigh-Jeans region of the spectrum, the dust emission is proportional to ν(2 + β) where β is the opacity index that can be accurately derived by fitting the observed SED. The value of β in the submillimetre and millimetre ranges is an excellent indicator of the grain size distribution (Draine 2006). There is some degeneracy between the index of the grain size distribution, n, and the value of the maximum grain size, amax. An index of n = 2.5 means that a larger number of grains are closer to the maximum grain size than for a more typical value of 3.5. By assuming n = 2.5 we would reach the same values of β with grains slightly smaller. However, as previously discussed by several authors (see e.g. Alonso-Albi et al. 2008; Ricci et al. 2010b), for reasonable values of n, grain with sizes larger than few millimetres are needed to have values of β lower than 1, as is the case for RR Tau.
The dust composition in the midplane cannot be inferred from the SED. For this reason, we assumed the standard mixture. The silicate feature at ~9.8 μm provides, however, some information about the dust composition in the surface layer. In all of our sources, the silicate feature is present and can be fitted with the standard mixture. The absence of this feature, however, does not imply the absence of silicate grains but the lack of silicate grains at a temperature of ~800 K. The silicate grains could be either too far from the central source and thus not heated to temperatures high enough to allow emission in the mid-IR, or these grains could be too large to be heated efficiently. The dust composition and maximum grain size in the midplane determine the value of dust emissivity at 1.3 mm, κ1.3 mm, and consequently influences the derived dust mass. In Fig. 5 we show the value of κ1.3 mm as a function of amax for different values of n and different grain compositions. For values of amax in the range 1 mm–1 cm, all grain compositions and grain size distributions result in values of κ1.3 mm that are within a factor of 2–3 in agreement with the canonial value, 1 g-1 cm2. For smaller grains, κ1.3 mm has a stronger dependence on the grain composition and size distribution. The variation reaches at most a factor of 10.
The outer radii calculated from the SED tend to be smaller than those derived from the interferometric data fitting procedure. In the case of BD+61154 and VY Mon, the difference is within the modelling uncertainties, and the results of our models are consistent with the observations. In the case of RR Tau, the outer radius calculated from the SED is definitely smaller. In the SED modelling we assume a surface density power law truncated at the outer radius. Several authors have proposed a more realistic surface density distribution with a tapered exponential edge. This kind of surface density distribution gives smaller outer radii, making it less consistent with our observations (Hughes et al. 2008). As discussed in Sect. 5.2, the large size measured by our interferometric observations in RR Tau is likely due to a more complex geometry of the outer part of the disk, with the possible contribution of a tiny envelope or some other extended structure such as a secondary ring or spiral arms. Resolved images are required for a definitive answer.
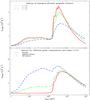 |
Fig. 5 Dust opacity at 1.3 mm as a function of the maximum grain size, amax, for different values of the grain size distribution slope, n (top) and for different dust compositions (bottom). |
6. Discussion
We present interferometric data on four HAeBe stars with stellar masses in the range 3–7 M⊙ and ages ~ 1 Myr. All of them except LkHα 198 have been detected, and our SED modelling reveals that they are surrounded by massive disks (masses of about 0.03–0.4 M⊙). Grains in these disks have grown only to sizes of ~ μm–mm. Although grain growth is proceeding in these disks, their evolutionary stage is prior to the formation of planetesimals. One possibility for explaining the lack of disk detection in LkHα 198 is that the age of this star is wrong because of the uncertain spectral type. Testi et al. (1998) estimated an age of 10 Myr assuming a spectral type of A4. If the star is older, most of the disk material could have been already dispersed by the star. Another possibility is that the differences are due to the vicinity of young protostars. The UV radiation and bipolar outflows associated with these YSOs could have truncated the disk.
Interferometric observations in Herbig Ae/Be stars
6.1. Correlation of the disk parameters with the stellar parameters.
To investigate the possible dependence of the disk mass on the stellar mass and age, we updated our previous compilation of disks (Table A.13 in Paper I). It is important to calculate the disk masses in a uniform way. As in Paper I, we calculated all disk masses, including our own sample, by assuming optically thin emission at millimetre wavelengths, an average disk temperature that depends on the stellar spectral type (Natta et al. 2000), a dust opacity κ1.3 mm = 1.0 cm2 g-1, and a dust spectral index β = 1.0 in case we do not have ~1.3 mm observations. We subtracted the free-free contribution in the sources previously studied by our team (this work; Fuente et al. 2003, 2006; Alonso-Albi et al. 2008, 2009)
In Fig. 6a, we represent the total disk masses (gas+dust) as a function of the stellar mass assuming a gas-to-dust ratio of 100. We only show in the plot the detections and the meaningful upper limits (disk masses < 0.04 M⊙). For stars with masses of < 3 M⊙, there is a cloud of points around a mean value of ~ 0.04 M⊙. Stars with masses of 3–7 M⊙ usually have massive disks (> 0.04 M⊙). But there are three stars without disk detections and with upper limits to the disk masses of < 0.01 M⊙. In this range of stellar masses, most of the detections come from this work and correspond to young stars. This could bias our statistics to higher disk masses. We need to complete our sample with older Ae stars to have a more realistic view of the disk evolution and determine the disk lifetimes in this stellar mass range. Most massive stars (> 7 M⊙) usually have disk masses < 0.04 M⊙, consistent with a more rapid disk dispersal, as we concluded in Paper I.
It seems established that disk masses depend on the stellar mass because it determines the photoevaporation efficiency and consequently, the disk lifetime. Disk masses should also depend on the the stellar age because the star is expected to progressively disperse the gas and dust in the disk. In Fig. 6b we plot the total disk masses as a function of the stellar ages. Massive stars (> 7 M⊙) are not included in this plot because it is not possible to have a reliable estimate of their age. We do not find any correlation between the disk masses and the stellar ages. The first reason for this lack of correlation is that the star evolution strongly depends on the stellar mass. Massive stars evolves more rapidly than the lower mass ones. We need to separate the stars in different ranges of stellar masses to have a meaningful plot. To investigate this effect, we represented different ranges of stellar masses with different colours in Fig. 6b. But even when separating the stars in different ranges of stellar masses, we do not find any obvious correlation. The first problem is that there are very few stars in each stellar mass range, especially in the 3–7 M⊙ range in which we only have nine objects. Another problem is that the estimates of the stellar ages are very uncertain. We have discussed the large uncertainties in the ages of BD+61154 and LkHα 198. The uncertainty in the ages of some stars is similar to the whole dynamic range of stellar ages. Finally, the environment also influences the disk dispersal. Disks in clusters seem to be less massive and scarcer than those around isolated stars (see e.g. Mann & Williams 2010). The only way to investigate the influence of all these factors in the evolution of the disks around HAe stars is to have more accurate estimates of the stellar ages and observe a large sample of disks that allow us to separate the sample in different bins and make statistics in each individual bin.
 |
Fig. 6 a) Disk mass as a function of the stellar mass. The points are taken from the compilation of Paper I, updated with the data presented in this work and the PV Cep and V892 data published by Hamidouche (2010). Dashed line corresponds to ~0.04 M⊙, the mean value of the disk mass for stars of < 3 M⊙. Solid contours indicate stars with masses of 3 M⊙ and 7 M⊙. Different colours correspond to different ranges of stellar masses: from 1 to 3 M⊙ (black), from 3 to 7 M⊙ (blue) and > 7 M⊙ (red). b) Disk mass as a function of the age of the star for the same disks. c) The ~1.3 mm/~3.0 mm spectral index as a function of the disk mass. Only disks with interferometric data at ~1.3 mm and ~3.0 mm are considered (Table 6). |
6.2. Correlation between grain growth and disk masses
Since it is very difficult to find a correlation between the disk properties and the stellar properties, we have tried to investigate the disk evolution by correlating two disk parameters, in particular the 1.3 mm/2.7 mm spectral index and the disk mass. The 1.3 mm/2.7 mm spectral index is a grain-growth tracer and can be understood as an evolutionary indicator. Acke et al. (2004) deduced from the FIR and submillimetre SED that the dust spectral index β depends on the disk geometry (flared or flat disks). More recently, Sandell et al. (2011) also found a correlation between the dust spectral index and the circumstellar mass measured on SCUBA maps. Although this result is encouraging, it is based on single-dish observations in which the disk and the envelope contributions are mixed and from which the disk properties cannot be derived. We compiled interferometric observations of disks associated to Herbig Ae/Be stars. Only the sources with interferometric measurements at both ~ 3 mm and ~1.3 mm are considered. In the case of CQ Tau, several measurements are available in the literature, and we used the fluxes measured by Chapillon et al. (2008). More recent measurements by Banzatti et al. (2011) resolve the disk and are not adequate for our statistical study of global properties.
In Fig. 6c we show the millimetric spectral index as a function of the disk mass (calculated as explained in Sect. 6.1). Disk with masses higher than 0.1 M⊙ present a spectral index greater than 3, similar to those found in protostellar envelopes; however, one should keep in mind that in these cases the assumed dust opacity of 1 cm2 g-1 at 1.3 mm could be wrong, and the real value is expected to be closer to ~0.5 cm2 g-1. With this value, the estimated disk masses would be a factor of 2 higher. Spectral indices lower than 2 are associated with disks with low masses (<0.01 M⊙). In these cases, centimetre-sized grains have grown in the midplane and their emissivity is lowerer than the canonical value. The disk mass could thus be underestimated as well. Disk masses in our sample range from 0.003 to 1.14 M⊙, i.e. a factor of 380. Considering that at most a factor of 10 comes from the unknown grain properties (see Sect. 5.5), the range in our disk masses would be over 40. Under the reasonable assumption that the gradient in the disk mass is due to an evolutionary trend with the most evolved objects with the lower disk mass, this means that only <2.5% of the inital mass in dust grains will build up large grains. Another possibility is that a significant fraction of the dust mass is locked in large grains (>1 cm) that are not detectable in our observations.
6.3. Comparison with TTs and Be stars
There is a wealth of evidence of grain growth in disks associated with TTs. Ricci et al. (2010a,b) have studied grain growth in a large sample of disks in the Taurus and ρ Ophiucus star-forming regions. They found that the value of β is quite constant with average value of 0.46. From their results, there is not correlation between the dust spectral index and the stellar parameters (mass, age). Although the stars in the Taurus region are older, the stellar ages in the ρ Ophiucus sample are similar to the stars in our Herbig Ae sample. The characteristics found in the disks presented here are also very different from those observed in the disks around HBe (≳ 7 M⊙) stars (see Paper I). Although the stars presented in this paper are older than the HBe stars presented in Paper I, their disks have higher masses, and the grains in the midplane have not reached centimetre sizes yet.
Dust coagulation models predict that grains grow to centimetre sizes on timescales of 104 yr (Zsom et al. 2010). As particles grow, the velocity of the particles increases and the fragmentation becomes more efficient. At some point, the steady state is reached and grain growth ceases. The maximum size of the grains in the steady state depends on the physical conditions of gas and dust (mainly the gas surface density), the turbulent velocity, and the disk temperature (see Birnstiel et al. 2010, 2011, for a comprehensive study). The maximum grain size, amax, increases with the gas surface density and turbulent velocity, but decreases with the disk temperature. Disks around HAe stars are warmer than those around TTs. This could explain the larger grain sizes in TTs. Unless we assume that the turbulent velocity is higher in the disks around Be stars, the larger grain sizes in their circumstellar disks are more difficult to explain.
Another possibility is that the steady state is not adequate for the studied stars. The stars in our sample are very young with a high accretion rate. Manoj et al. (2006) show that accretion in HAe stars decreases substantially at about 3 Myr. Accretion could change the grain size distribution resulting in an enrichment in small grains. Photo-evaporation could also affect the grain size distribution, especially in Be stars where the UV radiation is more intense. Gas and small grains are moving away from the disk surface at radii larger than the gravitational radius. Radial drifts of large particles are not considered in these steady state models either.
7. Summary and conclusions
We completed our survey of disks around HAeBe stars by imaging the continuum emission at ~ 3 mm and ~ 1.3 mm toward BD+61154, RR Tau, VY Mon, and LkHα 198 using the Plateau de Bure Interferometer. We detected the disks associated with BD+61154, RR Tau, and VY Mon with disk masses of 0.035 M⊙, 0.05 M⊙, and 0.40 M⊙, respectively. The disk around LkHα 198 was not detected with an upper limit on the disk mass of 0.004 M⊙. The modelling of the SEDs shows that the grains in the mid-plane of the disks around BD+61154, RR Tau and VY Mon have sizes of ~ 100, 1000 and 1 μm respectively. These massive disks are in the phase prior to the formation of protoplanets. Their grains are smaller than those found around TTs and young HBe stars.
Acknowledgments
We are grateful to the IRAM staff in Grenoble (France) for their great help during the observations and data reduction. This paper was partially supported within the programme CONSOLIDER INGENIO 2010, under grant “Molecular Astrophysics: The Herschel and ALMA Era – ASTROMOL” (Ref.: CSD2009-00038). The research leading to these results received funding from the European Community’s Seventh Framework Programme (FP7/2007–2013) under grant agreement No. 229517
References
- Acke, B., van den Ancker, M. E., Dullemond, C. P., van Boekel, R., & Waters, L. B. F. M. 2004, A&A, 422, 621 [NASA ADS] [CrossRef] [EDP Sciences] [Google Scholar]
- Alonso-Albi, T., Fuente, A., Bachiller, R., et al. 2008, ApJ, 680, 1289 [NASA ADS] [CrossRef] [Google Scholar]
- Alonso-Albi, T., Fuente, A., Bachiller, R., et al. 2009, A&A, 497, 117 [NASA ADS] [CrossRef] [EDP Sciences] [Google Scholar]
- Bally, J., & Lada, C. J. 1983, ApJ, 265, 824 [NASA ADS] [CrossRef] [Google Scholar]
- Banzatti, A., Testi, L., Isella, A., et al. 2011, A&A, 525, A12 [NASA ADS] [CrossRef] [EDP Sciences] [Google Scholar]
- Berné, O., Joblin, C., Fuente, A., & Ménard, F. 2009, A&A, 495, 827 [NASA ADS] [CrossRef] [EDP Sciences] [Google Scholar]
- Birnstiel, T., Dullemond, C. P., & Brauer, F. 2010, A&A, 513, A79 [NASA ADS] [CrossRef] [EDP Sciences] [Google Scholar]
- Birnstiel, T., Ormel, C. W., & Dullemond, C. P. 2011, A&A, 525, A11 [NASA ADS] [CrossRef] [EDP Sciences] [Google Scholar]
- Blondel, P. F. C., & Djie, H. R. E. T. A. 2006, A&A, 456, 1045 [NASA ADS] [CrossRef] [EDP Sciences] [Google Scholar]
- Canto, J., Rodriguez, L. F., Calvet, N., & Levreault, R. M. 1984, ApJ, 282, 631 [NASA ADS] [CrossRef] [Google Scholar]
- Cardelli, J. A., Clayton, G. C., & Mathis, J. S. 1989, ApJ, 345, 245 [NASA ADS] [CrossRef] [Google Scholar]
- Chapillon, E., Guilloteau, S., Dutrey, A., & Piétu, V. 2008, A&A, 488, 565 [NASA ADS] [CrossRef] [EDP Sciences] [Google Scholar]
- Chavarria-K., C. 1985, A&A, 148, 317 [NASA ADS] [Google Scholar]
- Davis, D. R., & Ryan, E. V. 1990, Icarus, 83, 156 [NASA ADS] [CrossRef] [Google Scholar]
- di Francesco, J., Evans, II, N. J., Harvey, P. M., et al. 1997, ApJ, 482, 433 [NASA ADS] [CrossRef] [Google Scholar]
- Draine, B. T. 2006, ApJ, 636, 1114 [NASA ADS] [CrossRef] [Google Scholar]
- Fuente, A., Rodríguez-Franco, A., Testi, L., et al. 2003, ApJ, 598, L39 [NASA ADS] [CrossRef] [Google Scholar]
- Fuente, A., Alonso-Albi, T., Bachiller, R., et al. 2006, ApJ, 649, L119 [NASA ADS] [CrossRef] [Google Scholar]
- Gorti, U., & Hollenbach, D. 2009, ApJ, 690, 1539 [Google Scholar]
- Hajjar, R., & Bastien, P. 2000, ApJ, 531, 494 [NASA ADS] [CrossRef] [Google Scholar]
- Hamidouche, M. 2010, ApJ, 722, 204 [NASA ADS] [CrossRef] [Google Scholar]
- Hamidouche, M., Looney, L. W., & Mundy, L. G. 2006, ApJ, 651, 321 [NASA ADS] [CrossRef] [Google Scholar]
- Henning, T., Burkert, A., Launhardt, R., Leinert, C., & Stecklum, B. 1998, A&A, 336, 565 [NASA ADS] [Google Scholar]
- Herbig, G. H. 1960, ApJS, 4, 337 [NASA ADS] [CrossRef] [Google Scholar]
- Hernández, J., Calvet, N., Briceño, C., Hartmann, L., & Berlind, P. 2004, AJ, 127, 1682 [NASA ADS] [CrossRef] [Google Scholar]
- Hillenbrand, L. A., Strom, S. E., Vrba, F. J., & Keene, J. 1992, ApJ, 397, 613 [NASA ADS] [CrossRef] [Google Scholar]
- Hughes, A. M., Wilner, D. J., Qi, C., & Hogerheijde, M. R. 2008, ApJ, 678, 1119 [NASA ADS] [CrossRef] [Google Scholar]
- Isella, A., Testi, L., Natta, A., et al. 2007, A&A, 469, 213 [CrossRef] [EDP Sciences] [Google Scholar]
- Johnson, H. L. 1966, ARA&A, 4, 193 [NASA ADS] [CrossRef] [Google Scholar]
- Lada, C. J. 1991, in The Physics of Star Formation and Early Stellar Evolution, ed. C. J. Lada, & N. D. Kylafis, NATO ASIC Proc., 342, 329 [Google Scholar]
- Lagage, P. O., Olofsson, G., Cabrit, S., et al. 1993, ApJ, 417, L79 [NASA ADS] [CrossRef] [Google Scholar]
- Lommen, D., Maddison, S. T., Wright, C. M., et al. 2009, A&A, 495, 869 [NASA ADS] [CrossRef] [EDP Sciences] [Google Scholar]
- Mann, R. K., & Williams, J. P. 2010, ApJ, 725, 430 [NASA ADS] [CrossRef] [Google Scholar]
- Mannings, V., & Sargent, A. I. 2000, ApJ, 529, 391 [NASA ADS] [CrossRef] [Google Scholar]
- Manoj, P., Bhatt, H. C., Maheswar, G., & Muneer, S. 2006, ApJ, 653, 657 [NASA ADS] [CrossRef] [Google Scholar]
- Manoj, P., Ho, P. T. P., Ohashi, N., et al. 2007, ApJ, 667, L187 [NASA ADS] [CrossRef] [Google Scholar]
- Matthews, B. C., Graham, J. R., Perrin, M. D., & Kalas, P. 2007, ApJ, 671, 483 [NASA ADS] [CrossRef] [Google Scholar]
- Montesinos, B., Eiroa, C., Mora, A., & Merín, B. 2009, A&A, 495, 901 [NASA ADS] [CrossRef] [EDP Sciences] [Google Scholar]
- Natta, A., Grinin, V., & Mannings, V. 2000, Protostars and Planets IV, 559 [Google Scholar]
- Natta, A., Prusti, T., Neri, R., et al. 2001, A&A, 371, 186 [NASA ADS] [CrossRef] [EDP Sciences] [Google Scholar]
- Natta, A., Testi, L., Neri, R., Shepherd, D. S., & Wilner, D. J. 2004, A&A, 416, 179 [NASA ADS] [CrossRef] [EDP Sciences] [Google Scholar]
- Natta, A., Testi, L., Calvet, N., et al. 2007, Protostars and Planets V, 767 [Google Scholar]
- Olnon, F. M. 1975, A&A, 39, 217 [NASA ADS] [Google Scholar]
- Oudmaijer, R. D., Palacios, J., Eiroa, C., et al. 2001, A&A, 379, 564 [NASA ADS] [CrossRef] [EDP Sciences] [Google Scholar]
- Piétu, V., Dutrey, A., & Kahane, C. 2003, A&A, 398, 565 [NASA ADS] [CrossRef] [EDP Sciences] [Google Scholar]
- Piétu, V., Guilloteau, S., & Dutrey, A. 2005, A&A, 443, 945 [NASA ADS] [CrossRef] [EDP Sciences] [Google Scholar]
- Piétu, V., Dutrey, A., Guilloteau, S., Chapillon, E., & Pety, J. 2006, A&A, 460, L43 [NASA ADS] [CrossRef] [EDP Sciences] [Google Scholar]
- Ricci, L., Testi, L., Natta, A., & Brooks, K. J. 2010a, A&A, 521, A66 [NASA ADS] [CrossRef] [EDP Sciences] [Google Scholar]
- Ricci, L., Testi, L., Natta, A., et al. 2010b, A&A, 512, A15 [NASA ADS] [CrossRef] [EDP Sciences] [Google Scholar]
- Rodgers, B., Wooden, D. H., Grinin, V., Shakhovsky, D., & Natta, A. 2002, ApJ, 564, 405 [NASA ADS] [CrossRef] [Google Scholar]
- Sandell, G., & Weintraub, D. A. 1994, A&A, 292, L1 [NASA ADS] [Google Scholar]
- Sandell, G., Weintraub, D. A., & Hamidouche, M. 2011, ApJ, 727, 26 [NASA ADS] [CrossRef] [Google Scholar]
- Skinner, S. L., Brown, A., & Stewart, R. T. 1993, ApJS, 87, 217 [NASA ADS] [CrossRef] [Google Scholar]
- Tanaka, H., Inaba, S., & Nakazawa, K. 1996, Icarus, 123, 450 [Google Scholar]
- Tanaka, H., Himeno, Y., & Ida, S. 2005, ApJ, 625, 414 [NASA ADS] [CrossRef] [Google Scholar]
- Testi, L., Palla, F., & Natta, A. 1998, A&AS, 133, 81 [NASA ADS] [CrossRef] [EDP Sciences] [Google Scholar]
- Testi, L., Natta, A., Shepherd, D. S., & Wilner, D. J. 2003, A&A, 403, 323 [NASA ADS] [CrossRef] [EDP Sciences] [Google Scholar]
- The, P. S., de Winter, D., & Perez, M. R. 1994, A&AS, 104, 315 [NASA ADS] [Google Scholar]
- Wendker, H. J. 1995, A&AS, 109, 177 [NASA ADS] [Google Scholar]
- Zsom, A., Ormel, C. W., Güttler, C., Blum, J., & Dullemond, C. P. 2010, A&A, 513, A57 [NASA ADS] [CrossRef] [EDP Sciences] [Google Scholar]
All Tables
Results of the fits to the visibilities with uncertainties on the output parameters given in parenthesis.
All Figures
|
Fig. 1 Interferometric maps of the continuum emission of BD+61154, LkH α198, RR Tau, and VY Mon around ~3 mm (left panels) and ~1.3 mm (right panels) as observed with the Plateau de Bure interferometer. The exact observing wavelengths are indicated in the lower right corners. The level spacings (in units of map noise) are indicated in the upper left corners of the frames and were chosen according the signal-to-noise ratios of the detections (see Table 2 for the noise values). The synthesized beams are presented in the bottom left corners of the panels. The beam sizes and observing dates are given in Table 2. The measured fluxes (results of fits in the Fourier plane) are reported in Table 3. |
| In the text | |
|
Fig. 2 a) The model fitted to the SED of BD+61154 with all the model contributions: interior layer (blue medium sized dashes), surface layer (red short and medium sized dashes), inner rim (pink dotted line), star (green short and large sized dashes), and total sum of previous contributions (black solid line). b) The SED changes when one varies the value of the maximum grain size in the interior layer (amax). The inset shows the projected dispersion curve (see Eq. (1) for the definition of the dispersion χ) when only amax varies, all other parameters being fixed at their best-fit values. c) The same as b), but varying the outer radius. d) The same as b), but varying the disk mass. The x axis of panels b) and d) has been reduced to λ > 100 μm, were the SED is more affected by a change of the parameters amax and disk mass, respectively. |
| In the text | |
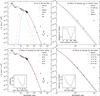 |
Fig. 3 Same figure as Fig. 2 for RR Tau. |
| In the text | |
|
Fig. 4 Same figure as Fig. 2 for VY Mon. Note that in this case we also consider the free-free emission component (large grey dashes). |
| In the text | |
|
Fig. 5 Dust opacity at 1.3 mm as a function of the maximum grain size, amax, for different values of the grain size distribution slope, n (top) and for different dust compositions (bottom). |
| In the text | |
|
Fig. 6 a) Disk mass as a function of the stellar mass. The points are taken from the compilation of Paper I, updated with the data presented in this work and the PV Cep and V892 data published by Hamidouche (2010). Dashed line corresponds to ~0.04 M⊙, the mean value of the disk mass for stars of < 3 M⊙. Solid contours indicate stars with masses of 3 M⊙ and 7 M⊙. Different colours correspond to different ranges of stellar masses: from 1 to 3 M⊙ (black), from 3 to 7 M⊙ (blue) and > 7 M⊙ (red). b) Disk mass as a function of the age of the star for the same disks. c) The ~1.3 mm/~3.0 mm spectral index as a function of the disk mass. Only disks with interferometric data at ~1.3 mm and ~3.0 mm are considered (Table 6). |
| In the text | |
Current usage metrics show cumulative count of Article Views (full-text article views including HTML views, PDF and ePub downloads, according to the available data) and Abstracts Views on Vision4Press platform.
Data correspond to usage on the plateform after 2015. The current usage metrics is available 48-96 hours after online publication and is updated daily on week days.
Initial download of the metrics may take a while.