Fig. 1
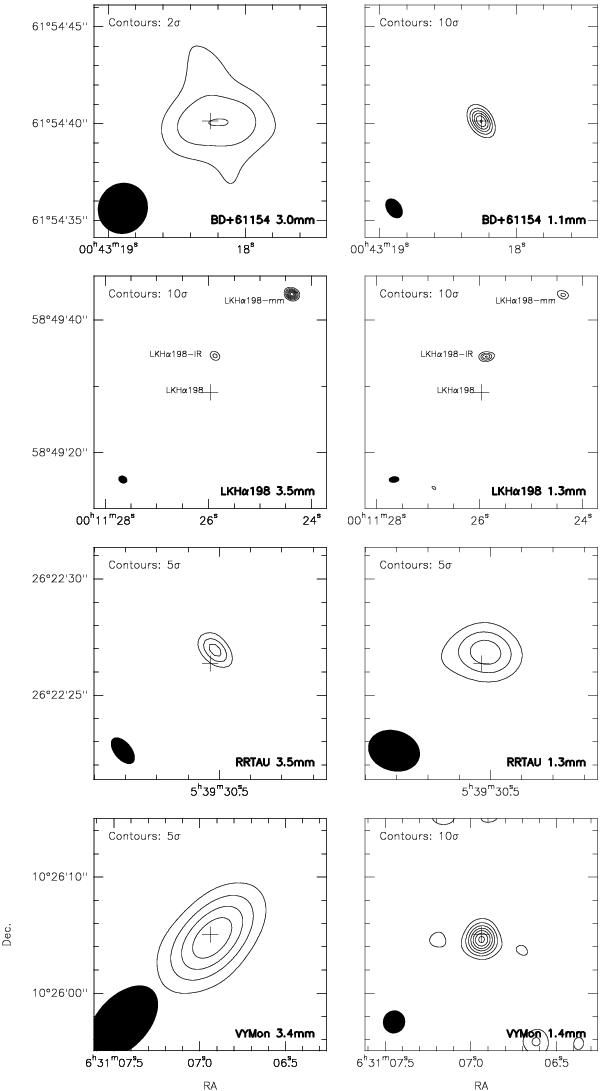
Interferometric maps of the continuum emission of BD+61154, LkH α198, RR Tau, and VY Mon around ~3 mm (left panels) and ~1.3 mm (right panels) as observed with the Plateau de Bure interferometer. The exact observing wavelengths are indicated in the lower right corners. The level spacings (in units of map noise) are indicated in the upper left corners of the frames and were chosen according the signal-to-noise ratios of the detections (see Table 2 for the noise values). The synthesized beams are presented in the bottom left corners of the panels. The beam sizes and observing dates are given in Table 2. The measured fluxes (results of fits in the Fourier plane) are reported in Table 3.
Current usage metrics show cumulative count of Article Views (full-text article views including HTML views, PDF and ePub downloads, according to the available data) and Abstracts Views on Vision4Press platform.
Data correspond to usage on the plateform after 2015. The current usage metrics is available 48-96 hours after online publication and is updated daily on week days.
Initial download of the metrics may take a while.