| Issue |
A&A
Volume 526, February 2011
|
|
|---|---|---|
| Article Number | A21 | |
| Number of page(s) | 34 | |
| Section | Galactic structure, stellar clusters, and populations | |
| DOI | https://doi.org/10.1051/0004-6361/201014732 | |
| Published online | 15 December 2010 | |
XMM-Newton investigations of the Lambda Orionis star-forming region (XILO)
I. The young cluster Collinder 69⋆
1
Calar Alto Observatory, Centro Astronómico Hispano
Alemán, C/ Jesús Durbán
Remón, 04004
Almería,
Spain
e-mail: This email address is being protected from spambots. You need JavaScript enabled to view it.
2
Depto. Astrofísica, Centro de Astrobiología (INTA-CSIC), ESAC
campus, PO Box 78,
28691
Villanueva de la Cañada,
Spain
3
INAF – Osservatorio Astronomico di Palermo, Piazza del Parlamento
1, 90134
Palermo,
Italy
4
Spitzer Science Center, California Institute of
Technology, Pasadena,
CA
91125,
USA
5
European Southern Observatory, Alonso de Córdova 3107, Vitacura, Santiago, Chile
6
Institute of Astronomy, Madingley Road, Cambridge
CB3 0HA,
UK
7
European Space Agency (ESAC), PO Box 78, 28691
Villanueva de la Cañada (Madrid),
Spain
Received:
4
April
2010
Accepted:
25
September
2010
Abstract
Context. This is the first paper of a series devoted to the Lambda Orionis star-forming region, Orion’s Head, from the X-ray perspective. Our final aim is to provide a comprehensive view of this complex region, which includes several distinct associations and dark clouds.
Aims. We aim to uncover the population of the central, young star cluster Collinder 69, and in particular those diskless Class III objects not identified by previous surveys based on near- and mid-infrared searches, and to establish the X-ray luminosity function for the association.
Methods. We have combined two exposures taken with the XMM-Newton satellite with an exhaustive data set of optical, near- and mid-infrared photometry to assess the membership of the X-ray sources based on different color–color and color–magnitude diagrams, as well as other properties, such as effective temperatures, masses and bolometric luminosities derived from spectral energy distribution fitting and comparison with theoretical isochrones. The presence of circumstellar disks is discussed using mid-infrared photometry from the Spitzer Space Telescope.
Results. With an X-ray flux limit of ~5 × 10-15 erg/cm2/s we detected a total of 164 X-ray sources, of which 66 are probable and possible cluster members. A total of 16 are newly identified probable members plus another three possible new members. The two XMM-Newton pointings east and west of the cluster center have allowed us to verify the heterogeneous spatial distribution of young stars, which is probably related to the large scale structure of the region. The disk fraction of the X-ray detected cluster sample (complete down to ~0.3 M⊙) is very low, close to 10%, in remarkable contrast to the low-mass stellar and substellar population (mostly undetected in X-rays) where the disk fraction reaches about 50%. The X-ray luminosity function of Collinder 69 in different mass bins provides support for an age of several Myr when compared with other well known young associations.
Conclusions. The X-ray properties of the young stars in Collinder 69 resemble those found in other young stellar associations, with saturation at log (Lx/Lbol) ~ −3 and low fractional X-ray luminosities for stars with M ≥ 2 M⊙. With our improved cluster census we confirm previous reports on the untypically low disk fraction compared to other clusters of several Myr age. The different disk fractions of X-ray detected (essentially solar-like) and undetected (mostly low-mass stars and brown dwarfs) members can be understood as a consequence of a mass-dependence of the time-scale for disk evolution.
Key words: stars: coronae / stars: late-type / stars: solar-type / X-rays: stars / open clusters and associations: individual: Collinder 69 / stars: pre-main sequence
Tables 3–6, 8, 9 are only available in electronic form at http://www.aanda.org
© ESO, 2010
1. Introduction
This is the first paper of a series devoted to the Lambda Orionis star-forming region (hereafter LOSFR), a complex located at about 400 pc, as seen in X-ray (Murdin & Penston 1977). This region gives shape to the head of Orion, the legendary Hellenic hero, and includes several distinct zones at different evolutionary stages: from dark clouds with no obvious star formation (or at the very initial steps) toward the quasi circular boundary, to the full fledged λ Ori cluster, located at the center and about 5 Myr old (also called Collinder 69, the name we will use throughout this paper), and other structures in between, such as Barnard 30 and Barnard 35.
Observing log for the XMM-Newton observations of Collinder 69.
We carried out several surveys at different wavelengths in the past, from the optical to the submillimeter. The main goal of these studies was to characterize the population of low-mass stars and brown dwarfs, obtain a stellar and substellar census, specially identifying members with disks using infrared (IR) excesses, and derive the initial mass function (IMF). Part of these results have been published by Barrado y Navascués et al. (2004b, 2007); Morales-Calderón (2008) and Bayo (2009) – their Ph.D. dissertations, which include the multi-wavelength search and spectroscopic characterization, respectively; and Bouy et al. (2009). Additional analyses are forthcoming.
When searching for members of star-forming regions, optical surveys are usually not very efficient, because the internal reddening caused by the inhomogeneous dust (and gas) absorbs a significant amount of light. On the one hand, near- and mid-infrared searches, such as the one we have conducted with the Spitzer Space Telescope, avoid this problem to a large extent. However, they are biased and identify primarily objects with IR excess emission over the stellar photosphere, either Class 0/I, characterized by the presence of an envelope and increasing fluxes toward longer wavelengths or Class II (classical TTauri stars), with an actively accreting circumstellar disk and a spectral energy distribution (SED) with a significant departure from the black-body shape, following the evolutionary classification scheme (Lada 1987; Adams et al. 1987).
With the main goal of unveiling the Class III population in the LOSFR (i.e., weak-line TTauri stars, diskless young stars or those with transition disks), we have conducted an X-ray survey with the XMM-Newton observatory. X-rays are as efficient as near-IR photometry piercing a dark cloud, and they allow to detect coronal activity, which is known to be very strong in young late-type stars regardless of the presence or absence of circumstellar material (Feigelson & Montmerle 1999). Our project, the XMM-Newton Investigations of the Lambda Orionis Star-Forming Region (XILO), concentrates on crucial star formation sites within the LOSFR and so far comprises eight XMM-Newton pointings. We present here the results related to the central cluster, Collinder 69. We combine the XMM-Newton data with the existing multi-wavelength database. The analysis of the XMM-Newton data is described in Sect. 2. The master catalog of Collinder 69 obtained from combining X-ray, optical, and IR data is introduced in Sect. 3. In Sect. 4 we explain how we select cluster candidates from this list. Section 5 deals with the properties of the selected cluster members, and Sect. 6 summarizes the findings of this paper.
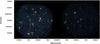 |
Fig. 1 Merged images of XMM-Newton’s EPIC pn, MOS 1 and MOS 2 for Collinder 69 eastern and western fields (Col 69 E and Col 69 W). |
2. Observations and data analysis
We obtained two XMM-Newton observations of Collinder 69. The observations were centered east and west of λ Ori, a massive bright O8 III star (see Fig. 1). Henceforth we refer to these two XMM-Newton exposures as Col 69 E and Col 69 W.
The prime instrument EPIC (European Photon Imaging Camera; see Jansen et al. 2001; Turner et al. 2001; and Strüder et al. 2001) was operated in full-frame mode. The Optical Monitor (OM, Mason et al. 2001) was scheduled for several consecutive imaging exposures in the V and B bands. The observing log for both pointings is given in Table 1.
2.1. EPIC
Both observations were analyzed with the XMM-Newton Science Analysis System (SAS) pipeline, version 7.0.0. We created a photon events list with the metatasks epchain and emchain for EPIC/pn and EPIC/MOS respectively. There was some loss of observing time because of high background. We selected good time intervals (GTIs) using a filter that cuts out times of high background, maximizing the overall signal-to-noise. The C 69 E field is almost unaffected, but for C 69 W the useful time was reduced to about half the nominal exposure time given in Table 1. The data were further filtered for pixel patterns, and events at the boundary of individual CCD chips or near bad pixels or those outside the field-of-view (FOV) were removed.
Images with a pixel size of 5′′ were binned from the cleaned events list. We performed source detection on the images in four energy bands using standard SAS tools. The most suitable boundaries of the energy bands depend on the spectral shape of the X-ray sources, which is not known a priori. We have tested various bounds for the energy bands, and after inspection of the results from source detection made the following choice for the soft (S), medium (M), hard (H) and broad (B) bands: S = 0.5−1.0 keV, M = 1.0−2.0 keV, H = 2.0−7.3 keV, and B = S + M + H.
For the source detection process we proceeded in two steps. First, all EPIC detectors were analyzed separately as described above. To evaluate the relative sensitivity of the detectors we computed the ratio of count rates measured by EPIC/pn and EPIC/MOS, (Cpn/CMOS)i with i = S,M,H,B, separately for each energy band, for bright sources detected with all three instruments. The median of these values were used to scale the exposure maps of EPIC/pn for the joint analysis of all three instruments. The merged observation is then equivalent to an effective MOS exposure of duration (Cpn/CMOS)i·tpn + tM1 + tM2, where tpn,tM1,tM2 are the individual exposure times of pn, MOS 1, and MOS 2.
Our final X-ray catalog contains all sources detected in the merged data (“EPIC sources”), plus all sources detected in the individual instruments that are not within 10′′ of an EPIC source. Detection in one detector but not in the combined data may occur, e.g. if the source is located outside the FOV, near a chip gap, or in a region of low exposure (such as a bad column) in one or more of the instruments. We selected a detection threshold of ML ≥ 15. This yields 112 sources in the merged EPIC data of C 69 E and 52 sources for C 69 W. The X-ray coordinates of the final source list have been cross-correlated with the 2 MASS catalog (Cutri et al. 2003), and a boresight correction was computed as the median of the astrometric offsets in RA and Dec. Tables 3 and 4 summarize the X-ray detections from both fields and their X-ray parameters (corrected X-ray position and statistical positional error, off-axis angle, maximum likelihood of source detection, broadband count rate, and hardness ratios). We define hardness ratios as (B1 − B2)/(B1 + B2) where B1 and B2 can be different combinations of S, M, and H. The hardness ratios listed in Tables 3 and 4 are HR1 = (M − S)/(M + S) and HR2 = (H + M − S)/(H + M + S). The merged EPIC/pn+MOS images are shown in Fig. 1.
To examine the conditions in the X-ray emitting plasma, we performed a spectral analysis
within XSPEC version 12.4. The spectra were grouped depending on the number of counts,
with a minimum of 5 counts per bin for sources with less than 100 counts. For each X-ray
source we used the instrument listed in Col. 2 of Tables 3 and 4. Both one- and two-temperature
thermal model fits (APEC) with photo-absorption (wabs) were tested,
starting the fitting process from a range of initial parameters and selecting for each
model as best fit the result with the minimum χ2. X-ray
temperature(s), absorbing column NH, and normalization(s) were
free fit parameters, while the global abundances were fixed at 0.3 times the solar value.
We chose as final representation of the X-ray source between the 1-T and the 2-T model
based on the null probability  . Our first choice is the 1-T model.
Whenever P < 0.1 for the 1-T model, we resorted to the 2-T fit. The
results and the calculation of X-ray luminosities for possible cluster members is deferred
to Sect. 5.9 after the Collinder 69 bona fide sample
has been established.
. Our first choice is the 1-T model.
Whenever P < 0.1 for the 1-T model, we resorted to the 2-T fit. The
results and the calculation of X-ray luminosities for possible cluster members is deferred
to Sect. 5.9 after the Collinder 69 bona fide sample
has been established.
The cross-correlation with cataloged Collinder 69 membership lists and previous photometric surveys is described in Sect. 3.7. We anticipate here that there is a total of 68 confirmed cluster members within our two XMM-Newton pointings that are not detected with any EPIC instrument. These members were previously identified in optical surveys and were published by Dolan & Mathieu (1999), Barrado y Navascués et al. (2004b) and Morales-Calderón (2008). We have derived upper limits to their count rates making use of the sensitivity map generated with the SAS tool esensmap. The detection limit derived from the sensitivity map is 0.00043 cts/s (C69 E) and 0.00071 cts/s (C69 W) in the center of the image, and roughly a factor of three lower toward the edge of the overlapping field of MOS and pn. The sensitivity is further decreased in the outermost areas that are covered only by one of the detectors.
Observing log and astrometric correction of OM data with respect to 2 MASS.
2.2. OM
The OM was operated in full frame imaging mode. For the C 69 W field one V band exposure is available, and for the C 69 E field there are five consecutive exposures with the V and B filters (see Table 2).
The OM data were reduced with the SAS metatask omichain with default parameters. This task performs all basic data reduction steps, including flat-fielding, identification of bad pixels, modulo-8 fixed pattern correction, and source detection with aperture photometry. The final output of the pipeline is a combined OM source list that contains the Johnson magnitudes. In the case of several exposures in a given filter the magnitude is the average of all exposures in that filter, i.e. for C 69 E the average B magnitude of exposures 007, 008, and 010 and the average V magnitude of exposures 006 and 009. We corrected the absolute positions of the detections by cross-correlating the OM source list with the 2 MASS catalog (Cutri et al. 2003). A search radius of 3′′ was used and only OM sources with ≥15 σ detection significance were considered for the astrometry. Subsequently, the OM coordinates of all detected sources were shifted by the median position offset (given in Table 2).
Each exposure yielded approximately 1000 detections. In this paper we present only the photometry for those OM objects that are counterparts to EPIC X-ray sources.
Standard (Johnson) magnitudes are automatically extracted by the SAS tools if observations are performed in more than one band, allowing us to calculate the color. Since we obtained only V band data for C 69 W, the omichain pipeline does not provide standard magnitudes. However, we can make use of the C 69 E data to calibrate the V band photometry for the OM detections in C 69 W. For the OM sources in the C 69 E field we verified that a linear transformation with the B − V color reproduces the standard magnitudes derived by the SAS tools, Vins = Vstd + κV·(B − V)std = Vstd + CFV, and we determined the average coefficient ⟨ κV ⟩ . In order to compute standard magnitudes Vstd from the instrumental magnitudes Vins measured in the C 69 W field, we assume for all objects the mean color observed in C69 E, ⟨ B − V ⟩ = 1.04 ± 0.35. The conversion factor derived in this way is CFV = 0.03 ± 0.02, where the uncertainty reflects the statistical errors of ⟨ κ ⟩ and ⟨ B − V ⟩ of the C 69 E field. Note that the transformation factor CFV is almost negligibly small.
3. Compilation of the master catalog
For the search for optical/IR counterparts to the X-ray sources we used the published data from Dolan & Mathieu (1999, 2001, 2002) and Barrado y Navascués et al. (2004b, 2007). These tables include all presently known solar-type and low-mass members of Collinder 69, and a large catalog of photometric measurements (VRcIc) carried out in the field around the cluster, without any membership selection (Table 4 of Dolan & Mathieu 2002). For the high-mass end (spectral types earlier than F5), see Hernández et al. (2009). In addition we cross-correlated the X-ray source list (Tables 3 and 4) with the Spitzer data (from the Guaranteed Time Observation program PID #37). We also made use of the V and B band data obtained with the OM. Near-IR data were obtained from 2MASS and Calar Alto using the Omega2000 camera.
Next we describe the individual catalogs and their cross-correlation with the X-ray source list. A graphical overview for the spatial coverage of the multi-wavelength database in Collinder 69 is shown in Fig. 2. In Figs. 3 and 4 we compare the mass ranges (for cluster members) covered by the samples described in the various datasets. Details about how masses were derived can be found in Sects. 5.2 and 5.3.
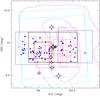 |
Fig. 2 The young cluster Collinder 69, with the surveys we have conducted so far at different wavelengths. The black rectangle represents the CFHT1999 RIc survey, the red squares the near-IR data (JHKs) from Omega2000 (thick lines for the deep image), whereas the IRAC mapping is represented with dashed, cyan lines. Finally, our two XMM-Newton FOVs are located with blue, dotted squares. O and B stars are represented by four-point stars, with increasing size related to increasing brightness. Our final cluster members (see Sect. 4.4) are represented as solid circles (blue for probable members, cyan for possible members). The magenta contours corresponds to IRAS data at 100 micron. |
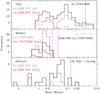 |
Fig. 3 Histograms for different samples (and subsamples) described in Sect. 3 and identified with different techniques: optical, mid-infrared, and X-rays. The vertical dotted and long-dashed – magenta – segments locate the detection limit of each survey for cluster members. In these three subpanels – a top, middle and bottom, solid – black – lines correspond to the whole sample analyzed in each subpanel; dotted – gray – lines are used for subsamples spatially included in the XMM-Newton field-of-view, whereas dashed – red – lines describe the data with X-ray detections. Subpanel at the top – Probable and possible members from Barrado y Navascués et al. (2004b) and Barrado y Navascués et al. (2007), with an initial selection based on optical photometry. The less massive objects detected in the XMM-Newton data are LOri-CFHT-090 and LOri-CFHT-098, with ~0.12 M⊙. Subpanel in the middle – Members listed by Dolan & Mathieu (1999), originally selected from optical photometry (including narrow-band Hα – i.e., active stars or with accretion), and confirmed based on high-resolution spectroscopy. The thick dotted long-dashed – silver – histogram includes members in common with Barrado y Navascués et al. (2004b). The completeness limits correspond to the whole photometric survey described in Dolan & Mathieu (1999) and Dolan & Mathieu (2002) –0.35 and 0.22 M⊙, respectively. Subpanel at the bottom – New members from Morales-Calderón (2008), composed by Class II sources (Classical TTauri stars and few members with transition disks). Initial selection based on mid-IR data from Spitzer. |
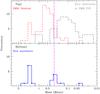 |
Fig. 4 Subpanel at the top – The X-ray sample of C69 members – dashed, red line – (i.e., possible and probable Collinder 69 members with X-ray detections) based on XMM-Newton data. The dotted and long-dashed – grey – represents previously known Collinder 69 members – probable and possible – with no X-ray (only upper limits). Subpanel at the bottom – We highlight in blue the new probable and possible members identified with detections by XMM-Newton (16 probable and 6 possible new members). |
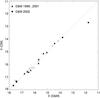 |
Fig. 5 Comparison of V magnitudes measured with the OM and from the literature for optical counterparts to EPIC sources in Collinder 69: filled symbols – C 69 E, open symbols – C 69 W. The good agreement shows that OM photometry is reliable and that the errors associated with the transformation of instrumental into standard magnitudes for the C 69 W field are negligibly small. |
3.1. Optical data from the CFHT survey
Barrado y Navascués et al. (2004b) present deep optical photometry in an area of 42′ × 28′ centered on the star λ Ori, taken with the CFHT telescope and the cousins Rc,Ic filters (hereafter CFHT1999). Owing to the field-of-view of the CFHT1999 survey, these optical data only cover part of the two XMM-Newton fields. Since this survey includes shallow (10 s) and deep (600 s and 900 s for the Ic and Rc filter, respectively) exposures, providing photometry for bright and faint objects, we used both datasets. The deep images are considered only for X-ray sources that have no counterpart in the shallow images. We removed from the final catalog all optical counterparts with photometry outside the detector linear regime. For cluster members, this survey is complete down to 0.025 M⊙ (additional information can be found in Barrado y Navascués et al. 2004b). A histogram with a distribution of masses is displayed in Fig. 3.
3.2. Optical data from Dolan & Mathieu 1999, 2001, and 2002
One of the most comprehensive studies of the region around the LOSFR has been published by Dolan & Mathieu (1999, 2001, 2002). They include optical photometry for cluster candidate members selected by Hα narrow-band photometry and subsequent optical spectroscopy. They have also published the complete photometry for those stars not selected as cluster members (i.e., not active in Hα at the time of the observation). We have cross-correlated their data – both the identified members and the whole photometric database – with our X-ray detections using the same strategy as in the case of the CFHT1999 survey, and detected all cluster members within the XMM-Newton pointings except one (DM048). Note that these optical surveys include completely our XMM-Newton pointings. In total, out of the 205 optical and IR counterparts located near our 164 XMM-Newton X-ray sources, 53 have photometry coming from these catalogs (35 in Dolan & Mathieu 1999; and another 18 in Dolan & Mathieu 2002).
For the cluster members described in Dolan & Mathieu (1999), and using a detection limit – for cluster members – Ilim ~ 15 mag, this value corresponds to a mass of 0.35 M⊙, for a NextGen 5 Myr isochrone (Baraffe et al. 1998) and a distance of 400 pc. Figure 3 includes a histogram for the mass distribution for cluster members listed by Dolan & Mathieu (1999), although masses were derived using bolometric luminosities (see Sect. 5.3). Of the 36 cluster members located within the XMM-Newton FOVs, 35 have been detected in X-rays. Only DM048, a Class II member, appears to have a low activity and we were only able to derive an upper limit for its X-ray flux.
In the case of the comprehensive photometric survey contained in Dolan & Mathieu (2002), with a Rcompl ~ 17.5 mag, this value translates for cluster members to ~0.22 M⊙.
3.3. Optical data from the XMM-Newton optical monitor
About a third of the X-ray sources with OM counterpart have V band data obtained by Dolan & Mathieu (1999, 2002). This allows us to check the quality of the OM photometry by comparing the magnitudes measured with the OM to those from the Dolan & Mathieu (1999, 2001, 2002) surveys. In Fig. 5 filled symbols represent data from the C 69 E field with pipeline computed standard magnitudes for the OM. Open symbols are stars from the C 69 W field, for which we used the transformation into standard magnitudes described in Sect. 2.2.
Owing to the high sensitivity of its detectors, the OM is very well suited for observing faint stars. Indeed, we find good agreement with published photometry from Dolan & Mathieu (1999, 2001, 2002) down to V ~ 18 mag. The exception are bright stars where the OM photometry is seen to deviate strongly from the Dolan & Mathieu (1999, 2001, 2002) catalogs. Indeed the OM cannot be used for observations of optically bright sources (Ehle et al. 2003, XMM-Newton Users’ Handbook), and we do not use OM data for stars with V < 12 mag in the master catalog.
3.4. Near-IR data from the 2MASS all sky survey
We have correlated the positions of the X-ray detections with near-IR photometry in the 2MASS catalog (Cutri et al. 2003). This all-sky survey has limiting magnitudes of Jlim ~ 16.8 mag, Hlim ~ 16.1 mag, Kslim ~ 15.3 mag, which does not suffice to provide a complete coverage of our sources detected in the X-ray images. Using a completeness limit of Hcompl ~ 15.1 mag, this value translates to a mass of 0.05 M⊙ for a NextGen 5 Myr isochrone and 400 pc. Therefore, cluster members less massive than this value, as well as other sources (background stars and galaxies), might not be detected with 2MASS. In any event, as we will show in Sect. 5.3, the completeness limit of the XMM-Newton data for Collinder 69 is ~0.3 M⊙ – although a higher mass might be possible, such that all cluster members, except C69-X-w012 because it is too bright, have a 2MASS counterpart.
3.5. Near-IR data from CAHA and Omega2000
We have obtained deep near-IR photometry in October 2005 with the Calar Alto 3.5 m (Almeria, Spain) and the Omega2000 camera under a Director Discretionary Time (DDT) program. Omega2000 has a 15.36 × 15.36 arcmin FOV and we observed several pointings in the J, H, and Ks totaling 5 min per filter and field. The seeing was about 1.2 arcsec and the photometric calibration was obtained with stars in the 2MASS catalog. Details about the photometry extraction and the calibration can be found in Barrado y Navascués et al. (2007). The data are complete down to Jcompl = 20.00 mag, Hcompl = 19.00 mag and Kscompl = 18.00 mag, well below the deuterium burning limit at 13 M (Jupiter) for cluster members. The detection limits are Jlim = 20.50 mag, Hlim = 19.75 and Kslim = 18.75 mag.
In addition, we later requested on another DDT observation with the same setup in one specific field located south-east of the O8III star λ Ori, where a significant number of cluster members are located (see Barrado y Navascués et al. 2004b, 2007). This observation took place in November 2007. Each image is composed of 30 individual 60 s exposures, with a dithering of 15 arcsec. Therefore, the total exposure time for each filter is 30 min. The reduction and the calibration have been performed in the same way as for the data collected in 2005. This dataset is complete down to Jcompl = 21.00 mag, Hcompl = 20.00 mag and Kscompl = 19.50 mag. The detection limits are Jlim = 21.50 mag, Hlim = 20.50 and Kslim = 20.00 mag.
3.6. The Spitzer data
Our Spitzer data were collected during March 15, with the Multiband Imaging Photometer for Spitzer (MIPS, Rieke et al. 2004) and on October 11, with the InfraRed Array Camera (IRAC, Fazio et al. 2004), 2004, as part of a Guaranteed Time Observation program (GTO, PID:37). The layout of observations is explained in detail in Barrado y Navascués et al. (2007).
IRAC imaging was performed in mapping mode with individual exposures of 12 s frametime and three dithers at each map step. The Collinder 69 map was broken into two segments, one offset west of the star λ Ori – a very bright O8 III – and the other offset to the east, with the combined image covering an area of 57′ × 61.5′, leaving the star λ Ori approximately at the center. Each of the IRAC images from the Spitzer Science Center pipeline were corrected for instrumental artifacts using the IDL code provided by the Spitzer Science Center and then combined into mosaics at each of the four bandpasses using the MOPEX package (Makovoz & Marleau 2005). Note that the IRAC images do not cover exactly the same FOV in all bands, providing a slice north of the star with data at 3.6 and 5.8 μm, and another slice south of it with photometry at 4.5 and 8.0 μm. Figure 2 shows the IRAC pointings as cyan dashed lines. However, our X-ray sources are not affected by the lack of spatial coincidence between the IRAC channels. Note, however, that one X-ray source (C69-X-e041 = DM71) is located outside of the IRAC FOV and lack mid-IR photometry (although we do have MIPS data at 24 micron).
The MIPS instrument was used to map the cluster with a medium rate scan mode and 12 legs separated by 302′′ in the cross scan direction. The total effective integration time per point on the sky at 24 μm for most points in the map was 40 s, and the mosaic covered an area of 60.5′ × 98.75′ centered around the star λ Ori. Since there were no visible artifacts in the pipeline mosaics for MIPS 24 μm we used them as our starting point to extract the photometry.
The analysis of the data was done with IRAF. We performed aperture photometry to derive fluxes for all objects in our field. For the IRAC mosaics we used an aperture of 3 pixels radius (about 3.6 arcsec), and the sky was computed using a circular annulus 3 pixels wide, starting at a radius 3 pixels away from the center. It is necessary to apply an aperture correction to our 3-pixel aperture photometry in order to estimate the flux for a 10-pixel aperture, because the latter is the aperture size used to determine the IRAC flux calibration. For the MIPS photometry at 24 μm, we used a 5.31 pixels (13 arcsec) aperture and a sky annulus from 8.16 pixels (20 arcsec) to 13.06 pixels (32 arcsec).
The Spitzer survey was used to identify new cluster members with mid-IR excesses. These additional members, spread on an area about 1 sq. deg., are presented in Morales-Calderón (2008). Additional information can be found in Morales-Calderón et al. (2010, in prep.). The mass distribution of this sample is displayed in Fig. 3. The completeness limit for Spitzer new members, imposed by the IRAC band at 8 μm, is ~0.08 M⊙.
3.7. Cross-correlation with the X-ray catalog
Each of the catalogs described from Sects. 3.1 to 3.6 was cross-correlated with the X-ray source list. We searched for optical and IR counterparts for our X-ray detections, using a radius of 5.1′′. This search radius is motivated by the astrometry of XMM-Newton (~1−2′′) and the statistical errors of the X-ray sources (≤4′′).
We found multiple counterparts for several X-ray sources within our search radius. The visual inspection of all optical and IR images indicated that in a few cases there are additional possible counterparts even slightly beyond this search radius. In order to be as comprehensive as possible, we have also retained them. We compiled a master catalog with all sources that are present in at least one of the mappings (optical, near-IR or mid-IR) and extracted the photometry from these surveys. The photometry of all possible counterparts to X-ray sources is listed in Tables 5 and 6 (XMM-Newton eastern and western pointings, respectively). The additional columns at the end of these tables reference the catalog/instrument from which the data was extracted as described in the following paragraphs.
When there is ambiguity in the optical or IR identification. these possibilities were identified, after visual inspection, by a letter denoting whether the optical or IR source is close to the center of the X-ray error box – c, or south – s, north – n, west – w – or east – e. Although we are confident that the closest optical/IR counterpart provides the correct identification of the X-ray source, we have considered the secondary counterparts and assessed whether all these optical/infrared sources might be cluster members, and also the likelihood of them being the actual source of the X-ray emission (i.e., the correct identification between the X-ray and the optical/IR coordinates).
For the selection of counterparts that were detected in a given passband in more than one of the catalogs and/or surveys we proceed as follows: for the blue side of the optical range (B and V), we listed first the data coming from the OM; otherwise, the V magnitude from Dolan & Mathieu (1999, 2001, 2002) is listed. For the reddest portion of the optical range (Rc and Ic), we have chosen first the data from Barrado y Navascués et al. (2007) (i.e., candidate members detected in Barrado y Navascués et al. 2004b). Then, we selected the photometry from Dolan & Mathieu (1999, 2001) (i.e., members based on photometry and spectroscopy). If the X-ray source was not present in any of those catalogs, we first looked for an optical counterpart in the CFHT1999 survey (only for objects with Ic >13.2 mag, and if it did not appear there, in the database from Dolan & Mathieu (2002), which is shallower but covers a much larger area. For the near-IR photometry (JHKs), we prioritized the data coming from the deep images acquired with Omega2000 in November 2007 (J > 17.2 mag). If no data were recorded, we selected the photometry coming from Omega2000 taken in October 2005, shallower (J > 13.0 mag) but covering a much larger area. Otherwise, data from the 2MASS All Sky Survey are listed.
Spitzer data have been published for the known members of Collinder 69 (Barrado y Navascués et al. 2007) of which 31 are found to be X-ray sources with XMM-Newton. Another 16 X-ray sources were previously identified by Dolan & Mathieu (1999) as cluster members, and we have obtained the mid-IR fluxes with Spitzer for them (see Morales-Calderón 2008; and Morales-Calderón et al. 2010, in prep.).
We present here for the first time the Spitzer data for additional 95 X-ray objects that were not identified as young stars before (two of them only with data at 24 micron from MIPS).
In total, we have 164 X-ray sources and identified 205 possible counterparts either in the optical or in the infrared. A summary table, with the identification in different surveys, can be found in Table 7.
Summary with the source of the optical and infrared photometry or the 205 counterparts of the 164 XMM-Newton sources, and some properties of the possible and probable members.
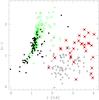 |
Fig. 6 This graph allows the identification of contamination by quasars: previously known members of Collinder 69 from Dolan & Mathieu (1999) and Barrado y Navascués et al. (2004b, 2007) are displayed as green crosses and open circles (for Class III and II members, respectively). Quasars observed by the SWIRE team (Harvey et al. 2006) appear as gray open triangles. Counterparts to our XMM-Newton X-ray sources are shown as as black circles over-imposed by big red crosses (for quasars, rejected as cluster members based on this diagram) and as solid black circles (other sources, including possible cluster members and other contaminants). After Bouy et al. (2009). |
4. Selection of Collinder 69 candidate members
The X-ray, optical, and IR data presented above were used to select new candidate members of Collinder 69. The result is summarized in Tables 8 and 9. Here we describe our selection criteria. In the next two figures (Figs. 6 and 7) we will include all optical, near- and mid-IR sources detected in the search box around the X-ray position, as examples of how we have proceeded with different membership diagnostic tools. Therefore, these diagrams include all possible optical and IR counterparts of the X-ray sources, when the data are available. However, after finishing the membership analysis, we reached the conclusion that when several identifications are possible, the object responsible of the X-ray emission is the closest to the X-ray coordinate, and they are the only ones plotted in the subsequent color–color and color–magnitude diagrams (such as the panels in Fig. 8). Out of our 164 XMM-Newton detections, there are 61 probable members and another five possible members. These are the clusters members we have included in our calculation of Collinder 69 X-ray luminosity function and disk fraction, together with Collinder 69 members not detected in X-rays (Sect. 4.4.2), restricted to specific mass intervals.
4.1. Removing the contamination by quasars
As shown by Bouy et al. (2009), in a deep search of faint Collinder 69 members close to the bright star λ Orionis, a color–color diagram that includes data in the I, J, and [3.6] filters is a powerful tool to identify QSOs. This diagram is shown in Fig. 6, where we included several samples corresponding to previously known members of the cluster from Dolan & Mathieu (1999), from Barrado y Navascués et al. (2004b, 2007), and from the Spitzer/SWIRE survey (extragalactic sources, Harvey et al. 2006), which identified a significant number of quasars. The location of our X-ray sources in the figure allows an easy classification between objects located within the same region as the SWIRE QSOs and those compatible with stellar nature and cluster membership. The first group – QSO – includes 31 from the total sample (23 of the objects we have, at the end of the process, identified as the origin of the X-ray emission). The second group contains 80 of the initial sample of possible counterparts (72 of the final sample of X-ray sources). The rest of the X-ray sources cannot be classified because they lack IR data in one or more bands used for this analysis (94 of the initial sample of counterparts, 69 of the final list of counterparts).
Based on this information, we classified the 31 counterparts that lie in the QSO region as non-members of the Collinder 69 cluster. As explained above, when there are several identifications, this includes objects detected in our multi-wavelength surveys that are not the closest to the X-ray source. In any case, we used additional diagnostics (see next subsections) and verify, when the data are available, that they fulfill several other non-membership criteria, such as luminosities too low for their effective temperatures, for example. This information is listed in Col. #4 of Tables 8 and 9.
4.2. The Hertzsprung-Russell diagram
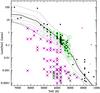 |
Fig. 7 HR diagram with our rejection of non-members based on their location (solid circles with over-imposed big crosses – magenta – for non-members below the Main-Sequence). Other possible non-members, immediately above and below the cluster sequence are displayed as magenta triangles. Previously rejected quasars are displayed as solid circles with over-imposed big crosses – in gray. Other candidate members, not rejected by this test, are shown as solid black circles. Some will be later removed from the membership list using other color–color and color–magnitude diagrams. Previously known members for the cluster appear as green crosses (Class III) or open green circles (Class II), and were selected from Dolan & Mathieu (1999), Barrado y Navascués et al. (2007) and Morales-Calderón (2008). Isochrones correspond to Siess et al. (2000) – 1, 3, 5, 7, 10, 15, 20, 30, 50 and 100 Myr – and COND models – 1, 5, 10, 100, 1000 and 10 000 Myr – from the Lyon group (Baraffe et al. 2002; or Chabrier et al. 2000). |
We applied Virtual Observatory techniques to derive the properties of the SEDs for the counterparts to the X-ray emitters. In particular, we used the VOSA tool (“Virtual Observatory SED Analyzer”, Bayo et al. 2008) to fit theoretical models and to estimate effective temperatures and bolometric luminosities, assuming a gravity value of log g = 4.0 and a distance of 400 pc. We used models by Kurucz (Castelli et al. 1997) for fits with temperatures Teff ≥ 3750 K, NextGen models for 3700 K ≥ Teff ≥ 2500 K, Dusty models for 2400 K ≥ Teff ≥ 1900 K, and COND models for Teff ≥ 1800 K (Baraffe et al. 1998; Chabrier et al. 2000; Baraffe et al. 2002). Individual masses and ages were also estimated with this tool. In addition, using the bolometric luminosities and 5 Myr isochrones (Siess et al. 2000; Chabrier et al. 2000, where the link point is at 0.1 M⊙ or 3000 K), we also derived masses and effective temperatures. We additionally computed the fraction between the measured part of the observed flux (from the photometry) and the total bolometric luminosity – the flux fraction. All this information is listed in Table 10 for our possible and probable members of the cluster.
An Hertzsprung-Russell (HR) diagram is presented in Fig. 7. As we forced the fits with specific values of gravity and distance, we expect that field stars and extragalactic sources will not appear close to the cluster isochrone at 5 Myr. Therefore, we classified all X-ray detections well below the main sequence (MS) as not belonging to the Collinder 69 cluster (probable non-members – NM – if they also fulfill other non-membership criteria, or possible non-members – NM? – if we were unable to reject membership using other diagrams). Other objects located between the MS and the 15 Myr isochrone or well above the 1 Myr isochrone have been flagged as possible non-member (NM?) and classified later on depending on their location in several CMDs and CCD. (Col. #5 in Tables 8 and 9).
Based on our experience (Bayo et al. 2008), this methodology to estimate bolometric luminosities based on photospheric SED fitting can provide only lower limits for objects such as edge-on disks. This way we might be misclassifying some good candidates. In any case this type of object would have been easy to recover according to their IRAC photometry, and indeed we did not detected any of them (see Morales-Calderón 2008; or Morales-Calderón et al. 2010).
4.3. Additional pollutants based on CM and CC diagrams
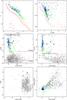 |
Fig. 8 Optical, near- and mid-IR color–color and color–magnitude diagrams of counterparts to X-ray sources in the Collinder 69 cluster and comparison with other samples. Small solid circles – blue and cyan – represent probable and possible (Y?) members of the cluster, whereas solid triangles – red and magenta – correspond to the location of probable (NM) and possible (NM?) non-members. Class II stellar objects are identified as big open, black circles. Previously known members for the cluster appear as green crosses (Class III) or open green circles (Class II), and were selected from Dolan & Mathieu (1999), Barrado y Navascués et al. (2007) and Morales-Calderón (2008). The asterisks represent the location of Taurus known members, with photometry coming from Luhman et al. (2006). The extragalactic samples were selected from Sacchi et al. (2009), and correspond to the SWIRE/XMM-Newton/ELAIS-S1 Field with spectroscopic data. Up- and down-ward open triangles – light gray – correspond to the AGN1 – QSO1, broad lines – and AGN2 – obscured QSO, narrow lines, respectively, whereas open circles – light gray – and three-point stars – dark gray – represent resolved galaxies and Emission Line Galaxies (which include AGN and star-forming galaxies), respectively. The first color–magnitude diagram includes a 5 Myr isochrone – Dusty – from the Lyon group (Baraffe et al. 2002). A reddening vector also has been included. |
Because our spatial coverage is not complete or because of the completeness limits of our optical and mid-IR surveys, we do not have a complete photometric coverage for all X-ray sources and we cannot discuss their nature based on the previous diagrams (Figs. 6 and 7). Therefore, we now discuss their location in optical and near-IR color–magnitude and color–color diagrams.
Figure 8 contains six panels with a very complete dataset and, for the sake of clarity, the final classification for the 164 sources identified as the origin of the X-ray emission. We also included several samples for comparison:
-
i)
previously known members of the cluster appear as green crosses (Class III) or open green circles (Class II), and were selected from Dolan & Mathieu (1999), Barrado y Navascués et al. (2007) and Morales-Calderón (2008);
-
ii)
known Taurus members, with photometry coming from Luhman et al. (2006), have been included as asterisks. We included these stars, younger than Collinder 69 members, in order to compare their location in these diagrams with those characteristic for extragalactic sources (see below). Bona fide members of the young cluster Collinder 69 should coincide with the area where Taurus members are found;
-
iii)
extragalactic sources have also been included, taken from Sacchi et al. (2009). Additional samples can be found in Grazian et al. (2006) (GOODS/MUSICS, mainly AGNs), Hatziminaoglou et al. (2008) (SWIRE/QSO), and Surace et al. (2004) (SWIRE/ELAIS). The extragalactic sources were selected from the SWIRE/XMM-Newton/ELAIS-S1 Field and were classified using spectroscopic data. Up- and down-ward open triangles – light gray – correspond to the AGN1 – QSO1, broad lines – and AGN2 – obscured QSO, narrow lines, respectively, whereas open circles – light gray – and three-point stars – dark gray – represent resolved galaxies and Emission Line Galaxies (ELG, which include AGN and star-forming galaxies), respectively.
Properties for our probable and possible X-ray candidate members of Collinder 69, after the selection process.
4.4. A final list of good cluster candidate members
After our membership discussion we cataloged 61 objects as probable members (Y) and another five as possible members (Y?), out of the 164 X-ray sources. They are listed in Table 10.
All probable members have complete IRAC photometry. We classified three of them as Class II objects (Classical TTauri stars) based on IRAC data and 58 of them as Class III objects (weak-line TTauri stars). Sixteen of these probable members are new, whereas 30 were listed in Barrado y Navascués et al. (2004b) and another 15 were identified by Dolan & Mathieu (1999).
Regarding the possible members (five in total), we have one Class II (C69-X-w028), another Class III (C69-X-e096c) and another three (C69-X-e013, C69-X-e041, C69-X-e042) lack data at some of the four IRAC bands. However, their SED resembles a blackbody (i.e., they should be Class III), although one of them (C69-X-e041) has an obvious excess at 24 microns, which suggests it has a transition disk. Of these five possible members, C69-X-e096c is LOri058 (Barrado y Navascués et al. 2004b) and C69-X-e041 has been identified previously as DM071 (Dolan & Mathieu 1999), which again reinforces the validity of our selection procedure.
Another 86 X-ray sources were classified as non-members based on the different criteria described above, and another 12 do not have enough data to be discussed, which indicates that they are probably heavily extincted and that their nature is probably extragalactic (see next section). None of these 98 (86 non-members plus 12 without data) sources have been listed either by Dolan & Mathieu (1999) or Barrado y Navascués et al. (2004b) as possible members, which provides additional support to our classification scheme.
4.4.1. New candidates for visual binaries
Three X-ray sources classified as members have multiple counterparts within the XMM-Newton pointing uncertainty. One of them, LOri025 (C69-X-e011c), is a confirmed member of the cluster for which we have now discovered a possible faint companion (C69-X-e011e, a possible member). Another probable member (C69-X-e104c) has a possible companion nearby, which fulfills some membership criteria (C69-X-e104e), whereas the probable member C69-X-w001c might have a companion north of it, but it is too close and fainter compared to the first one (the central source) to be able to say anything more.
Finally, LOri 113 (C69-X-w032w), a cluster member from Barrado y Navascués et al. (2004b, 2007), is relatively close to the X-ray source C69-X-w032c, which has been classified as a probable non-member. However, we do not believe they correspond to the same source and assumed that this X-ray source does not belong to the Collinder 69 cluster, while LOri 113 is considered an X-ray undetected Collinder 69 member.
4.4.2. Cluster members not detected in X-rays
Within the XMM-Newton pointings, there are a number of probable and possible members of Collinder 69 that are not detected as X-ray sources. There is one from Dolan & Mathieu (1999), another 10 from Morales-Calderón (2008), and 57 objects from Barrado y Navascués et al. (2004b). This is not surprising since most of the undetected candidate members from Barrado y Navascués et al. (2004b) are near or within the substellar domain (see Figs. 3 and 4) and therefore they are expected to be faint in X-rays. The mass distribution of this subsample can be found in Fig. 4, as thick long dash-point line – dark gray. We derived upper limits for all of them, with the goal of producing an unbiased X-ray luminosity function. Their X-ray data are listed in Tables 11 and 12 together with their properties derived from optical/IR observations.
There are few cluster members with masses around 1 M⊙ that have not been detected in X-ray (see Figs. 4 and 14). This is not surprising, since they have Log Lx/Lbol ~ −4 dex (upper limits). As a comparison, Briggs et al. (2007) have measured values for Taurus members (younger and closer) with similar mass at Log Lx/Lbol ~ −4.5 dex. Therefore, the explanation is that our XMM-Newton observations are not deep enough to detect them, not because they lack X-ray emission.
For the calculation of the upper limits to the X-ray luminosities we assumed an isothermal absorbed spectrum with column density and temperature corresponding to the mean values measured from the spectral fits of detected sources (see Sect. 5.9). Under these assumptions the limiting flux of our observations is flim ~ 5 × 10-15 erg/cm2/s or log Lx [erg/s] ~ 29. The upper limits we derive for Lx > 1029 erg/s (see Tables 11 and 12) are consistent with this sensitivity limit.
4.5. The nature of the X-ray sources not selected as cluster members
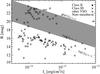 |
Fig. 9 R magnitude vs. X-ray flux for all XMM-Newton sources with R-band counterpart. The plotting symbols are explained in the top right of the figure. The gray area is the typical location of AGNs, and the dashed line marks the empirical upper envelope for quiescent galaxies; see e.g. Barger et al. (2003). |
Stellar parameters and X-ray upper limits for probable and possible members of Collinder 69 (taken from D&M1999, ByN2004 and Morales 2008) that are undetected in X-rays (easter pointing – Col69 E).
Stellar parameters and X-ray upper limits for probable and possible members of Collinder 69 (taken from D&M1999, ByN2004 and Morales 2008) that are undetected in X-rays (western pointing –Col69 W).
According to our selection, the fraction of cluster members among all detected X-ray sources is ~40 % (66/164). In particular, we identified 48 of 112 sources in C69 E and 18 of 52 sources in C69 W as Collinder 69 member. As a rough estimate for the extragalactic contamination of the XMM-Newton source lists we consider the log N − log S distributions shown (e.g. by Baldi et al. 2002). For our flux limit of fx ~ 5 × 10-15 erg/cm2/s about 40 extragalactic sources are expected within each XMM-Newton pointing. This compares well to the 64 and 34 X-ray sources classified as non-cluster members in C69 E and W, respectively.
The nature of the X-ray sources that are not Collinder 69 members is examined in Fig. 9. The location of extragalactic sources in this diagram was studied e.g. by Barger et al. (2003). Among the 164 X-ray sources, 102 have measured R magnitude. The typical area for AGN is highlighted and coincides with the bulk of the optically faint X-ray emitters. None of them has been classified as a cluster member by our selection procedure. Quiescent galaxies are typically located below the dashed line in an area that overlaps with that of the cluster members and contains the majority of the remaining non-members.
5. Properties of Collinder 69 members
5.1. Spectral energy distributions
Our multi-wavelength photometry, which covers a range from the B (V) band at 0.3 (0.5 micron) up to 24 micron, allows us to construct SEDs for our 164 X-ray sources (more precisely the 205 original possible counterparts, although in this section we will restrict the discussion to the selected probable and possible members). A visual inspection allows us an initial classification as Class I – increasing slope in the SED, II – an obvious IR excess- and III – black-body SED – for each X-ray source (or for the several identifications, when there are several optical or IR possible counterparts), keeping in mind that this is tentative and that some among them could be extragalactic. If galactic, a Class I or II object is a good candidate cluster member. This initial classification based on the visual inspection has been confirmed by the classification based on an IRAC color–color diagram. We list a tag in Col. #10 of Table 10 indicating whether each object (probable or possible member) has an SED corresponding to a blackbody (BB or Class III), Class II or Class I.
For those sources with at least three Spitzer/IRAC datapoints, we also computed the slope and used the criterion by Lada et al. (2006) to establish whether they have a disk, and whether it is optically thin or thick. Both the disk type and slope appear listed in Table 10 (Cols. #11 and #12). They can be compared with the results based on the IRAC CCD listed in Col. #10. We emphasize that the presence of a disk is a good membership indicator for a stellar source.
5.2. Bolometric luminosity, effective temperature, and mass for cluster members
As already mentioned in Sect. 4.2, we made use of the VOSA tool (Bayo et al. 2008) to derive effective temperatures and bolometric luminosities for the XMM-Newton sample of X-ray sources. For those among them classified as probable and possible members (Table 10) we also derived individual masses and effective temperatures using a 5 Myr isochrone constructed using data from Siess et al. (2000) – masses above 0.1 M⊙ – and Chabrier et al. (2000) – masses below this value, by interpolating the bolometric luminosity.
The same procedure was applied to several samples used throughout the paper (Dolan & Mathieu 1999, 2002; Barrado y Navascués et al. 2004b; Morales-Calderón 2008). A comparison of the mass distributions can be found in Figs. 3 and 4.
5.3. Mass distribution and comparison with other subsamples
Figure 4 shows the mass distribution of the cluster members in the X-ray sample described in Sect. 4.4 (both the detected – dashed, red line – and the non-detected – thick dashed-dotted, gray line – Collinder 69 members). This graph suggests that the X-ray survey is complete down to ~0.3 M⊙ (or even as high as 0.5 M⊙), although a couple of previously known members with masses around 0.15 M⊙ have been detected. Note that our X-ray flux limit of log Lx ~ 29 erg/s corresponds to the lower 1 sigma boundary at 0.3 M⊙ for the Lx − M relation derived for pre-MS stars in the Orion Nebula Cluster (Preibisch et al. 2005). Therefore, if the X-ray emission of LOSFR stars is similar to those in the ONC, most but not all 0.3 M⊙ stars should have been detected confirming qualitatively the above estimate for the XILO mass limit. This is not in contradiction with the detection of a few less massive stars given the various uncertainties of the X-ray flux limit and the large spread of X-ray luminosities for a given mass. Only the very lowest mass cluster member detected in XILO (C69-X-w028 with M = 0.035 M⊙) may not be plausible (see Sect. 5.9).
The mass distribution of cluster members with X-ray emission (dashed, red line in Fig. 4) also has a bimodal distribution, with a very prominent peak around 0.6 M⊙ and a secondary peak for higher masses (1.75–2.35 M⊙), with a low total number of objects, including two possible members with masses around 3 M⊙. This peak actually resembles what we found with a different technique (mid-IR excesses due to a circumstellar disk) with our Spitzer/IRAC mapping (panel 3c).
A word of caution is required for the mass distribution for high-mass end in the sample (solar-type stars and larger masses). Among the 16 probable and possible members with X-ray emission and mass larger than 1 M⊙, there are seven whose photometric data are incomplete, and who lack any optical information (C69-X-e009, C69-X-e013, C69-X-e023, C69-X-e042, C69-X-w001, C69-X-w014, C69-X-w020). Therefore, the fits we carried out with VOSA used only the Rayleigh-Jeans part of the SED and not the portion with the highest fluxes. This means that the bolometric luminosities might be biased and that the masses obtained from them are shifted (lower values) from the real values by an amount enough to produce the distribution we derived for high masses. We note, however, that five among them are probable members and that the offset of the mass could not be larger than few tenths of a solar mass, i.e., moving the histogram one or two bins at most for the high mass end. Indeed, we performed a search with VOSA for additional photometry in VO-compliant databases for those objects, fitting again bolometric luminosities and effective temperatures, and deriving masses using a 5 Myr isochrone. As expected, the final individual mass does not change by a significant amount, because it is almost identical for four of them. For the other three, the mass estimate moves from 1.23 to 1.02 M⊙ (C69-X-e023) , from 3.17 to 2.92 M⊙ (C69-X-e042), and from 3.04 to 2.94 M⊙ (C69-X-e013).
Masses around ~2−3 M⊙ are critical for dynamo action because the convection zone becomes very thin and low chromospheric and coronal activity is expected. The comparison of the most massive stars in the sample (M ≥ 1.8 M⊙) with the evolutionary models of Siess et al. (2000) shows that only two of them, those with M ~ 3 M⊙ (C69-X-e042 and C69-X-e013), have very shallow convection zones. These two stars indeed have by far the lowest Lx/Lbol level of all cluster members (see Sect. 5.9).
The combination of the histograms (Figs. 3 and 4) corresponding to X-ray detection (dashed, red line) and non-detections (dashed-dotted line, in gray) may suggest that some solar-type cluster members, are missing, and that the existing surveys leave a gap around 1 M⊙. This could be owing to the lack of completeness for the bright and faints ends of overlapping surveys. Again, the small number of objects makes it difficult to establish this fact with a high degree of certainty. However, it is clear that previous photometric surveys in the optical missed some cluster members with masses around 0.3 M⊙ (specifically Dolan & Mathieu 1999; Barrado y Navascués et al. 2004b). Dolan & Mathieu (1999) did not reach this mass and since they were looking for strong emission in Hα (i.e., stars with accretion and/or stellar activity), the X-ray search is able to add new, fainter objects.
5.4. Spatial distribution for members with X-ray emission
We note that there is a dichotomy in the distribution of X-ray sources (already obvious in Fig. 1). Forty-eight members are located east of the central star λ Ori, whereas there are 20 west of this O8III star. This was already discussed in Barrado y Navascués et al. (2007) in the context of the distribution of members with circumstellar disks. In any event, our final cluster members have been displayed in Fig. 16 as solid circles (blue for probable members, and cyan for possible members). For the sake of homogeneity and clarity, we only represented cluster members in the mass range 0.3–1.2 M⊙. Non-detected cluster members in the same mass range were also included as solid triangles – dark gray.
One possible explanation would be the different effective exposure times for both XMM-Newton pointings (37 and 28 ks for east and west, respectively). Yet, this explanation seems unlikely or to be at least only partial, because the average for actual measurements and detection limits of Lx and Lx/Lbol are very similar in both pointings. Averages for the masses are slightly different (being 0.17 M⊙ higher for the western pointing), so it seems that the reason should lie on the actual distribution of cluster members.
Indeed, this dichotomy might be related to the original structure of the parental cloud. The large-scale structure of the Lambda Orionis Complex (the Head of Orion and related structures – see for instance a IRAS image1 of the region), and as discussed in Dolan & Mathieu (2002), suggests that some sort of large filament-like structure might be present, which was affected by a supernova explosion or, more likely, the strong winds from the O and early B stars located in the region.
Median X-ray luminosity and disk fraction for sub-samples of Collinder 69 representing different mass ranges.
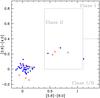 |
Fig. 10 Spitzer/IRAC color–color diagram for Collinder 69 for all X-ray sources with masses in the mass range 0.3–1.2 M⊙. Solid circles – blue – represent probable members identified in the XMM-Newton survey. The large, dotted circle (in black) represent one of the two objects with excess at 24 micron (the second one has no IRAC data). Previously known members from Dolan & Mathieu (1999), Barrado y Navascués et al. (2007) and Morales-Calderón (2008) within the XMM-Newton field-of-view and with no X-ray detections are included with plus – red – symbols. |
5.5. Disks in the X-ray sample and comparison with other subsamples
For those X-ray sources with complete IRAC data (four bands), there are only four X-ray sources (three probable and one possible member) that can be classified as Class II objects (or Classical TTauri stars), whereas there are 59 classified as Class III (for instance, a subsample with 0.3–1.2 M⊙ in Fig. 10, see next subsection).
Among the Class III subsample, four have thin disks, according to the slope of the IRAC data (C69-X-e009 and C69-X-e012) or as revealed by the presence of the flux at 24 micron (more precisely, transition disks, as in the case of C69-X-e030 and C69-X-w014). We do not have enough information for another three cluster members regarding the presence or absence of a circumstellar disk. However, the SED of C69-X-e041 (DM071), which is located outside of the IRAC mapping, suggests the presence of a circumstellar disk because of its excess at 24 micron.
Considering the whole sample of 63 probable and possible cluster members with four-band IRAC photometry in the XMM-Newton fields, the minimum disk fraction is 6.1% (Class II versus total) and 10.6% (disk versus total), respectively. Our sample is incomplete at low and high masses, and in any case we want to verify whether there is a dependence with mass. Therefore, we present in Table 13 the disk fractions for different mass ranges. Three of the four Class II objects have M < 0.5 M⊙. The lower fraction of disks among higher mass stars is consistent with results in other SFRs (see, for instance, Bayo 2009; or Lada et al. 2006; for IC348 or Scholz et al. 2007, in the case of Upper Sco).
5.5.1. The mass range 0.3–1.2 M⊙: comparison between homogeneous subsamples
We compared the disk fraction of different samples using the mass range 0.3–1.2 M⊙, common to all of them and without the presence of any obvious bias (for instance, owing to completeness limits).
In Fig. 10 we show Collinder 69 cluster members with masses in this range (0.3–1.2 M⊙) in the Spitzer/IRAC color–color diagram. The diagram includes the X-ray sources (solid circles, in blue) and non-detections within the XMM-Newton pointings (plus symbols, in red).
In the case of the Dolan & Mathieu (1999) sample (originally selected based on Hα photometry), which includes 14 members that are not listed in Barrado y Navascués et al. (2004b), there are two Class II objects plus one transition disk. This makes a disk fraction of 21.4%. If the only object without X-ray detection is removed (DM048, a Class II), the fraction goes down to 15.4%. Note, however, the low numbers, involving few stars. In an analogous way, for the CFHT1999 sample (Barrado y Navascués et al. 2004b; Barrado y Navascués et al. 2007), which contains 33 probable and possible members, the disk fraction is 3.0% for the undifferentiated sample, 3.7% for the members (27) with X-ray emission, and 0% for the upper limits (six members).
Finally, for the sample extracted with the XMM-Newton data (43 sources), three are Class II and another two have thin/transition disks (disk fraction of 7.0–11.6%). Among the nine members with X-ray upper limits, there are three with disks (all of them Class II, disk fraction of 33%). In total, regardless the X-ray detection, the disk fraction in the 0.3–1.2 M⊙ is 16.7%.
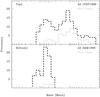 |
Fig. 11 Histograms for different samples – dashed, black lines with and without disks – and subsamples only with disks – solid, gray lines – as described in Sect. 5.3Subpanel at the top – Probable and possible members from Barrado y Navascués et al. (2004b) and Barrado y Navascués et al. (2007), with an initial selection based on optical photometry. Subpanel at the bottom – Members listed by Dolan & Mathieu (1999), originally selected from optical photometry (including narrow-band Hα – i.e., active stars or with accretion), and confirmed based on high-resolution spectroscopy. |
5.5.2. Disk fractions and the mass distribution
In order to clarify the issue of disk fraction in each subsample, we represented the star number versus the mass in another set of histograms (see Figs. 11 and 12). The top panel of Fig. 11 compares the distribution of cluster members extracted using optical photometry, from Barrado y Navascués et al. (2004b), with a subsample that has mid-infrared excesses, from Barrado y Navascués et al. (2007). A significant fraction do have circumstellar disks, but there is a strong dependency on mass, and the disk frequency is higher for low-mass members, peaking at 0.1 M⊙. This seems to reflect a larger time scale for the disk dissipation at the end of the Main Sequence, as already suggested by different authors (see, for instance, Barrado y Navascués & Martín 2003a). Figure 11 bottom panel displays more massive members, as selected by Dolan & Mathieu (1999), based on optical photometry, including Hα narrow-band photometry, and confirmed with high-resolution optical spectroscopy and properties such as radial velocity and the detection of the lithium doublet, a signpost of youth, at 6708 Å. In this particular case, the method seems to be very efficient for picking up Class III cluster members. That is, they are diskless, with high activity level probably due to lack of disk-locking. This might be because disks have been already dissipated for solar-type stars or because of an initial different distribution in the angular momentum (higher rotation rates). As shown by Bouvier et al. (1997), rotation increases notably during the first tens of million years. In particular, from ~1 to 5 Myr (Taurus and Collinder 69 ages, respectively).
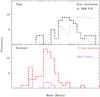 |
Fig. 12 Histograms for different samples – dashed, black lines with and with disks – and subsamples only with disks – solid, gray lines – as described in Sect. 5.3. Data in the XMM-Newton field-of-view. Subpanel at the top – In black-dashed and gray-solid the C69 members with X-ray upper limits, corresponding to the whole subsample and those members with disks. Subpanel at the bottom – In red-dashed and magenta-solid the C69 members with X-ray detections, also corresponding to the whole subsample and those members with disks. |
Finally, Fig. 12 contains four different distributions in two panels: two corresponding to cluster members with X-ray detections (dashed-red for the whole sample and solid-magenta for those with mid-IR excesses), and another two for cluster members within the XMM-Newton field-of-view with only upper limits (dashed-black for the whole sample and solid-gray for those with mid-IR excesses). Clearly, both sets are very different, peaking at ~0.6 and ~0.15 M⊙, respectively. This is probably because of the sensitivity limit of our XMM-Newton imaging, but it may also be related to intrinsic properties of very low-mass stars and brown dwarfs, in the sense that different empirical studies have found a correlation between X-ray activity and mass (the lower the mass, the lower the coronal emission). And, again, the disk fractions are very different: almost negligible for the X-ray sample, close to half of them for the X-ray non-detected members. Naively, one may think that this is a consequence of the technique we are using, since X-ray data are very efficient for selecting Class III stars known to have strong coronal activity, and the low-mass sample is dominated by less active Class II objects (Classical TTauri). However, the average difference between the X-ray luminosities of Class II and Class III objects is a factor two at most (e.g. Preibisch et al. 2005; Telleschi et al. 2007), and cannot explain a strong bias of the X-ray selection against diskless stars. We note that we do not have rotational velocities or rotational periods, but the low-disk fraction in the X-ray detected sample (mostly Class III) is likely not directly connected to rotation because Preibisch et al. (2005) and Briggs et al. (2007) have found that at least for ~1 Myr stellar associations such as Orion and Taurus there is no rotation/activity connection in pre-MS stars.
Most members from Dolan & Mathieu (1999) have been detected in X-ray (not surprising, since the were selected based on their chromospheric activity or accretion rate), and about a quarter of them have disks. The disk fraction of the X-ray sample is much lower than the Dolan & Mathieu (1999) (a fourth), and almost a third of the probable and possible Collinder 69 members with no X-ray detections have a circumstellar disk.
5.5.3. Disks for higher masses
Our sample of X-ray sources does not contain any Class II object with mass M > 1.2 M⊙ (16 probable and possible cluster members). However, two probable members have thin disks and another one presents excess at 24 micron, which is a characteristic of a transition disk. Nine are diskless and another two do not have enough information. Therefore, the disk fraction seems to be around 25%. However, these disks are in general more evolved than those found for the mass range 0.3–1.2 M⊙, suggesting again a different time scale for disk dissipation, which is faster for more massive objects.
5.6. The completeness of the Collinder 69 census
As discussed above (see also Figs. 11 and 12), most Class II sources – whether detected in X-rays or not – seem to be of very low-mass. The disk fraction for the higher-mass stars (M > 0.3−0.5 M⊙) is very low. However, the disk fraction for masses below 0.3 M⊙ is much higher. This dichotomy might mean that a very large number of very low-mass stars and brown dwarfs without disks is still undiscovered and that our X-ray observations were not sensitive enough for them. As a consequence, the derived cluster mass function would be very incomplete.
According to Morales-Calderón (2008) and Bayo (2009), the disk fraction among very low-mass stars and brown dwarfs in Collinder 69 is higher than for more massive objects. This has been observed in other clusters (like Upper Sco, Scholz et al. 2007; and Bouy et al. 2007; or see the general comparison in Barrado y Navascués & Martín 2003b). This can be interpreted as proof that low-mass objects have disks that last longer.
Two questions have to be considered: most of our low-mass members come from the CFHT1999 optical survey, which should be independent of the presence of disks and the level of X-ray emission. In principle, only few underluminous members, such as edge-on disks (see the case of LS-CrA 1 in Fernández & Comerón 2001; Barrado y Navascués et al. 2004a; or Par-Lup-3-4, Huelamo et al. 2010) may have been overlooked. On the other hand, the initial mass function has been derived by several authors (Barrado y Navascués et al. 2004b; Bayo 2009), even covering a very large mass range (from 20 to 0.02 M⊙, Barrado y Navascués et al. 2005) and it seems canonical. In recent comparisons with a large number of associations, Bouvier (2009, private communication) has shown that the log-form is very similar for all of them. Therefore, the completeness of our census of Collinder 69 members should be located at very low masses, well below the substellar limit.
In any event, this discussion about the completeness of the Collinder 69 census does not affect the present analysis of the X-ray properties because the mass range covered does not reach below 0.3 M⊙. A discussion about the Collinder 69 census will be presented in Morales-Calderón et al. (2010) and Bayo et al. (2010).
5.7. X-ray hardness ratios
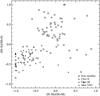 |
Fig. 13 X-ray hardness ratios for sources detected with EPIC/pn. Collinder 69 members, belonging to different young stellar object classes with different plotting symbols, and non-members are represented by squares. |
We examined the X-ray hardness ratios for all 124 X-ray sources detected on EPIC/pn. In principle, an analogous analysis can be done for EPIC/MOS hardness ratios. However, the EPIC/pn detections comprise more than 75 % of the X-ray sources and not much information would be added by considering the remaining objects. In Fig. 13 we show one of various combinations of EPIC/pn hardness diagrams computed from the counts in the S, M, and H band. We distinguish Collinder 69 members belonging to different young stellar object classes with different plotting symbols, and non-members are represented by squares.
From Fig. 13 it is evident that the cluster stars are characterized by relatively soft X-ray emission, while most of the objects classified as non-members on basis of optical and IR data have a much harder emission. This is expected for objects in the distant background whose soft photons are removed by interstellar extinction. This separation of cluster members and non-members in the hardness plot lends additional support to our candidate selection criteria described in the previous section.
5.8. X-ray spectra
Spectra were analyzed for all X-ray sources detected on at least one of the individual EPIC detectors. Among the 124 X-ray sources seen on EPIC/pn there are 59 Collinder 69 members, and among the additional 23 X-ray sources present on EPIC/MOS there are 6 Collinder 69 members. One Collinder 69 member (C69-X-e105) is detected only in the merged pn+MOS dataset and has no spectral fit.
Below, we evaluate only the results from EPIC/pn. This is our “prime” choice for most sources according to Col. #2 of Tables 3 and 4 because of its higher sensitivity with respect to EPIC/MOS. According to the criteria described in Sect. 2.1, the spectra of 40 Collinder 69 members could be adequately fitted with a 1-T model and 19 required a 2-T approach. There are two EPIC/pn sources for which even a 2-T model does not provide a statistically acceptable fit (P(χ2 > χ0) < 0.05). Most of the sources have spectra of only moderate quality and we abstain from a detailed discussion of individual source spectra. We are especially interested to use the information from the spectral fitting for deriving X-ray luminosities.
The median gas absorption column of the 59 Collinder 69 members with EPIC/pn spectrum is (NH)med ~ 5 × 1020 cm-2. This low absorption agrees well with the average dust extinction AV = 0.38 mag of Collinder 69 (Diplas & Savage 1994), which corresponds to NH ~ 7 × 1020 cm-2 for standard gas/dust extinction conversions (Ryter 1996). A small number of stars, exhibit much higher NH according to the spectral analysis. However, all of these have either very poor statistics or the fit yields an untypically low temperature combined with extremely high emission measure to compensate for the strong absorption. In these latter cases, the fitting procedure likely ended up in an unphysical χ2 minimum. The median X-ray temperature derived from the spectral models is (log T)med [K] ~ 7.0 with a standard deviation of 0.31 logarithmic dex.
5.9. X-ray luminosities
The most accurate way of computing X-ray luminosities is to infer them from spectral fitting on an individual basis. However, most X-ray sources in Collinder 69 are fairly faint and occasionally the fitting procedure results in unphysical parameters (see above). Therefore, we prefer the use of a global count-rate to flux conversion (CF) based on an average spectrum for Collinder 69. We base the computation of X-ray luminosities on a 1-T thermal model with plasma temperature and absorbing column corresponding to the median values derived above from the EPIC/pn spectra, i.e. (log T)med [K] ~ 7.0 and NH ~ 5 × 1020 cm-2. Among the X-ray sources with statistically acceptable spectral fits the 50% quartile range for NH is 0.03−0.12 × 1022 cm-2 and for log T it is 6.93–7.16. For the median values of temperature and column density, PIMMS2 yields CF = 8.6 × 10⁻¹² cts/erg/cm2 for the conversion of the 0.5−7.3 keV MOS count rate into a 0.5–8 keV absorption-corrected flux. The CF is not strongly dependent on small variation of the temperature (it changes by < 20% for the observed spread of X-ray temperatures).
In Table 10, we present the X-ray luminosities and Lx/Lbol ratios for all confirmed and suspected Collinder 69 members, and Tables 11 and 12 include the upper limits of the X-ray luminosities and Lx/Lbol ratios of undetected cluster members (for the XMM-Newton fields C69 E and C69 W, respectively.).
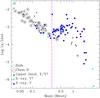 |
Fig. 14 Fractional X-ray luminosity as a function of mass for Collinder 69 members within the field-of-view of the two XMM-Newton observations. X-ray detections are represented as solid circles (blue and cyan for probable and possible members, respectively). Cluster members without X-ray detection appear as solid – dark gray – triangles. Class II and Class III sources with thick or thin/transition disks, as defined by IRAC photometry, are highlighted with large solid and dotted open circles, respectively. The vertical dotted and long-dashed – magenta – line locates the completeness limit (in mass) of the X-ray observations. |
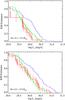 |
Fig. 15 X-ray luminosity functions for Collinder 69 (red, thin line) compared to those of NGC 2264 (green, thick line) and the ONC (blue, dotted line). From top to bottom the mass ranges 0.3−0.5 M⊙ and 0.5−0.9 M⊙ are shown. See text in Sect. 5.9 for more details. |
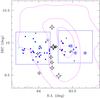 |
Fig. 16 Spatial distribution of the stellar population in Collinder 69 in the mass range 0.3–1.2 M⊙. X-ray detections are represented as solid circles (blue for probable and possible members). Cluster members without X-ray detection appear as solid – dark gray – triangles. Class II, as defined by IRAC photometry, are highlighted with large solid open circles. |
The fractional X-ray luminosity, log (Lx/Lbol), as a function of stellar mass is shown in Fig. 14. The mean level for stars with M ≤ 1 M⊙ is log (Lx/Lbol) = −2.85 with a spread of ~1.5 dex. For higher-mass stars (starting at M ~ 2 M⊙) the typical decline of the Lx/Lbol ratio is seen. The two highest-mass stars in our sample (C69-X-e013 and C69-X-e042, both newly identified as Collinder 69 members) with M ~ 3 M⊙ have by far the lowest Lx/Lbol levels. Indeed, according to Siess et al. (2000), they are the only two stars with very shallow convective envelopes (< 1% of the stellar radius). Their fractional X-ray luminosities are similar to those of Herbig Ae/Be stars (see Stelzer et al. 2009). Note, however, that C69-X-e013 and C69-X-e042 are Class III objects (based on the SED and the lack of excess at 24 micron), i.e. they represent a more evolved phase than Herbig stars. In Fig. 14, X-ray sources and upper limits within the XMM-Newton field-of-view are displayed as solid circles (blue and cyan for probable and possible members) and inverted triangles (dark gray). Class II objects and transition/thin disks, as defined by the use of IRAC photometry (Fig. 10 and the IRAC slope) are highlighted by large circles with solid and dotted lines, respectively.
A few facts that can be noted from Fig. 14 are:
-
(i)
Only three Class II sources with masses >0.3 M⊙ (probable members) are detected in X-rays, whereas the very low-mass regime (M < 0.3 M⊙) is dominated by upper limits of Class II sources. This may partly be owing to the limited sensitivity of our X-ray observations (as described before, ~0.3 M⊙), and the subsequent bias of the cluster sample toward stars with IR excess in the very low-mass regime. That is, we believe we have obtained a nearby complete census for solar-like stars, because all our surveys and techniques go down to this mass limit, but some low-mass members without IR excess may have remained unidentified. However, the number of missing members cannot be significant, as discussed in Sect. 5.6, because the cluster mass function looks comparable to those corresponding to well known stellar association in its power-law or lognormal form (Barrado y Navascués et al. 2004b; Barrado y Navascués et al. 2005; Bayo 2009; Bouvier 2009, priv. comm.).
-
(ii)
The stars with the highest masses have no young stellar object classification because of incomplete Spitzer photometry related to their brightness (the cyan solid circles at M ~ 3 M⊙).
-
(iii)
A few stars are detected above the average saturation level log (Lx/Lbol) ~ −3. However, as we verified from the analysis of their X-ray light-curves none of them has shown a flare.
-
(iv)
One faint object, with a mass estimate about 0.035 M⊙ has been detected in the XMM-Newton survey (C69-X-w028). We classified it as possible member based on our selection criteria (see Sect. 4). The high X-ray activity level combined with very low mass suggests it might be a non-member. If its membership is confirmed, it would be one of the least massive brown dwarfs detected in X-rays. Additional data (i.e., spectroscopy) are required to determine its nature and membership to the cluster.
6. Conclusions and summary
We report first results from our XMM-Newton based multi-wavelength project XILO to study the LOSFR. We updated the young stellar object census for the central cluster of the LOSFR, Collinder 69. We detected 164 sources in our two X-ray images, located east and west of the hot star λ Ori (actually, a close, massive visual binary). By combining with our optical/IR database and through a careful selection process using optical/IR CMD and CCDs, we evaluated cluster membership for all detected X-ray sources and provide a new, more complete and unbiased cluster census, specially adding new members with masses about 2 M⊙. Out of the 164 X-ray sources, only approximately 40% turned out to be members. The remainder are mostly quasars and AGN, as judging from the expected number of extragalactic objects in our X-ray images and the X-ray to optical flux ratios, fx/fopt. With our multi-wavelength approach, we were able to identify these pollutants from the true census of cluster members. We identified three possible companions to our X-ray members, which fulfill the membership criteria. Therefore, we detected in X-rays a total of 61 and 5 probable and possible members, respectively (without including the three possible companions to cluster members with X-ray emission). Most of them have been known from previous surveys, but 16 are newly identified probable cluster members, and three are additional new possible members.
We estimate our completeness limit – for cluster members– of the X-ray data to be ~0.3 M⊙, based on the histograms displayed in Figs. 3 and 4, and the peaks of the distributions. This is in agreement with the estimated sensitivity limit of XILO, Lx ~ 1029 erg/s according to the empirical Lx − M relation derived for pre-MS stars in Orion. Therefore, the non-detection of very low-mass stars and substellar objects in Collinder 69 is not surprising. We detect only one possible brown dwarf, C69-X-w028, which might actually be a non-member. Additional data, specially spectroscopy, will eventually allow us to establish whether this object belongs to the stellar association.
In principle, the Collinder 69 sample is a particularly reliable testbed for measuring X-ray temperatures, because the generally low NH reduces biases in the spectral fitting process. Indeed, an anti-correlation between X-ray temperature and absorbing column density for the few cluster members with log NH [cm-2] > 21.5 can be explained by a known bias of the fitting procedure. We find no other trends between spectral parameters. The photon statistics of most sources are low and and we thought a detailed discussion of the individual X-ray spectra unnecessary” (and inaccurate). The mean temperature of log T [K] ~ 7.0 is similar to those of the coronae of young main-sequence stars (Briggs & Pye 2003), but somewhat lower than the temperatures found in the youngest star-forming regions (e.g. Preibisch et al. 2005). Even the NGC 2264 cluster (~3 Myr), shows higher average X-ray plasma temperature (1.3−1.5 keV for CTTS and wTTS, respectively; Flaccomio et al. (2006). This hints at an age older than 3 Myr for Collinder 69. On the other hand, the XLF of Collinder 69 agrees very well with that of NGC 2264, suggesting a similar age of the two clusters. Note that Collinder 69 cannot be older than about 7 Myr, because of the presence of the central, very massive star λ Ori.
Stellar properties such as effective temperatures, bolometric luminosities, masses and presence of circumstellar disk have been derived for cluster members falling within the two XMM-Newton pointings, independently of whether they are detected or not in X-rays. We have done so using a Virtual Observatory tool (VOSA, Bayo et al. 2008) in an homogeneous way. The same procedure was carried out with a larger sample (covering a larger area) in the cluster. The spatial dichotomy observed previously in the distribution of members with more stars east of λ Orionis than west (in particular those diskless versus those with disks) are reproduced with our updated cluster sample.
We derived the disk fraction for the XILO sample using Spitzer mid-infrared photometry and compared it with other samples for Collinder 69 extracted with different techniques. For Class II members, we have 6.1%, whereas when we take into account thin and transition disk, it increases up to 10.6%. Most members from Dolan & Mathieu (1999) – solar-like – are detected in X-rays (not surprising, because they were selected based on their chromospheric activity or high accretion rate), and about a quarter of them have disks. Therefore, the disk fraction of the XILO sample is much lower than that of the sample of Dolan & Mathieu (1999). This difference between the disk fraction is more striking when the XILO sample is compared with cluster members not detected in X-rays. More than half of the probable and possible Collinder 69 members with no X-ray detection – mostly low-mass stars and brown dwarfs- have a circumstellar disk. Therefore, it seems that there are significant differences, which are mass-dependant, despite the low number of stars.
The small disk fraction is a characteristic of Collinder 69 members with masses around ~1 M⊙, as discussed in Sect. 5.5. However, the measured disk fraction for very low-mass stars and brown dwarfs – mostly undetected in X-rays – is significantly higher than for more massive members – of which most are detected in X-rays. If the real disk fraction were similarly low for both groups, the majority of diskless objects with the smallest masses in Collinder 69 would still be undiscovered. X-ray observations would be an adequate tool for identifying such objects, but these new observations would have to be at least one order of magnitude deeper than XILO, our actual survey. Yet, because the mass function of the cluster has been shown to be similar to that corresponding to other associations, we do not believe this is the case, and therefore it seems there is a significant dichotomy between the disk fraction of solar-like and very low-mass members. The obvious, simplest interpretation is a longer dissipation time-scale for disks around low-mass objects. This result has been already established in young cluster such as IC 348 (Lada et al. 2006), or suggested in larger samples (Barrado y Navascués & Martín 2003b). Our results suggest that Collinder 69 seems to be at a critical age, about 5 Myr, for disk dissipation, and, therefore, it can provide an interesting stepping stone to understand disk evolution.
Our improved census of cluster members would allow us to derive a more accurate IMF and compare it with those of other SFRs. However, since our XMM-Newton survey covers a limited area overlapping our previous optical and infrared surveys Barrado y Navascués et al. (2004b, 2007); Morales-Calderón (2008), and the overall shape of the IMF (for instance, the slopes in the mass spectrum form) is not affected in significant way by the new cluster members, we refer the reader to upcoming papers where we analyze photometry and spectroscopy (Morales-Calderón et al. 2010; and Bayo et al. 2010, both in prep.).
Finally, we have shown that only an ambitious study involving the use of different techniques with multi-wavelength coverage avoid most of the biases present in more limited surveys based on few photometric bands, since they left out potential cluster members. In addition, the proper interpretation of any observed phenomenology (disk fraction and properties, evolution of activity) greatly benefit from a large, comprehensive database.
One missing piece of information of the Collinder 69 population is a systematic assessment of rotation. Several previous works (Stelzer et al. 2003; Preibisch et al. 2005; Briggs et al. 2007) have focused on the X-ray activity − rotation connection on the pre-MS. Contrary to early findings, it seems now that T Tauri stars occupy the saturated regime of the X-ray/rotation relation, and therefore Lx is not correlated with rotation. Testing this scenario for Collinder 69 requires high resolution spectroscopy and a systematic monitoring to derive rotational periods.
Online material
X-ray sources detected with ML > 15.0 in the EPIC observation of Collinder 69, East field (C69E).
X-ray sources detected with ML > 15.0 in the EPIC observation of Collinder 69, West field (C69W).
Optical and infrared photometry for all the 205 counterparts for 164 X-ray sources of Collinder 69 (eastern XMM-Newton pointing or Col 69 E). 20091001, final version, after C69*.final.dat.
Optical and infrared photometry for all the 205 counterparts for 164 X-ray sources of Collinder 69 (western XMM-Newton pointing or Col 69 W).
Membership criteria and other information for X-ray sources of Collinder 69 (eastern XMM-Newton pointing or Col 69 E).
Membership criteria and other information for X-ray sources of Collinder 69 (western XMM-Newton pointing or Col 69 W).
PIMMS is accessible at http://asc.harvard.edu/toolkit/pimms.jsp
Acknowledgments
We thank the Calar Alto Observatory, specially J. Alves, for the allocation of director’s discretionary time to this program. B.S. wishes to thank E. Flaccomio for stimulating discussions. Discussions about the properties of extragalactic sources with Almudena Alonso Herrero were also very revealing. The careful reading by the referee, Manuel Guedel, and his suggestions, have been very helpful. This research has been funded by Spanish grants ESP2007-65475-C02-02, CSD2006-00070 and PRICIT-S2009/ESP-1496. B.S. has been supported by ASI/INAF contract I/088/06/0. The support of the ESAC faculty is also recognized. It makes use of VOSA, developed under the Spanish Virtual Observatory project supported from the Spanish MICINN through grant AyA2008-02156, and of the SIMBAD database, operated at CDS, Strasbourg, France.
References
- Adams, F. C., Lada, C. J., & Shu, F. H. 1987, ApJ, 312, 788 [NASA ADS] [CrossRef] [Google Scholar]
- Allen, L. E., Calvet, N., D’Alessio, P., et al. 2004, ApJS, 154, 363 [NASA ADS] [CrossRef] [Google Scholar]
- Baldi, A., Molendi, S., Comastri, A., et al. 2002, ApJ, 564, 190 [NASA ADS] [CrossRef] [Google Scholar]
- Baraffe, I., Chabrier, G., Allard, F., & Hauschildt, P. H. 1998, A&A, 337, 403 [NASA ADS] [Google Scholar]
- Baraffe, I., Chabrier, G., Allard, F., & Hauschildt, P. H. 2002, A&A, 382, 563 [NASA ADS] [CrossRef] [EDP Sciences] [Google Scholar]
- Barger, A. J., Cowie, L. L., Capak, P., et al. 2003, AJ, 126, 632 [NASA ADS] [CrossRef] [Google Scholar]
- Barrado y Navascués, D., & Martín, E. L. 2003a, AJ, 126, 2997 [NASA ADS] [CrossRef] [Google Scholar]
- Barrado y Navascués, D., & Martín, E. L. 2003b, AJ, 126, 2997 [NASA ADS] [CrossRef] [Google Scholar]
- Barrado y Navascués, D., Mohanty, S., & Jayawardhana, R. 2004a, ApJ, 604, 284 [NASA ADS] [CrossRef] [Google Scholar]
- Barrado y Navascués, D., Stauffer, J. R., Bouvier, J., Jayawardhana, R., & Cuillandre, J.-C. 2004b, ApJ, 610, 1064 [NASA ADS] [CrossRef] [Google Scholar]
- Barrado y Navascués, D., Stauffer, J. R., & Bouvier, J. 2005, in The Initial Mass Function 50 Years Later, ed. E. Corbelli, F. Palla, & H. Zinnecker, Astrophys. Space Sci. Lib., 327, 133 [Google Scholar]
- Barrado y Navascués, D., Stauffer, J. R., Morales-Calderón, M., et al. 2007, ApJ, 664, 481 [NASA ADS] [CrossRef] [Google Scholar]
- Bayo, A. 2009, Ph.D. Dissertations, Universidad Autónoma de Madrid [Google Scholar]
- Bayo, A., Rodrigo, C., Barrado y Navascués, D., et al. 2008, A&A, 492, 277 [NASA ADS] [CrossRef] [EDP Sciences] [Google Scholar]
- Bouvier, J., Forestini, M., & Allain, S. 1997, A&A, 326, 1023 [NASA ADS] [Google Scholar]
- Bouy, H., Huélamo, N., Martín, E. L., et al. 2007, A&A, 463, 641 [NASA ADS] [CrossRef] [EDP Sciences] [Google Scholar]
- Bouy, H., Huélamo, N., Barrado y Navascués, D., et al. 2009, A&A, 504, 199 [NASA ADS] [CrossRef] [EDP Sciences] [Google Scholar]
- Briggs, K. R., & Pye, J. P. 2003, MNRAS, 345, 714 [NASA ADS] [CrossRef] [Google Scholar]
- Briggs, K. R., Güdel, M., Telleschi, A., et al. 2007, A&A, 468, 413 [NASA ADS] [CrossRef] [EDP Sciences] [Google Scholar]
- Castelli, F., Gratton, R. G., & Kurucz, R. L. 1997, A&A, 318, 841 [NASA ADS] [Google Scholar]
- Chabrier, G., Baraffe, I., Allard, F., & Hauschildt, P. 2000, ApJ, 542, 464 [NASA ADS] [CrossRef] [Google Scholar]
- Cutri, R. M., Skrutskie, M. F., van Dyk, S., et al. 2003, 2MASS All Sky Catalog of point sources, The IRSA 2MASS All-Sky Point Source Catalog, NASA/IPAC Infrared Science Archive, http://irsa.ipac.caltech.edu/applications/Gator/ [Google Scholar]
- Diplas, A., & Savage, B. D. 1994, ApJ, 427, 274 [NASA ADS] [CrossRef] [Google Scholar]
- Dolan, C. J., & Mathieu, R. D. 1999, AJ, 118, 2409 [NASA ADS] [CrossRef] [Google Scholar]
- Dolan, C. J., & Mathieu, R. D. 2001, AJ, 121, 2124 [NASA ADS] [CrossRef] [Google Scholar]
- Dolan, C. J., & Mathieu, R. D. 2002, AJ, 123, 387 [NASA ADS] [CrossRef] [Google Scholar]
- Fazio, G. G., Hora, J. L., Allen, L. E., et al. 2004, ApJS, 154, 10 [NASA ADS] [CrossRef] [Google Scholar]
- Feigelson, E. D., & Nelson, P. I. 1985, ApJ, 293, 192 [NASA ADS] [CrossRef] [Google Scholar]
- Fernández, M., & Comerón, F. 2001, A&A, 380, 264 [NASA ADS] [CrossRef] [EDP Sciences] [Google Scholar]
- Flaccomio, E., Micela, G., & Sciortino, S. 2006, A&A, 455, 903 [NASA ADS] [CrossRef] [EDP Sciences] [Google Scholar]
- Getman, K. V., Feigelson, E. D., Grosso, N., et al. 2005a, ApJS, 160, 353 [NASA ADS] [CrossRef] [Google Scholar]
- Getman, K. V., Flaccomio, E., Broos, P. S., et al. 2005b, ApJS, 160, 319 [NASA ADS] [CrossRef] [Google Scholar]
- Grazian, A., Fontana, A., de Santis, C., et al. 2006, A&A, 449, 951 [NASA ADS] [CrossRef] [EDP Sciences] [Google Scholar]
- Harvey, P. M., Chapman, N., Lai, S., et al. 2006, ApJ, 644, 307 [NASA ADS] [CrossRef] [Google Scholar]
- Hatziminaoglou, E., Fritz, J., Franceschini, A., et al. 2008, MNRAS, 386, 1252 [NASA ADS] [CrossRef] [Google Scholar]
- Hernández, J., Calvet, N., Hartmann, L., et al. 2009, ApJ, 707, 705 [NASA ADS] [CrossRef] [Google Scholar]
- Huelamo, N., Bouy, H., Pinte, C., et al. 2010, A&A, 521, L54 [NASA ADS] [CrossRef] [EDP Sciences] [Google Scholar]
- Jansen, F., Lumb, D., Altieri, B., et al. 2001, A&A, 365, L1 [NASA ADS] [CrossRef] [EDP Sciences] [Google Scholar]
- Lada, C. J. 1987, in Star Forming Regions, ed. M. Peimbert, & J. Jugaku, IAU Symp., 115, 1 [Google Scholar]
- Lada, C. J., Muench, A. A., Luhman, K. L., et al. 2006, AJ, 131, 1574 [NASA ADS] [CrossRef] [Google Scholar]
- Luhman, K. L., Whitney, B. A., Meade, M. R., et al. 2006, ApJ, 647, 1180 [NASA ADS] [CrossRef] [Google Scholar]
- Makovoz, D., & Marleau, F. R. 2005, PASP, 117, 1113 [NASA ADS] [CrossRef] [Google Scholar]
- Mason, K. O., Breeveld, A., Much, R., et al. 2001, A&A, 365, L36 [NASA ADS] [CrossRef] [EDP Sciences] [Google Scholar]
- Morales-Calderón, M. 2008, Ph.D. Dissertations, Universidad Autónoma de Madrid [Google Scholar]
- Murdin, P., & Penston, M. V. 1977, MNRAS, 181, 657 [NASA ADS] [CrossRef] [Google Scholar]
- Preibisch, T., Kim, Y.-C., Favata, F., et al. 2005, ApJS, 160, 401 [NASA ADS] [CrossRef] [Google Scholar]
- Rieke, G. H., Young, E. T., Engelbracht, C. W., et al. 2004, ApJS, 154, 25 [NASA ADS] [CrossRef] [Google Scholar]
- Ryter, C. E. 1996, Ap&SS, 236, 285 [NASA ADS] [CrossRef] [Google Scholar]
- Sacchi, N., La Franca, F., Feruglio, C., et al. 2009, ApJ, 703, 1778 [NASA ADS] [CrossRef] [Google Scholar]
- Sacco, G. G., Franciosini, E., Randich, S., & Pallavicini, R. 2008, A&A, 488, 167 [NASA ADS] [CrossRef] [EDP Sciences] [Google Scholar]
- Scholz, A., Jayawardhana, R., Wood, K., et al. 2007, ApJ, 660, 1517 [NASA ADS] [CrossRef] [Google Scholar]
- Siess, L., Dufour, E., & Forestini, M. 2000, A&A, 358, 593 [NASA ADS] [Google Scholar]
- Stelzer, B., Huélamo, N., Hubrig, S., Zinnecker, H., & Micela, G. 2003, A&A, 407, 1067 [NASA ADS] [CrossRef] [EDP Sciences] [Google Scholar]
- Stelzer, B., Robrade, J., Schmitt, J. H. M. M., & Bouvier, J. 2009, A&A, 493, 1109 [NASA ADS] [CrossRef] [EDP Sciences] [Google Scholar]
- Strüder, L., Briel, U., Dennerl, K., et al. 2001, A&A, 365, L18 [NASA ADS] [CrossRef] [EDP Sciences] [Google Scholar]
- Surace, J. A., Sanders, D. B., & Mazzarella, J. M. 2004, AJ, 127, 3235 [NASA ADS] [CrossRef] [Google Scholar]
- Telleschi, A., Güdel, M., Briggs, K. R., Audard, M., & Palla, F. 2007, A&A, 468, 425 [Google Scholar]
- Turner, M. J. L., Abbey, A., Arnaud, M., et al. 2001, A&A, 365, L27 [NASA ADS] [CrossRef] [EDP Sciences] [Google Scholar]
All Tables
Summary with the source of the optical and infrared photometry or the 205 counterparts of the 164 XMM-Newton sources, and some properties of the possible and probable members.
Properties for our probable and possible X-ray candidate members of Collinder 69, after the selection process.
Stellar parameters and X-ray upper limits for probable and possible members of Collinder 69 (taken from D&M1999, ByN2004 and Morales 2008) that are undetected in X-rays (easter pointing – Col69 E).
Stellar parameters and X-ray upper limits for probable and possible members of Collinder 69 (taken from D&M1999, ByN2004 and Morales 2008) that are undetected in X-rays (western pointing –Col69 W).
Median X-ray luminosity and disk fraction for sub-samples of Collinder 69 representing different mass ranges.
X-ray sources detected with ML > 15.0 in the EPIC observation of Collinder 69, East field (C69E).
X-ray sources detected with ML > 15.0 in the EPIC observation of Collinder 69, West field (C69W).
Optical and infrared photometry for all the 205 counterparts for 164 X-ray sources of Collinder 69 (eastern XMM-Newton pointing or Col 69 E). 20091001, final version, after C69*.final.dat.
Optical and infrared photometry for all the 205 counterparts for 164 X-ray sources of Collinder 69 (western XMM-Newton pointing or Col 69 W).
Membership criteria and other information for X-ray sources of Collinder 69 (eastern XMM-Newton pointing or Col 69 E).
Membership criteria and other information for X-ray sources of Collinder 69 (western XMM-Newton pointing or Col 69 W).
All Figures
|
Fig. 1 Merged images of XMM-Newton’s EPIC pn, MOS 1 and MOS 2 for Collinder 69 eastern and western fields (Col 69 E and Col 69 W). |
| In the text | |
|
Fig. 2 The young cluster Collinder 69, with the surveys we have conducted so far at different wavelengths. The black rectangle represents the CFHT1999 RIc survey, the red squares the near-IR data (JHKs) from Omega2000 (thick lines for the deep image), whereas the IRAC mapping is represented with dashed, cyan lines. Finally, our two XMM-Newton FOVs are located with blue, dotted squares. O and B stars are represented by four-point stars, with increasing size related to increasing brightness. Our final cluster members (see Sect. 4.4) are represented as solid circles (blue for probable members, cyan for possible members). The magenta contours corresponds to IRAS data at 100 micron. |
| In the text | |
|
Fig. 3 Histograms for different samples (and subsamples) described in Sect. 3 and identified with different techniques: optical, mid-infrared, and X-rays. The vertical dotted and long-dashed – magenta – segments locate the detection limit of each survey for cluster members. In these three subpanels – a top, middle and bottom, solid – black – lines correspond to the whole sample analyzed in each subpanel; dotted – gray – lines are used for subsamples spatially included in the XMM-Newton field-of-view, whereas dashed – red – lines describe the data with X-ray detections. Subpanel at the top – Probable and possible members from Barrado y Navascués et al. (2004b) and Barrado y Navascués et al. (2007), with an initial selection based on optical photometry. The less massive objects detected in the XMM-Newton data are LOri-CFHT-090 and LOri-CFHT-098, with ~0.12 M⊙. Subpanel in the middle – Members listed by Dolan & Mathieu (1999), originally selected from optical photometry (including narrow-band Hα – i.e., active stars or with accretion), and confirmed based on high-resolution spectroscopy. The thick dotted long-dashed – silver – histogram includes members in common with Barrado y Navascués et al. (2004b). The completeness limits correspond to the whole photometric survey described in Dolan & Mathieu (1999) and Dolan & Mathieu (2002) –0.35 and 0.22 M⊙, respectively. Subpanel at the bottom – New members from Morales-Calderón (2008), composed by Class II sources (Classical TTauri stars and few members with transition disks). Initial selection based on mid-IR data from Spitzer. |
| In the text | |
|
Fig. 4 Subpanel at the top – The X-ray sample of C69 members – dashed, red line – (i.e., possible and probable Collinder 69 members with X-ray detections) based on XMM-Newton data. The dotted and long-dashed – grey – represents previously known Collinder 69 members – probable and possible – with no X-ray (only upper limits). Subpanel at the bottom – We highlight in blue the new probable and possible members identified with detections by XMM-Newton (16 probable and 6 possible new members). |
| In the text | |
|
Fig. 5 Comparison of V magnitudes measured with the OM and from the literature for optical counterparts to EPIC sources in Collinder 69: filled symbols – C 69 E, open symbols – C 69 W. The good agreement shows that OM photometry is reliable and that the errors associated with the transformation of instrumental into standard magnitudes for the C 69 W field are negligibly small. |
| In the text | |
|
Fig. 6 This graph allows the identification of contamination by quasars: previously known members of Collinder 69 from Dolan & Mathieu (1999) and Barrado y Navascués et al. (2004b, 2007) are displayed as green crosses and open circles (for Class III and II members, respectively). Quasars observed by the SWIRE team (Harvey et al. 2006) appear as gray open triangles. Counterparts to our XMM-Newton X-ray sources are shown as as black circles over-imposed by big red crosses (for quasars, rejected as cluster members based on this diagram) and as solid black circles (other sources, including possible cluster members and other contaminants). After Bouy et al. (2009). |
| In the text | |
|
Fig. 7 HR diagram with our rejection of non-members based on their location (solid circles with over-imposed big crosses – magenta – for non-members below the Main-Sequence). Other possible non-members, immediately above and below the cluster sequence are displayed as magenta triangles. Previously rejected quasars are displayed as solid circles with over-imposed big crosses – in gray. Other candidate members, not rejected by this test, are shown as solid black circles. Some will be later removed from the membership list using other color–color and color–magnitude diagrams. Previously known members for the cluster appear as green crosses (Class III) or open green circles (Class II), and were selected from Dolan & Mathieu (1999), Barrado y Navascués et al. (2007) and Morales-Calderón (2008). Isochrones correspond to Siess et al. (2000) – 1, 3, 5, 7, 10, 15, 20, 30, 50 and 100 Myr – and COND models – 1, 5, 10, 100, 1000 and 10 000 Myr – from the Lyon group (Baraffe et al. 2002; or Chabrier et al. 2000). |
| In the text | |
|
Fig. 8 Optical, near- and mid-IR color–color and color–magnitude diagrams of counterparts to X-ray sources in the Collinder 69 cluster and comparison with other samples. Small solid circles – blue and cyan – represent probable and possible (Y?) members of the cluster, whereas solid triangles – red and magenta – correspond to the location of probable (NM) and possible (NM?) non-members. Class II stellar objects are identified as big open, black circles. Previously known members for the cluster appear as green crosses (Class III) or open green circles (Class II), and were selected from Dolan & Mathieu (1999), Barrado y Navascués et al. (2007) and Morales-Calderón (2008). The asterisks represent the location of Taurus known members, with photometry coming from Luhman et al. (2006). The extragalactic samples were selected from Sacchi et al. (2009), and correspond to the SWIRE/XMM-Newton/ELAIS-S1 Field with spectroscopic data. Up- and down-ward open triangles – light gray – correspond to the AGN1 – QSO1, broad lines – and AGN2 – obscured QSO, narrow lines, respectively, whereas open circles – light gray – and three-point stars – dark gray – represent resolved galaxies and Emission Line Galaxies (which include AGN and star-forming galaxies), respectively. The first color–magnitude diagram includes a 5 Myr isochrone – Dusty – from the Lyon group (Baraffe et al. 2002). A reddening vector also has been included. |
| In the text | |
|
Fig. 9 R magnitude vs. X-ray flux for all XMM-Newton sources with R-band counterpart. The plotting symbols are explained in the top right of the figure. The gray area is the typical location of AGNs, and the dashed line marks the empirical upper envelope for quiescent galaxies; see e.g. Barger et al. (2003). |
| In the text | |
|
Fig. 10 Spitzer/IRAC color–color diagram for Collinder 69 for all X-ray sources with masses in the mass range 0.3–1.2 M⊙. Solid circles – blue – represent probable members identified in the XMM-Newton survey. The large, dotted circle (in black) represent one of the two objects with excess at 24 micron (the second one has no IRAC data). Previously known members from Dolan & Mathieu (1999), Barrado y Navascués et al. (2007) and Morales-Calderón (2008) within the XMM-Newton field-of-view and with no X-ray detections are included with plus – red – symbols. |
| In the text | |
|
Fig. 11 Histograms for different samples – dashed, black lines with and without disks – and subsamples only with disks – solid, gray lines – as described in Sect. 5.3Subpanel at the top – Probable and possible members from Barrado y Navascués et al. (2004b) and Barrado y Navascués et al. (2007), with an initial selection based on optical photometry. Subpanel at the bottom – Members listed by Dolan & Mathieu (1999), originally selected from optical photometry (including narrow-band Hα – i.e., active stars or with accretion), and confirmed based on high-resolution spectroscopy. |
| In the text | |
|
Fig. 12 Histograms for different samples – dashed, black lines with and with disks – and subsamples only with disks – solid, gray lines – as described in Sect. 5.3. Data in the XMM-Newton field-of-view. Subpanel at the top – In black-dashed and gray-solid the C69 members with X-ray upper limits, corresponding to the whole subsample and those members with disks. Subpanel at the bottom – In red-dashed and magenta-solid the C69 members with X-ray detections, also corresponding to the whole subsample and those members with disks. |
| In the text | |
|
Fig. 13 X-ray hardness ratios for sources detected with EPIC/pn. Collinder 69 members, belonging to different young stellar object classes with different plotting symbols, and non-members are represented by squares. |
| In the text | |
|
Fig. 14 Fractional X-ray luminosity as a function of mass for Collinder 69 members within the field-of-view of the two XMM-Newton observations. X-ray detections are represented as solid circles (blue and cyan for probable and possible members, respectively). Cluster members without X-ray detection appear as solid – dark gray – triangles. Class II and Class III sources with thick or thin/transition disks, as defined by IRAC photometry, are highlighted with large solid and dotted open circles, respectively. The vertical dotted and long-dashed – magenta – line locates the completeness limit (in mass) of the X-ray observations. |
| In the text | |
|
Fig. 15 X-ray luminosity functions for Collinder 69 (red, thin line) compared to those of NGC 2264 (green, thick line) and the ONC (blue, dotted line). From top to bottom the mass ranges 0.3−0.5 M⊙ and 0.5−0.9 M⊙ are shown. See text in Sect. 5.9 for more details. |
| In the text | |
|
Fig. 16 Spatial distribution of the stellar population in Collinder 69 in the mass range 0.3–1.2 M⊙. X-ray detections are represented as solid circles (blue for probable and possible members). Cluster members without X-ray detection appear as solid – dark gray – triangles. Class II, as defined by IRAC photometry, are highlighted with large solid open circles. |
| In the text | |
Current usage metrics show cumulative count of Article Views (full-text article views including HTML views, PDF and ePub downloads, according to the available data) and Abstracts Views on Vision4Press platform.
Data correspond to usage on the plateform after 2015. The current usage metrics is available 48-96 hours after online publication and is updated daily on week days.
Initial download of the metrics may take a while.