Fig. 16
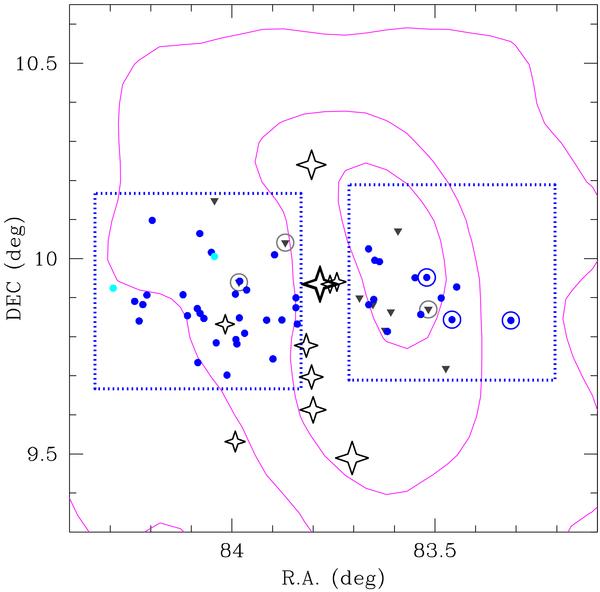
Spatial distribution of the stellar population in Collinder 69 in the mass range 0.3–1.2 M⊙. X-ray detections are represented as solid circles (blue for probable and possible members). Cluster members without X-ray detection appear as solid – dark gray – triangles. Class II, as defined by IRAC photometry, are highlighted with large solid open circles.
Current usage metrics show cumulative count of Article Views (full-text article views including HTML views, PDF and ePub downloads, according to the available data) and Abstracts Views on Vision4Press platform.
Data correspond to usage on the plateform after 2015. The current usage metrics is available 48-96 hours after online publication and is updated daily on week days.
Initial download of the metrics may take a while.