Fig. 3
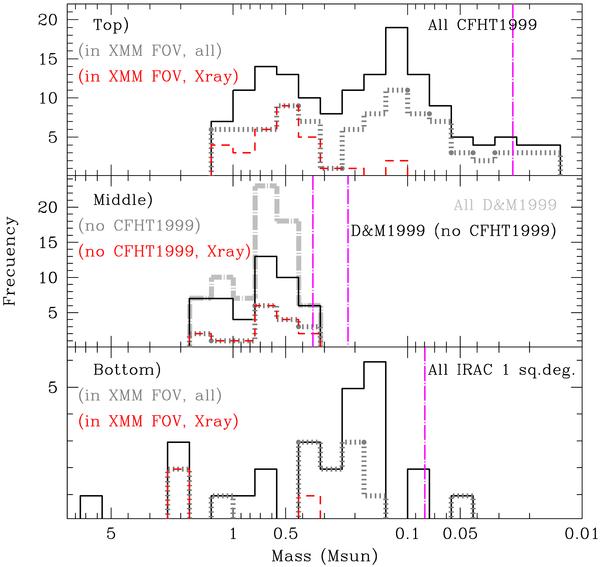
Histograms for different samples (and subsamples) described in Sect. 3 and identified with different techniques: optical, mid-infrared, and X-rays. The vertical dotted and long-dashed – magenta – segments locate the detection limit of each survey for cluster members. In these three subpanels – a top, middle and bottom, solid – black – lines correspond to the whole sample analyzed in each subpanel; dotted – gray – lines are used for subsamples spatially included in the XMM-Newton field-of-view, whereas dashed – red – lines describe the data with X-ray detections. Subpanel at the top – Probable and possible members from Barrado y Navascués et al. (2004b) and Barrado y Navascués et al. (2007), with an initial selection based on optical photometry. The less massive objects detected in the XMM-Newton data are LOri-CFHT-090 and LOri-CFHT-098, with ~0.12 M⊙. Subpanel in the middle – Members listed by Dolan & Mathieu (1999), originally selected from optical photometry (including narrow-band Hα – i.e., active stars or with accretion), and confirmed based on high-resolution spectroscopy. The thick dotted long-dashed – silver – histogram includes members in common with Barrado y Navascués et al. (2004b). The completeness limits correspond to the whole photometric survey described in Dolan & Mathieu (1999) and Dolan & Mathieu (2002) –0.35 and 0.22 M⊙, respectively. Subpanel at the bottom – New members from Morales-Calderón (2008), composed by Class II sources (Classical TTauri stars and few members with transition disks). Initial selection based on mid-IR data from Spitzer.
Current usage metrics show cumulative count of Article Views (full-text article views including HTML views, PDF and ePub downloads, according to the available data) and Abstracts Views on Vision4Press platform.
Data correspond to usage on the plateform after 2015. The current usage metrics is available 48-96 hours after online publication and is updated daily on week days.
Initial download of the metrics may take a while.