Fig. 2
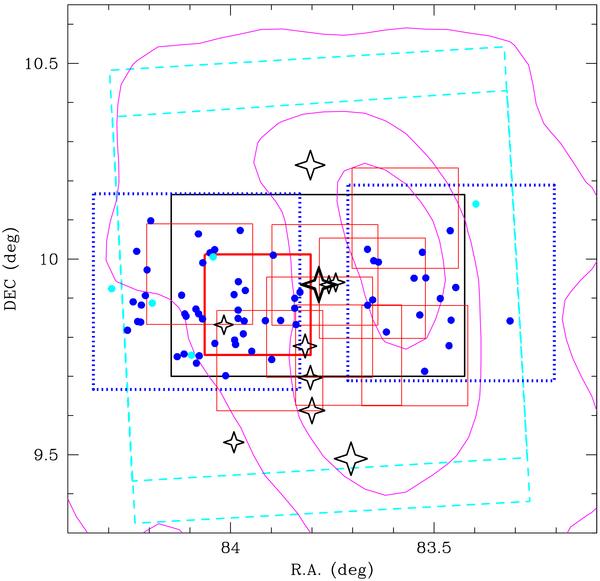
The young cluster Collinder 69, with the surveys we have conducted so far at different wavelengths. The black rectangle represents the CFHT1999 RIc survey, the red squares the near-IR data (JHKs) from Omega2000 (thick lines for the deep image), whereas the IRAC mapping is represented with dashed, cyan lines. Finally, our two XMM-Newton FOVs are located with blue, dotted squares. O and B stars are represented by four-point stars, with increasing size related to increasing brightness. Our final cluster members (see Sect. 4.4) are represented as solid circles (blue for probable members, cyan for possible members). The magenta contours corresponds to IRAS data at 100 micron.
Current usage metrics show cumulative count of Article Views (full-text article views including HTML views, PDF and ePub downloads, according to the available data) and Abstracts Views on Vision4Press platform.
Data correspond to usage on the plateform after 2015. The current usage metrics is available 48-96 hours after online publication and is updated daily on week days.
Initial download of the metrics may take a while.