Fig. 12
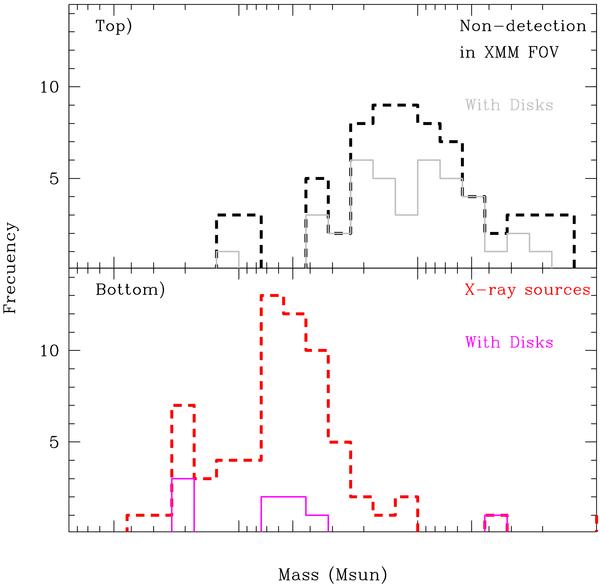
Histograms for different samples – dashed, black lines with and with disks – and subsamples only with disks – solid, gray lines – as described in Sect. 5.3. Data in the XMM-Newton field-of-view. Subpanel at the top – In black-dashed and gray-solid the C69 members with X-ray upper limits, corresponding to the whole subsample and those members with disks. Subpanel at the bottom – In red-dashed and magenta-solid the C69 members with X-ray detections, also corresponding to the whole subsample and those members with disks.
Current usage metrics show cumulative count of Article Views (full-text article views including HTML views, PDF and ePub downloads, according to the available data) and Abstracts Views on Vision4Press platform.
Data correspond to usage on the plateform after 2015. The current usage metrics is available 48-96 hours after online publication and is updated daily on week days.
Initial download of the metrics may take a while.