Fig. 9
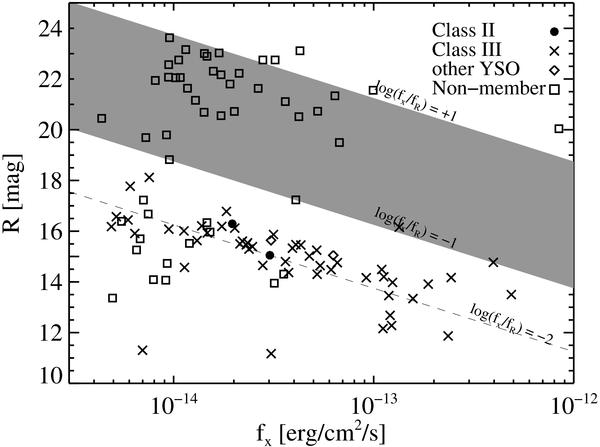
R magnitude vs. X-ray flux for all XMM-Newton sources with R-band counterpart. The plotting symbols are explained in the top right of the figure. The gray area is the typical location of AGNs, and the dashed line marks the empirical upper envelope for quiescent galaxies; see e.g. Barger et al. (2003).
Current usage metrics show cumulative count of Article Views (full-text article views including HTML views, PDF and ePub downloads, according to the available data) and Abstracts Views on Vision4Press platform.
Data correspond to usage on the plateform after 2015. The current usage metrics is available 48-96 hours after online publication and is updated daily on week days.
Initial download of the metrics may take a while.