Fig. 7
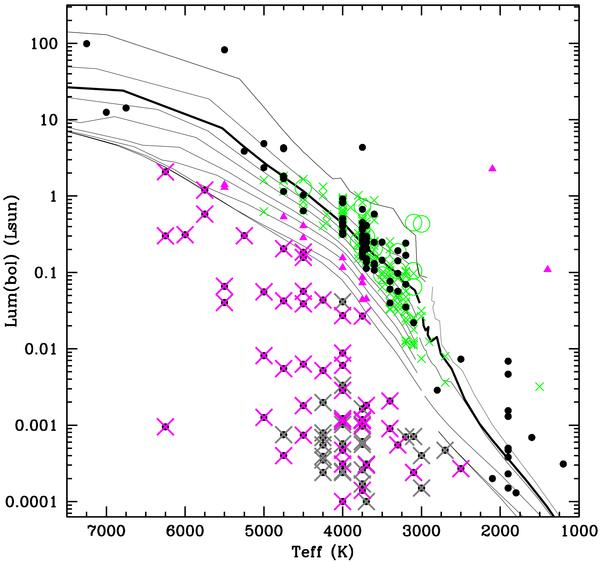
HR diagram with our rejection of non-members based on their location (solid circles with over-imposed big crosses – magenta – for non-members below the Main-Sequence). Other possible non-members, immediately above and below the cluster sequence are displayed as magenta triangles. Previously rejected quasars are displayed as solid circles with over-imposed big crosses – in gray. Other candidate members, not rejected by this test, are shown as solid black circles. Some will be later removed from the membership list using other color–color and color–magnitude diagrams. Previously known members for the cluster appear as green crosses (Class III) or open green circles (Class II), and were selected from Dolan & Mathieu (1999), Barrado y Navascués et al. (2007) and Morales-Calderón (2008). Isochrones correspond to Siess et al. (2000) – 1, 3, 5, 7, 10, 15, 20, 30, 50 and 100 Myr – and COND models – 1, 5, 10, 100, 1000 and 10 000 Myr – from the Lyon group (Baraffe et al. 2002; or Chabrier et al. 2000).
Current usage metrics show cumulative count of Article Views (full-text article views including HTML views, PDF and ePub downloads, according to the available data) and Abstracts Views on Vision4Press platform.
Data correspond to usage on the plateform after 2015. The current usage metrics is available 48-96 hours after online publication and is updated daily on week days.
Initial download of the metrics may take a while.