| Issue |
A&A
Volume 522, November 2010
|
|
|---|---|---|
| Article Number | A100 | |
| Number of page(s) | 13 | |
| Section | The Sun | |
| DOI | https://doi.org/10.1051/0004-6361/200913599 | |
| Published online | 08 November 2010 | |
Toward understanding the early stages of an impulsively accelerated coronal mass ejection
SECCHI observations
1
University of IoanninaDepartment of Physics, Section of Astrogeophysics,
Ioannina
45110,
Greece
e-mail: This email address is being protected from spambots. You need JavaScript enabled to view it.
2
Naval Research Laboratory, Space Science Division,
Washington, DC
20375,
USA
e-mail: This email address is being protected from spambots. You need JavaScript enabled to view it.
3
University College London, Mullard Space Science Laboratory,
Holmbury St. Mary,
Dorking, Surrey,
UK
4
Universität Potsdam, Institut für Physik und Astronomie,
Potsdam,
Germany
e-mail: This email address is being protected from spambots. You need JavaScript enabled to view it.
Received: 3 November 2009
Accepted: 29 July 2010
Abstract
Context. The expanding magnetic flux in coronal mass ejections (CMEs) often forms a cavity. Studies of CME cavities have so far been limited to the pre-event configuration to evolved CMEs at great heights, and to two-dimensional imaging data.
Aims. Quantitative analysis of three-dimensional cavity evolution at CME onset can reveal information that is relevant to the genesis of the eruption.
Methods. A spherical model was simultaneously fit to Solar Terrestrial Relations Observatory (STEREO) Extreme Ultraviolet Imager (EUVI) and Inner Coronagraph (COR1) data of an impulsively accelerated CME on 25 March 2008, which displays a well-defined extreme ultraviolet (EUV) and white-light cavity of nearly circular shape already at low heights h ≈ 0.2R⊙. The center height h(t) and radial expansion r(t) of the cavity were obtained in the whole height range of the main acceleration. We interpret them as the axis height and as a quantity proportional to the minor radius of a flux rope.
Results. The three-dimensional expansion of the CME exhibits two phases in the course of its main upward acceleration. From the first h and r data points, taken shortly after the onset of the main acceleration, the erupting flux shows an overexpansion compared to its rise, as expressed by the decrease in the aspect ratio from κ = h/r ≈ 3 to κ ≈ (1.5–2). This phase is approximately coincident with the impulsive rise in the acceleration and is followed by a phase of very gradual change in the aspect ratio (a nearly self-similar expansion) toward κ ~ 2.5 at h ~ 10R⊙. The initial overexpansion of the CME cavity can be caused by flux conservation around a rising flux rope of decreasing axial current and by the addition of flux to a growing, or by even newly formed, flux rope by magnetic reconnection. Further analysis will be required to decide which of these contributions is dominant. The data also suggest that the horizontal component of the impulsive cavity expansion (parallel to the solar surface) triggers the associated EUV wave, which subsequently detaches from the CME volume.
Key words: Sun: coronal mass ejections (CMEs) / Sun: flares
© ESO, 2010
1. Introduction
The genesis of coronal mass ejections (CMEs) has been the subject of intense study and significant controversy ever since their discovery (e.g., Forbes 2000; Klimchuk 2001; Zhang & Low 2005; Forbes et al. 2006; Mikić & Lee 2006). Fast CMEs tend to reveal the main physical effects at work most clearly, due to their high energy-release rate and high total energy. However, these events exhibit impulsive acceleration low in the corona (MacQueen & Fisher 1983; Sheeley et al. 1999; Vršnak 2001; Zhang & Dere 2006), so that they are very difficult to resolve. Several case studies over the previous solar cycle have shown that the ejected plasma can be accelerated within a couple of minutes and at heights as low as 0.05R⊙ (see, e.g., Dere et al. 1997, 1999; Zhang et al. 2001; Gallagher et al. 2003; Williams et al. 2005; Schrijver et al. 2008). Also, a close temporal relationship has been found between the acceleration of fast CMEs and the X-ray flux of the associated flare (Zhang et al. 2001; Neupert et al. 2001; Maričić et al. 2007; Temmer et al. 2008). Significant observational progress is now enabled by the combination of high spatial resolution, high cadence, and complete height coverage provided by the Sun Earth Connection Coronal and Heliospheric Investigation (SECCHI) instruments aboard the Solar Terrestrial Relations Observatory (STEREO), in addition to the imaging from two or three viewpoints.
Some CMEs reveal an emission void in the EUV or a cavity in white-light images in the source volume of the eruption prior to or early in the main acceleration phase (Dere et al. 1997; Plunkett et al. 1997, 2000; Maia et al. 1999; Gibson et al. 2006). Such a void is usually interpreted as the low-corona counterpart of the cavity seen farther out in coronagraph images of “three-part” CMEs. Those large-scale cavities can be modeled as the cross section of a flux rope (but may be larger than the actual cross section; Chen et al. 1997; Wood et al. 1999; Vourlidas et al. 2000; Krall et al. 2001; Thernisien et al. 2006; Subramanian & Vourlidas 2007). They are now widely considered to be the signature of an expanding flux rope. This view has been recently confirmed by stereoscopic observations (Thernisien et al. 2006; Wood & Howard 2009). As a result the flux rope interpretation for the EUV void or analogous white-light cavity at low heights has strong support. However, the interpretation as a sheared arcade or as a sheared arcade that contains a flux rope in its center is not excluded for any such structures observed prior to an eruption.
Important questions pertaining to fast CMEs (and CMEs in general) include the following. Can the EUV or white-light cavities seen at low heights early in the evolution of CMEs be interpreted as flux ropes? What is their 3D shape? What is their evolution; and in particular, do they expand self-similarly? Is their evolution relevant for EUV waves?
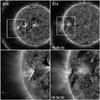 |
Fig. 1 Overview of the pre-eruption configuration at 18:38:30 UT on 25 March 2008 in STB (left column) and STA (right column). Wavelet-enhanced EUVI 171 Å images are shown. The images in the bottom row are enlargements of the erupting active region, which is marked by boxes in the upper panels. The temporal evolution is shown in the movie in the online edition (movie1.mpg). Solar north is on top. |
Obtaining answers to these questions would lead to significant progress in our understanding of CMEs. For example, establishing a relationship between EUV cavities and the cavities seen in white-light CMEs would indicate if there is a flux rope at lower heights than accessible to coronagraph observations. Determining the 3D structure of EUV cavities should allow for further insight into whether they represent early instances of a flux rope or merely reflect how the evolving CME perturbs the ambient field, i.e., whether the cavity as a whole or only its inner part is the volume of a flux rope. The lateral evolution of CMEs in their early phase remains largely unexplored. This subject provides a new diagnostic of the physical processes that operate during CME onsets, relevant to the importance of ideal vs. non-ideal effects. Finally, constraining the erupting volume at high cadence by 3D observations and modeling allows the question of whether the expanding CME acts as an impulsive trigger or as a continuous driver of the EUV wave which is often associated with fast eruptions to be addressed.
In the present paper we utilize the unique capabilities provided by the STEREO instruments – stereoscopic imaging of the outer and inner corona at high spatial resolution and cadence – to derive quantitative information relevant to the evolution of a flux rope during the nascent stages of a fast CME. The STEREO mission (Kaiser et al. 2008) was launched in late 2006. It consists of two almost identical spacecraft orbiting the Sun at different distances with one trailing the Earth’s orbit (Behind spacecraft; STB) and the other leading it (Ahead spacecraft; STA). The angular separation between the two spacecraft changes at a rate of about 45 degrees per year, which allows for truly multi-viewpoint observations of the Sun and heliosphere.
A structure reminiscent of a void became a very conspicuous, rapidly evolving feature of a CME on 25 March 2008. The structure quickly developed the shape of a bubble, and we refer to it as a “bubble” in the following. The near-limb location of the eruption, combined with the broad continuous height coverage and high cadence, revealed the evolution of the bubble into the CME cavity unambiguously. However, only the proper interpretation of the information from both viewpoints allows us to relate the bubble correctly to the whole volume of expanding magnetic flux. The geometrical parameters of the bubble are then derived by fitting a 3D model to its images. This enables an in-depth quantitative study of its evolution free of projection effects and free of confusion between the bubble and other structures aligned along the line of sight. In particular, we obtain the aspect ratio, interpreted as proportional to the ratio of axis height and minor radius of a flux rope, at the earliest stages of a CME cavity. These measurements can address the important questions of when a flux rope forms in CMEs and what determines its initial evolution. We also consider the association between the CME and the accompanying flare with regard to the role of reconnection, taking advantage of the relatively high cadence of the data. Finally, the associated EUV wave is briefly discussed. We relate its triggering to the expansion of the cavity.
This paper is organized as follows. An overview of the observations is given in Sect. 2. Section 3 discusses in detail the two-viewpoint high-cadence observations of the bubble and its proper definition. Section 4 presents the 3D geometrical modeling of the bubble, the results of which are analyzed and discussed in Sects. 5 and 6, respectively. The EUV wave is considered in Sect. 7, and Sect. 8 summarizes our findings.
2. Overview of the observations
We used observations from the Extreme Ultraviolet Imaging Telescope (EUVI; Wuelser et al. 2004) and the inner white-light coronagraph (COR1; Thompson et al. 2003) of the SECCHI instrument suite (Howard et al. 2008) aboard the two STEREO spacecraft. EUVI is a full-disk imager with a field of view extending to 1.7R⊙. We mainly used data from the 171 Å channel (hereafter 171) because these have the highest cadence (75 s in STA, 150 s in STB). The EUVI data were supplemented by total brightness images from COR1, which observes the white-light corona from 1.5 to 4 R⊙ with a 10 min cadence. Image pairs are taken with a time difference (around 20 s for the day of our observations) between STA and STB, which compensates for the different light transit times to each spacecraft; therefore, such data are synchronized on the Sun.
A CME-flare event took place in the NOAA active region (AR) 10989 on 25 March 2008 after about 18:30 UT. The center of the region was located at coordinates 10°E 80°N as seen from the Earth during the period of the event. The STEREO spacecraft had a separation of ≈47°, with STB viewing the active region ≈57° east of central meridian and STA viewing it slightly occulted near the east limb (Fig. 1).
This event was preceded by weaker activity on the far side of the neighboring AR 10988 located 30° west of AR 10989. A filament activation started near 18:20 UT, accompanied by a small, B1.8 X-ray class flare that peaked at 18:29 UT, which could be considered as a possible trigger for our event based solely on the timing. However, the EUVI data show no evidence of interaction between the two active regions after that early compact flare (no dimmings, no waves, no dissapearing loops, etc).
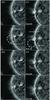 |
Fig. 2 Selected EUVI 171 Å snapshots during the eruption sequence. Left column: STB, right column: STA. Time increases from bottom to top. The dash-dotted cicles in the 18:51 UT images show our identification of the EUV cavity (“bubble”). Also marked are deflected structures, which can be easily misidentified as part of the erupting bubble if no proper 3D analysis is performed (Sect. 3). The temporal evolution is shown in the movie in the online edition (movie2.mpg). |
The first indication of an eruption in AR 10989 was observed as a slow rise of loops in the center of the region, starting at ≈18:30 UT. This was followed by an explosive expansion forming a large bubble after ≈18:41 UT. The bubble eventually became part of a fast white-light CME which reached a velocity of ≈1100 kms-1 in the outer corona (2.5–15R⊙) as measured in Thernisien et al. (2006) and Temmer et al. (2010). The associated flare was an M1.7 GOES class starting at ≈18:36 UT and peaking at ≈18:56 UT. The soft X-ray flux remained above pre-event levels for several hours after the event.
We have posted two EUVI 171 movies in the online version of the paper, and they show the evolution of the event from both spacecraft simultaneously. The first movie (movie1.mpg) shows a large-scale view of the event, and the second movie (movie2.mpg) zooms in over the erupting bubble. Selected snapshots are shown in Figs. 1 and 2. Besides the standard image reduction for SECCHI data, the 171 images were also processed using wavelets to enhance their contrast (Stenborg et al. 2008).
A snapshot of the pre-event configuration is given in Fig. 1. The source region is dominated by low-lying loops, many of them inclined, as seen by STB. On the other hand, the STA images show some more extended and diffuse coronal structures around the active region besides the low-lying loops.
These data do not provide definite evidence of an EUV cavity prior to the eruption. This may come from the inclination of the polarity inversion line in the center of the region by ~45° in the east-west direction. A faint indication of reduced intensity can be found in a narrow vertical area at the southern edge of the active region (see the zoomed STA view). The polarity inversion line bends slightly eastward in this area. However, these effects are far too weak to be conclusive. Finally, an inspection of the High Altitude Observatory’s Mk4 Coronameter images taken on the day of the event did not yield any evidence for the existence of a cavity before the eruption at heights h > 1.14R⊙.
The slow rise of the low-lying loops in the center of the active region changes into a rapidly accelerating evolution between about 18:35 and 18:41 UT, which is most obvious in the near-limb view of STA. A bubble forms and expands rapidly as it rises at about this time. It develops a relatively sharp rim (Fig. 2). The strongest visual changes occur between about 18:44:45 and 18:48:30 UT when the rim has developed and expands very rapidly. The rise of the bubble accelerates over a slightly longer time, so that the images indicate a sequence of fast expansion of the erupting volume, followed by a fast rise. This is quantified by the analysis in Sects. 4 and 5.
Intense brightenings can be seen in the active region core, marking the developing flare. A prominence also erupts, forming the peaked shape of a kinking flux rope (e.g., Török & Kliem 2005) before it fades. The prominence material lies in the bottom part of the bubble in those frames that show both structures (see the panel at 18:48:30 UT in Fig. 2). Striated structures, resembling loops seen edge-on, can be seen in the interior of the bubble.
The STA limb view also shows that the expanding bubble pushes aside nearby coronal structures. As time advances, deflections of ambient coronal structures are visible at progressively greater distances from the bubble revealing the propagation of a wave. Indeed, an EUV wave can be seen traveling away from the bubble in 195, 284, and 171 channel observations from both STA and STB spacecraft (see Sect. 7).
The bubble continues to grow and to propagate outward, its front exiting the EUVI field of view at 18:55 UT. A large intensity depletion (dimming) is seen in its wake marking the mass evacuation associated with the eruption. Finally, we note concave-upward and striated structures at the bottom of the erupting bubble (see, e.g., the STA data after 18:54 UT and the STB data between 18:57:15 and 18:59 UT). Such features are commonly interpreted as indicating of a flux rope structure (e.g., Plunkett et al. 2000).
Eventually the bubble becomes the white-light CME. This is apparent in the composite of nearly-simultaneous EUVI 171 and COR1 images in Fig. 3. The FESTIVAL software (Auchère et al. 2008) was used to generate these images. The erupting bubble evolves into the CME cavity once it enters the COR1 field of view. Note, for instance, the correspondences between the EUVI bubble and CME front in STA at 18:55 UT and between the bubble and CME flanks in STB at 19:05 UT. It is well established that the cavity of white-light CMEs is a signature of an erupting flux rope (see the Introduction); in particular, a flux rope model was successfully fit to the stereoscopic COR2 data of this event at heliocentric distances > 2.5R⊙ (Thernisien et al. 2006). We can thus infer, with high likelihood, that the EUV bubble is the low coronal signature of the CME flux rope.
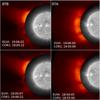 |
Fig. 3 Composite of EUVI 171 Å and COR1 white-light images from STA and STB showing the emergence of the EUVI bubble into the COR1 field of view, where it becomes the cavity of a typical three-part CME. |
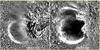 |
Fig. 4 Base-ratio images for representative snapshots during the event. Each EUVI 171 Å image is divided by the corresponding pre-event image taken at 18:39:45 UT. The resulting ratios are scaled into the range 0.2–1.8 for each frame. The pixel size is not rescaled, so that the solar radius differs slightly, because it is smaller by ≈5% for STB. The temporal evolution is shown in the movies in the online edition (movie3.mpg, movie4.mpg). |
3. Proper definition of the erupting bubble
From both spacecraft, the bubble is seen as a rim of enhanced brightness enclosing a dimming area (Figs. 2 and 3). Ratio or difference images bring out such structure much clearer. Animations of base-ratio 171 images from STA and STB (with each image of the sequence divided by a base pre-event image) are posted in the online edition of the paper as movie3.mpg and movie4.mpg, respectively, and two nearly simultaneous frames from these animations are shown in Fig. 4. These confirm the basic structure of a rim, which must consist of coronal plasma accumulated on the surface of the expanding magnetic flux.
Since the optically thin EUV emission results from the integration of all column density along the line of sight, there are two possibilities for producing this structure in the brightness distribution: (1) a relatively unstructured density distribution in the surface of the expanding volume, leading to enhanced column density at the projected edge in the plane of the sky where the observer’s line of sight is tangential. Different perspectives map different parts of the surface onto the corresponding plane of the sky; (2) loop-shaped enhancements of the surface density due to overlying loops that have been swept up. In this case, the same traces on the surface are mapped onto the plane of the sky for any perspective of the observer, and the true edge of the expanding volume may extend beyond the rim in the images.
The data favor the first interpretation because the bubble rim in the EUVI images evolves continuously into the rim of the CME cavity in the COR1 and COR2 images, indicating that it is the true edge of the expanding volume and that the rim is close to a circle from the perspectives of both STA and STB. The latter property is incompatible with an essentially planar loop-shaped density enhancement, which would appear notably elongated (elliptical) in at least one of the views, due to the considerable angular separation of the spacecraft.
Comparing the size and location of the rim between STA and STB, one finds that a mismatch gradually develops from about 18:46 UT onwards. While the southern part of the rim retains a good correspondence between the STA and STB images throughout the event, the northern part of the rim for STA expands beyond the rim for STB.
This feature was also noted by Aschwanden (2009) and is very clearly seen in his Fig. 3, where circular fits to the evolving rim for STA are overplotted on the corresponding STB base-difference images. Since the northern part of the STA rim extends beyond the STB rim in a direction perpendicular to the direction of the angular separation between the spacecraft (which is nearly in the ecliptic), the two rims cannot map the same edge of the expanding volume. In order to develop an interpretation for this feature, let us consider the base ratio images in more detail.
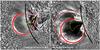 |
Fig. 5 Outlines of the envisioned croissant-shaped flux rope with a bubble-like enhancement in its center; left: STB view, right: STA view. Solid red lines represent edges of the erupting flux. Thick arcs indicate the bubble (edge of middle cross section for STA and edge of cross section in rear part for STB). Thin arcs indicate the croissant-shaped extensions of the bubble to the photospheric sources of the erupting flux. Dashed and dotted red lines indicate edges that are not visible (because they nearly coincide with other edges, are occulted, or are at different temperature). Dash-dotted yellow lines indicate the magnetic axis of the structure. See Sect. 3 for further explanations. |
The STA image in Fig. 4 show that the deepest dimming occurs in a direction inclined from radial toward the south. This is also the direction of ascent of the bubble in the STB image and the direction of ascent of the prominence. The deepest dimming defines the core of the eruption, and in the STA ratio image it is enclosed on the northern side by a second, less bright rim, which can be discerned from 18:47:15 to 18:54 UT. This part of the eruption has approximately the same size for STA and STB and appears consistent with a nearly spherical object throughout the EUVI field of view. A sphere does indeed yield a consistent fit to the STA and STB EUVI images of this structure; the fit remains consistent even out to the first two COR1 image pairs (Sect. 4). We therefore adopt this bubble-shaped volume of deepest dimming as the core part of the eruption, to be modeled in this paper by 3D fitting to its rim. This choice is supported a posteriori by the timing of the resulting upward acceleration profile of the bubble, whose onset coincides with the first signs of the associated flare’s soft X-ray emission (Sect. 5).
Our definition of the bubble also leads to a plausible interpretation of the different expansions seen by STA and STB after about 18:46 UT. We suggest that the expanding volume evolved from a nearly spherical shape (as long as the two rims are of nearly equal size and nearly cospatial in projection), to the shape of a torus section with conical legs (similar to a croissant), which was successfully fitted to the stereoscopic images at later stages of the event in the height range of COR2 (Thernisien et al. 2009). This transition from a sphere to a torus may be associated to a “zipper” effect, when reconnection progresses not only upwards but also in a direction along the neutral line at the base of the eruption. The STB data indeed show that the post-eruption loop arcade grows considerably along the neutral line in the south-east direction after 18:47 UT. Here we assume that the magnetic axis of the structure rotated by ~45° in the clockwise direction from the original alignment with the polarity inversion line to become approximately aligned with the east-west direction. This orientation of the axis is indicated by the depth of the dimming seen by STA (Fig. 4) and by the shape of the white-light cavity at greater heights (see the STB COR1 image at 19:05 UT in Fig. 3). The rotation is consistent with the observed kinking of the embedded filament if the field is right-handed (Green et al. 2007), which, in turn, is consistent with the location of the active region in the southern hemisphere.
We note that the dimming seen by STB above the limb is much weaker than the STA dimming (Fig. 4). This suggests that the magnetic axis of the erupting flux was much closer aligned to the line of sight for STA (which is plausible due to the near-limb location of the active region for STA), so that STB was looking at the magnetic axis of the erupting flux from an elevated perspective. This implies that much of the STB dimming should lie on disk, as observed, and that the STB rim maps the edge of the bubble somewhere between the top and the rear side of the bubble.
A spherical volume can, of course, only be an approximation to the major part of the erupting flux because the field lines must still connect to the source areas of the flux in the photosphere. As the bubble radius exceeds the size of the active region, which already occurs at low heights, the source areas stay much smaller than the rim in the EUVI images, so the extensions of the bubble approximate short cones. This leads to a nearly spherical inverse teardrop shape in projection onto the plane of the sky, which is fully compatible with the STA and STB images during the first minutes of the expanding bubble. A croissant shape results when the bubble begins to extend along the magnetic axis of the erupting flux in the course of its further rise, to eventually approach a partial toroidal shape of the upper part. For this evolving geometry, a smaller rim can be associated with the cross section of the bubble or middle part of the croissant (the minor radius of the developing torus), while a progressively larger rim can be associated with the upper edge of the growing croissant (the major radius of the developing torus), if it is seen slightly from the side. Here the initially nonradial propagation of the bubble is essential. Since the erupting field must remain rooted in the active region, both the front and the rear extensions of the bubble to the tips of the croissant are arranged obliquely, in the northwestward direction. This means they are seen slightly from the side (and probably slightly from below) by STA and seen significantly from above by STB.
This geometry is sketched in Fig. 5. The STA view on the right-hand side is approximately aligned with the magnetic axis of the flux rope in the middle (bubble) part of the croissant (looking at the axis slightly from below). STA resolves both aspects of the erupting structure: the whole edge of the bubble (thick red lines) and the upper edge of the croissant-shaped frontal extension from the bubble toward the northwest footpoint (larger thin red line), which lies behind the STA limb. The lower edge of the front extension (not included in the plot) nearly coincides with the left (southern) part of the bubble edge in projection and is not detected as a separate structure. The rear extension of the croissant (not included in the plot) is nearly cospatial with the front extension in projection, so that it does not produce separate rims.
The STB view on the left-hand side is approximately aligned along the east-west direction with the magnetic axis of the flux rope in the middle (bubble) part, but elevated, i.e., looking down at the bubble. STB sees the edge of the bubble in its upper-rear part (thick red line). The images also show, albeit only very faintly, the left and right edges of the front croissant-shaped extension from the bubble to the northwest footpoint (on disk for STB). The rear croissant-shaped extension (dashed red lines) lies essentially under the bubble and is not very different from the front extension in projection, and thus does not produce separate rims.
The suggested evolving geometry of the erupting flux explains in a natural manner the persistence of the dimming between the small and large rims in STA and that it is weaker than the core dimming, and why the CME bubble shape is much less defined and more extended in the COR1-A images (Figs. 3 and 7). In a nutshell, the core of the eruption in COR1-B (e.g., at 19:05 UT in Fig. 7) is part of the distorted structure in COR1-A. The actual bubble is visible, albeit very faintly in the background, and was the basis for the 3D fits shown in the figure.
Although our 3D modeling in Sect. 4 focuses exclusively on the core of the eruption, it is important to understand how the major bright and dimming structures are related between STA and STB, as well as between the EUVI and the COR1–COR2 height ranges. Only a consistent picture between STA and STB justifies the use of 3D modeling as a method superior to individual 2D modeling of the STA and STB data. As we will see in Sect. 5, the implications of the 3D modeling differ drastically from a previous modeling (Aschwanden 2009) that focuses exclusively on the large rim seen by STA after it began to differ from the rim seen by STB, assuming that this rim maps the edge of a spherical bubble.
The difference between Aschwanden’s and our fitting is further amplified by the different judgment of the “deflected structures” mentioned in Sect. 2 and marked in Fig. 2. In the STA images, these structures are bent to the side when the erupting flux has expanded sufficiently in horizontal direction up to their position. While some of these originally nearly radial structures then coincide in projection with the northern rim, others stay slightly in front of the rim. The pre-event STB view (Fig. 1) shows that these structures are not physically connected to the bubble and they are rooted in a different part of the active region, at its periphery. By fitting a circle to the deflected structures ahead of the north rim in some of the STA images, Aschwanden obtained modeled bubble outlines that are even larger than the rim and extend clearly beyond the range of coronal off-limb dimmings associated with the CME.
In the subsequent 3D modeling we focused on the core of the eruption, which is imaged by the 171 channel of both spacecraft. We considered the core (the “bubble”) to be defined by the deepest dimming for STA and the rim enclosing it and by the rim seen by STB.
4. 3D geometrical modeling of the erupting bubble
The considerations of the previous section lead us to adopt the spherical geometry for the core of the CME as long as we can discern rims of similar size and location that define a (not necessarily complete) circular shape to sufficient accuracy in the 171 STA and STB images. This is the case throughout the EUVI field of view, as well as for the first two COR1 image pairs. It is clear that the assumption of spherical shape becomes progressively more approximate as the erupting flux reaches greater heights, since the second STA rim, which develops after about 18:46 UT, can be interpreted as a signature of a more elongated, croissant-like shape and since a “developed” flux-rope shape has given a successful 3D fit to the data in the COR2 field of view (Thernisien et al. 2009).
The graduated cylindrical shell model employed by Thernisien et al. (2009) consists of a partial torus with radially aligned conical legs. It not only fits the 3D morphology of evolved CMEs in the height range imaged by COR1 and COR2, but also the CME shocks (Ontiveros & Vourlidas 2009) and EUV waves (Patsourakos & Vourlidas 2009). For our purpose, we simplify the model by adopting coinciding legs, which collapses the toroidal section into a sphere (see Figs. 1 and 2 in Thernisien et al. 2006). This geometry is known in CME modeling as an “ice-cream cone” model.
The model is constructed with the following free parameters: position of the leg on the solar surface (longitude, latitude), north-south tilt of the leg with respect to the radial direction, and, finally, distance to the front and radius of the spherical shell. The distance to the midpoint of the spherical shell, h, approximates the axis height of the developing flux rope, while the radius, r, is assumed to be proportional to the rope’s minor radius. The rim of the bubble and the edge of the supposed flux rope do not necessarily have to coincide. In Sect. 6 we discuss two possible interpretations of rapid bubble expansion: one of them identifies the bubble with the flux rope, while the other identifies the rim with a flux surface in the ambient field.
The free parameters were varied until we found a satisfactory projection of the model on the plane of the sky for both STA and STB. Only the images taken from 18:41 UT onward could be fit because it was hard to identify the erupting bubble with confidence at earlier times. We emphasize that the simultaneous fitting for STA and STB places strong constraints on the free parameters of the model. For instance, we find that deviations from the best-fit values lead to intolerable solutions already if the distance to the midpoint is changed by more than ≈5% or the radius is changed by more than ≈15%. Error bars were obtained by such a systematic variation in the fit parameters. These are asymmetric for the radius; i.e., the tolerable values for its increase and reduction differ.
The fits yield a tilt in the CME leg by ≈35° with respect to the radial direction, which is only weakly changing across the analyzed height range. To our knowledge, this is the first time that such strong non-radial evolution is quantified so low in the corona. CMEs are often observed to start more radially in EUV images but can become deflected towards the equator at larger heights, especially at solar minimum (e.g., Plunkett et al. 1997). Non-radial motion should be given more attention in future CME modeling.
Due to the tilt, the distances to the front and midpoint of the fitted sphere differ from the corresponding heights above the photosphere by a (nearly uniform) factor of ≈1.2. Since we are interested in the evolution of the CME flux rope, i.e., how it is accelerated along its propagation path and how it expands in relation to this acceleration, we base the subsequent analysis on the distances along the inclined propagation path. Since the difference to the true radial heights is small and in order to conform to the usual designation in describing CMEs, we simply refer to these distances as “heights” in the remainder of the paper.
Figures 6 and 7 show our fits for several representative snapshots in the course of the event from EUVI and COR1, respectively. The model reproduces the position and envelope of the bubble quite well at all times and simultaneously for both spacecraft, which justifies its use in deriving quantitative information about the early evolution of the CME. The fit is less satisfactory in the conical section of the employed model. For example, the lowest parts of the observed bubble show a stronger divergence with height. Also, the internal structure of the bubble is not included. However, the development of a more sophisticated model that can improve on these aspects is beyond the scope of the present paper.
The 3D geometrical modeling gives us fairly accurate values for the height h of the bubble center (along the inclined propagation path) and for the radius r of the bubble vs. time for further analysis. These are independent of the quality of fit by the conical section of the model. The rise profiles of the front edge and midpoint of the bubble, h(t) + r(t) and h(t), respectively, and the radial evolution r(t) are plotted in Figs. 8 and 9 and analyzed in the following section.
 |
Fig. 6 Representative fits of the bubble by our 3D ice-cream cone model in EUVI 171 Å data from STA and STB. Each STA and STB image is shown twice: once without and once with the 3D model (red wireframe) overplotted. |
5. Timing of bubble expansion and acceleration, and relation to the associated flare
To characterize the main acceleration phase of the ejection and compare it to the signatures of the associated flare, we derived velocity and acceleration profiles from the height-time data. We followed the most widespread practice of using the position of the CME front edge, h(t) + r(t), to facilitate the comparison with other studies. A twofold application of smoothing and finite differencing is often used for this purpose, but is known to yield large and often un-acceptable scatter in the derived acceleration profile, even if the main acceleration phase is sampled at a higher rate than here. Therefore, we use a further fit, adopting the following function (Sheeley et al. 2007) ![Mathematical equation: \begin{eqnarray} H(t)&=&H(t_1) +\frac{1}{2}(\upsilon_{f} + \upsilon_{0})(t-t_1) \nonumber \\ \label{e:fitht} &&+ \frac{1}{2}(\upsilon_{f}-\upsilon_{0})\tau \ln\left[\cosh\left(\frac{t-t_1}{\tau}\right)\right], \end{eqnarray}](/articles/aa/full_html/2010/14/aa13599-09/aa13599-09-eq30.png) (1)whose derivatives yield the velocity and acceleration profiles as
(1)whose derivatives yield the velocity and acceleration profiles as ![Mathematical equation: \begin{eqnarray} \label{e:fitvt} \upsilon(t)&=&\frac{1}{2}(\upsilon_{0}+\upsilon_{f})+ \frac{1}{2}(\upsilon_{0}-\upsilon_{f})\, \tanh\left(\frac{t-t_1}{\tau}\right),\\ \label{e:fitat} a(t)&=&\frac{\upsilon_{f}-\upsilon_{0}}{2\tau} \left[1-{\tanh}^{2}\left(\frac{t-t_1}{\tau}\right)\right]. \end{eqnarray}](/articles/aa/full_html/2010/14/aa13599-09/aa13599-09-eq31.png) Here, υ0 and υf are initial and final asymptotic velocities, respectively, t1 is the time of peak acceleration (equal to the time when the velocity reaches its average value (υ0 + υf)/2, because of the symmetry of the function), and τ is the time scale of the rise to peak acceleration.
Here, υ0 and υf are initial and final asymptotic velocities, respectively, t1 is the time of peak acceleration (equal to the time when the velocity reaches its average value (υ0 + υf)/2, because of the symmetry of the function), and τ is the time scale of the rise to peak acceleration.
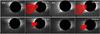 |
Fig. 7 Similar to Fig. 6, but for the coronagraph images of the CME. |
This function can reproduce profiles ranging from nearly constant acceleration (when τ is comparable to or bigger than the considered time interval) to impulsive acceleration (when τ is significantly smaller). It resembles shapes obtained in CME simulations (e.g., Reeves 2006; Török & Kliem 2007), and is found to fit our height data very well, as it did for slow streamer ejections in Sheeley et al. (2007). A slight drawback consists in the symmetry of its acceleration profile, which likely influences the resulting time and magnitude of the peak acceleration and the onset of fast acceleration somewhat. Since the rise time of eruptions is often shorter than their decay time, this fit function may place the onset slightly too early. However, given the small number of our height data points (only eleven points), we do not consider extended experimenting with the fit function warranted.
Uncertainties in the resulting velocity and acceleration profiles were estimated by Monte Carlo simulation. We randomly perturbed the observed height data within their estimated error bars and fitted these data with Eq. (1). This proccess was repeated 104 times and the 1σ variation in the resulting velocity and acceleration profiles are taken as estimates of their uncertainties.
The fit using Eq. (1) confirms the impulsive nature of the acceleration profile (Fig. 8) and permits us to estimate its salient properties. The acceleration peaks at t1 ≈ 500 s (18:49:20 UT) relatively low in the corona (H(t1) ≈ 0.4R⊙; h(t1) ≈ 0.27R⊙) and lasts for about 1000 s (FWHM). Nearly all of the acceleration occurs within the EUVI field of view. The asymptotic velocity of 1200 kms-1, essentially reached at our first COR1 data point at a heliocentric distance of the CME front of ≈2.6R⊙, is consistent with the velocity of ≈1100 km s-1 obtained from a 3D fit to the COR2 data in Thernisien et al. (2006), since fast CMEs generally decelerate slowly in the solar wind. The fit indicates that the impulsive acceleration phase commenced around 18:36 UT.
In Fig. 9 we plot the heights of the bubble center, h(t), joint with the corresponding radii. The very small volume of the erupting flux prior to the onset of the fast expansion is apparent: the first two data points yield bubble radii r < 0.05R⊙. Next we combine these values to obtain the aspect ratio of the bubble, κ = h/r. The error bars given for this quantity in Fig. 9 were calculated as the root mean squared (rms) values of all possible combinations of h and r errors (two for the upper limit and two for the lower limit) for each data point. Standard error propagation could not be used due to the asymmetry of the r errors.
The aspect ratio of the bubble exhibits a clear two-phase evolution. It decreases rapidly in the first ≈600 s of our data, followed by a very gradual recovery not very different from a plateau. This confirms the impression obtained from the animated EUVI images as described in Sect. 2. The expansion of the erupting flux in the main acceleration phase of the ejection thus reveals two major effects of different duration, i.e., two phases. In addition to the conventional impulsive main upward acceleration of a fast CME, the event exhibits an initial lateral overexpansion (a rapidly decreasing aspect ratio) that coincides approximately with the rise to peak upward acceleration. Our data indicate very clearly that the overexpansion is present from the beginning of the main acceleration phase and show that it ends earlier than the main acceleration. Whether the overexpansion generally ends near peak acceleration must be clarified by studying further events and the underlying physics.
The very slow subsequent evolution of the aspect ratio κ(t) means that the flux rope evolves approximately self-similarly known to be typical for CMEs in their propagation phase after the main acceleration (e.g., Krall et al. 2001; Thernisien et al. 2006, 2009). This behavior is here found to commence very early, already in the course of the main aceleration.
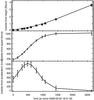 |
Fig. 8 Time evolution of bubble front height, h(t) + r(t), from EUVI and COR1 data (final two datapoints) and its fit by the function given in Eq. (1) (upper panel). Velocity (middle) and acceleration (bottom) of bubble front derived from the fit. Error bars show 1σ uncertainties obtained by Monte Carlo simulations (see Sects. 4 and 5 for detail). |
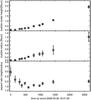 |
Fig. 9 Time evolution of bubble center height h, radius r, and aspect ratio κ, as determined by the 3D ice-cream cone model from simultaneous fitting of the STA and STB EUVI and COR1 observations. |
To our knowledge, the possible existence of two phases in the course of a CME’s main acceleration has not been observed previously. In particular, the fitting of a similar spherical model to the same EUVI data has led Aschwanden (2009) to conclude that the bubble evolved self-similarly throughout the main acceleration phase with an aspect ratio κ ≈ 1. It appears that one major reason for the different result lies in his choice of bubble radii that are too large at most times in the main acceleration phase (inconsistent with the STB data; see Sect. 3). When the fitted sphere extends approximately between the front of the bubble and the coronal base, then h ≈ r and κ ≈ 1 at all times. The other major reason derives from his assumption that both h(t) and r(t) data can be represented by fit functions that are valid throughout the main acceleration phase. This masks any possible two-phase evolution. Moreover, the acceleration was assumed to be uniform (commencing as a step function) in both h and r directions, which is an inadequate representation of impulsive CME acceleration (and introduces a tendency to infer a delayed onset time, found to be 18:38 UT).
The aspect ratio of erupting flux was also considered in Krall et al. (2001) for a sample of mostly slow CMEs at heliocentric distances (2–30) R⊙, where approximately constant values in the range ≈(1–2.5) were found. Krall et al. (2001) use the heliocentric distance and the diameter of the cavity to define an aspect ratio, which can be expressed, using our aspect ratio κ, as Λ = κ + (R⊙ − h)/2r. For h ≫ R⊙ the quantities differ by a factor 2 (Λ ≈ κ/2). For h ≪ R⊙, one has Λ ≈ R⊙/2r, thus the relationship to κ is essentially lost in the height range where fast CMEs often commence. Krall et al. (2001) plot Λ values also at low heights, estimated from EUV images, for several events in their sample. However, it is impossible to transform these data into the corresponding values of κ because the corresponding heights are not given with the required high accuracy. Moreover, these data did not cover the relevant height range of strongly rising acceleration.
The initial value of the aspect ratio in our data, κ ≈ 3 at 18:41 UT, suggests that a flux rope was formed by this time and that it was detached from the photosphere (as opposed to a bald-patch topology; e.g., Titov et al. 1993). This suggests the existence of a current sheet beneath the flux rope, where reconnection could produce flare signatures and add flux to the rising rope, consistent with the strong rise of the flare emissions after 18:41 UT.
A closer look at the aspect ratio after the phase of overexpansion indicates a very gradual increase. To check whether this trend persists, we compared our aspect ratios to the corresponding values obtained by Thernisien et al. (2009) in the COR2 range. The full graduated cylindrical shell model is more appropriate than the ice-cream cone model at these heights and yields a minor torus radius r = 2.4R⊙ at the front height of h + r = 8.9R⊙ from an image pair near 20:22 UT. (This includes a moderate correction of the ratio r/(h + r) quoted in Thernisien et al.2009). The resulting aspect ratio κ = 2.7 supports the trend indicated by our spherical fits up to front heights ≲ 4R⊙. However, it must be noted that the proper definition of the aspect ratio may change in the considered height range. Low in the corona, where we find the overexpansion, the overall structure of the erupting flux is close to a partial torus. Our choice of κ, center height by radius of the bubble, corresponds to the aspect ratio of a torus (major by minor radius) in this range. At great heights, h ≳ R⊙ and beyond, the erupting flux forms a nearly complete torus. The toroidal aspect ratio is then better approximated by κ/2, which leads to an aspect ratio of ≈1.4 at the front height of 8.9R⊙. When adopting values intermediate between κ and κ/2 for our final two data points at h > R⊙, the trend in the COR1–COR2 height range is actually closer to flat behavior or to a very gradual decrease in the aspect ratio. This is consistent with the trend found for the majority of events in Krall et al. (2001). Although in this view the aspect ratio of the erupting flux may decrease throughout the EUVI–COR2 height range, the existence of two clearly distinguishable phases – rapid initial overexpansion, followed by very gradual, approximately self-similar evolution – remains a robust result for the event investigated here.
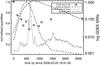 |
Fig. 10 Evolution of bubble aspect ratio (squares, from Fig. 9) and acceleration (dashed, from Fig. 8) compared to the 25–50 keV light curve (dotted) from RHESSI (Lin et al. 2002) and to the 1–8 Å light curve (dashed-dotted) from GOES (Garcia 1994). Normalized quantities are plotted. RHESSI was in spacecraft night prior to 18:45 UT (t < 240 s). |
Figure 10 displays the temporal relation between the acceleration and aspect ratio of the CME cavity and the soft and hard X-ray light curves of the associated flare. Previous studies of fast CMEs have demonstrated a very close association between the CME acceleration profile and the rise phase of the soft X-ray light curve in the majority (~50%) of events, a moderately close association for a further large fraction (~25%), and substantial differences in the remaining cases (Maričić et al. 2007). The event studied here falls in the second category: the acceleration profile peaks nicely on the flank of the soft X-ray light curve, but slightly before the time of steepest rise which coincides with the major hard X-ray pulse (seen when the soft X-ray light curve is plotted on a linear scale as well). Also, the acceleration commences earlier, by about 5 min, than the main (exponential) rise of the soft X-rays, which, however, is common. The onset of the acceleration is simultaneous to the onset of the gradual rise of the soft X-ray emission above the base level set by the precursor event in the neighboring active region.
Overall, the event shows a relatively high CME-flare correlation, as the majority of fast CMEs. An unusual role for reconnection is not indicated. Consequently, if the overexpansion is related to reconnection, we can expect that it occurs in many further events. The strongest hard X-ray peak commences when the rapid decrease of the bubble’s aspect ratio ends, clearly indicating that the overexpansion does not result from an enhanced reconnection rate, but instead it reflects an evolutionary stage of the eruption.
6. Interpretation of bubble overexpansion
The phase of overexpansion encompasses only a tiny fraction of the ascent of the ejected flux (the center of the bubble rises from h ≈ 0.1R⊙ only to h ≈ 0.29R⊙ in these ≈600 s). It therefore cannot primarily come from the rise into an environment of lower pressure. This effect would remain strong over a much wider height range. Rather, a magnetic origin is implied.
Shearing and twisting of the coronal field by photospheric footpoint motions are known to produce huge inflations (e.g., Mikic & Linker 1994; Török & Kliem 2003), but operate on far longer time scales relevant to the energy storage phase and do not exhibit a sudden onset, so these processes can also be excluded.
We suggest that one or a combination of the following two effects causes the overexpansion. First, there is a purely ideal MHD effect of the decreasing current in a rising flux rope. The decrease in the current is a consequence of flux conservation between the flux rope and the photospheric boundary (e.g., Isenberg & Forbes 2007). It can be made plausible by the fact that the number of field-line turns in the flux rope does not change under line-tied, ideal conditions when the flux rope rises. This is equivalent to a decreasing azimuthal (poloidal) field component and causes the flux surfaces to move apart all around the rope. The weaker field is compensated for by the larger volume to conserve the flux between the surfaces, as required by ideal MHD. Nominally, the expansion progresses outward at the Alfvén speed, but the tension of the surrounding field resists the expansion, slowing it down. Nevertheless, a cavity expands rapidly. This expansion extends into the volume outside of the actual flux rope and is a natural consequence of a preexisting flux rope.
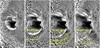 |
Fig. 11 Sequence of STA 171 Å base-ratio images at 18:49, 18:53:30, 18:56, and 18:59 UT, showing the launch of the EUV wave by the horizontal expansion of the CME cavity (which is far more strongly expressed in the southward direction due to the initially nonradial rise of the CME) and the subsequent detachment of the wave front from the cavity. Due to the upward rise of the cavity, its horizontal expansion at heights h ≲ (0.2–0.3)R⊙ in both northern and southern directions has terminated by the time of the final panel. The wave in the northern direction is much slower, but can be seen clearly in the corresponding animations in the online edition. |
Second, the overexpansion can also result from the rapid addition of flux to the CME flux rope by magnetic reconnection in the vertical (flare) current sheet underneath. In this case, the flux rope comprises the whole observed cavity, and the overexpansion can signify the growth of a preexisting flux rope (Lin & Forbes 2000), as well as the formation of the flux rope from arcade field lines (Lynch et al. 2008).
Numerical modeling of overexpanding rising flux ropes, planned for a follow-up investigation, is expected to reveal which of these effects conforms best to the data analyzed here. Also, it should show whether the nearly simultaneous end of overexpansion and of rising acceleration in the studied CME represent a systematic effect or a coincidence.
7. Launch of the EUV wave
Finally, let us briefly address the EUV wave which was observed both off-limb and on-disk in association with the eruption. The launch of the wave and its association with the rapidly expanding CME cavity is clearly displayed in both base-ratio movies provided in the online edition. The wave is first seen ahead of the south rim in the 171 STA frame at 18:49:45 UT and in the 171 STB frame at 18:50 UT. Snapshots of the wave are also shown in Fig. 11.
The STA base-ratio movie (see also Fig. 4, for individual frames) shows that, at any given height, the lateral expansion of the developing CME cavity has the temporal profile of a single pulse. The lateral expansion starts impulsively (as does the whole CME) but also ends rather abruptly, which is caused by the rise of the cavity and its subsequent detachment from the solar surface. The wave propagates away from the cavity rim as soon as the lateral expansion of the rim has begun to slow down at low heights. These effects are more pronounced on the southern side of the eruption, due to the southward inclination of the initial rise. The off-limb wave front can be tracked by following the outermost deflected off-limb structures. Their locations roughly coincide with the latitudinal extent of the wave on the disk.
The decoupling between the erupting flux and the EUV wave shows that the observed intensity front is a freely travelling wave. This is at variance with suggestions that EUV waves represent the lower coronal extension of the CME – a “current shell” at the surface of the expanding flux (Delannée et al. 2008), or the “magnetic footprint” of a CME “skirt” that reconnects with the ambient quiet-Sun flux (Attrill et al. 2007). This has already previously been found, based on 3D fittings of EUVI and COR1 images of two slow CMEs with associated EUV waves (Patsourakos et al. 2009; Patsourakos & Vourlidas 2009); see also Kienreich et al. (2009) and Veronig et al. (2010) for similar conclusions. The animated base-ratio images of the present event and our 3D fitting of the expanding flux at the relevant low heights provide particularly clear support for interpreting of EUV waves as freely traveling waves. In addition, they show that it is the impulsive horizontal expansion of the fast CME low in the corona that triggers the wave.
8. Summary and conclusions
We present a detailed analysis of the formation and early evolution phase of an impulsively accelerated, fast CME, beginning to exploit the diagnostic potential of its expanding cavity. Key aspects of this work are the 3D modeling of CME expansion, based on two-viewpoint observations, and the continuous coverage of the critical range of CME formation and main acceleration in the inner corona, and up to several solar radii by the STEREO mission. These allow us to quantify the initial expansion of the erupting flux to obtain new insight into the genesis of CMEs. The observational results can be summarized as follows.
-
The CME forms a rapidly expanding “bubble” simultaneouslywith the onset of the main upward acceleration.
-
The bubble appears as a nearly circular area of low EUV emission surrounded by a relatively narrow and bright rim but is a 3D structure that can be described reasonably well by a sphere in its early development stages.
-
The bubble evolves into the cavity of the white-light CME, which is well fit by a geometric flux rope model at distances > 2.5 R⊙ (Thernisien et al. 2006). It is therefore highly likely that the bubble is the early signature of the flux rope commonly suggested by CME models. The associated erupting prominence rises with the bottom part of the bubble.
-
The aspect ratio of the bubble, center height vs. radius, evolves nonlinearly in two phases. An initial rapid decrease, which signifies a faster expansion than rise, is followed by nearly constant aspect ratio, i.e., a nearly self-similar evolution.
-
The overexpansion is present from the beginning of the formation of the bubble but ends earlier than the main upward acceleration, close to the acceleration peak.
-
The main acceleration is preceded by a slow-rise phase of active-region loops overlying the prominence. The images in this phase are inconclusive with regard to the existence (or absence) of a cavity enclosed by these loops.
-
The explosive nature of the eruption induces deflections of ambient coronal structures and launches an EUV wave propagating across the solar disk. The EUV wave is likely triggered by the pulse-like horizontal component of CME cavity (bubble) expansion low in the corona. As the horizontal expansion in the low corona slows down and terminates, owing to the further rise of the erupting flux, the EUV wave becomes a freely propagating wave.
-
As for most fast CMEs, the main upward acceleration is relatively well synchronized with the impulsive rise phase of the associated flare soft X-ray emission.
We exclude the possibility that the initial overexpansion of the erupting flux is caused by decreasing ambient pressure (as the flux rises) or by photospheric motions and suggest that it results from one or a combination of the following two effects. First, an expansion of the flux surfaces of the poloidal flux external to the actual rope, which is caused by flux conservation for decreasing current through the rope. The decrease in the current results from the rise of a line-tied rope in ideal MHD. Second, the addition of flux by reconnection in a current sheet under a strongly developing, possibly newly forming, flux rope.
Our main conclusions are the following.
-
1.
The 3D expansion of the investigated fast CME exhibits twophases in the course of the main upward acceleration.
-
2.
The first phase is characterized by an overexpansion, i.e., decreasing aspect ratio, of the CME cavity.
-
3.
The second phase is characterized by approximately self-similar evolution of the cavity.
-
4.
The pulse-like horizontal expansion (parallel to the solar surface) of the CME cavity at low coronal heights triggers a freely propagating EUV wave.
Being obtained for a single event, these results explicitly refer to impulsively accelerated, fast CMEs. They require substantiation through the study of more eruptions, which is currently underway. Since fast and slow CMEs may eventually be explained by a single physical model (e.g., Vršnak et al. 2005; Török & Kliem 2007), our results should be relevant to CMEs in general.
Online material
Movie 1 Access Supplementary Material
Movie 2 Access Supplementary Material
Movie 3 Access Supplementary Material
Movie 4 Access Supplementary Material
Acknowledgments
The SECCHI data used here were produced by an international consortium of the Naval Research Laboratory (USA), Lockheed Martin Solar and Astrophysics Lab (USA), NASA Goddard Space Flight Center (USA), Rutherford Appleton Laboratory (UK), University of Birmingham (UK), Max − Planck − Institut for Solar System Research (Germany), Centre Spatiale de Liège (Belgium), Institut d’Optique Théorique et Appliquée (France), and Institut d’Astrophysique Spatiale (France). We gratefully acknowledge very constructive discussions with T. G. Forbes about cavity expansion, which significantly helped to interpret the results. We also thank the referee for helpful comments. This work was suported by NASA grants NNH06AD58I and NNX08AG44G, by an STFC Rolling Grant, and by the DFG.
References
- Aschwanden, M. J. 2009, Ann. Geophys., 27, 3275 [NASA ADS] [CrossRef] [Google Scholar]
- Attrill, G. D. R., Harra, L. K., van Driel-Gesztelyi, L., & Démoulin, P. 2007, ApJ, 656, L101 [NASA ADS] [CrossRef] [Google Scholar]
- Auchère F., Soubrié E., Bocchialini K., & Legall F. 2008, Sol. Phys., 248, 213 [Google Scholar]
- Chen, J., Howard, R. A., Brueckner, G. E., et al. 1997, ApJ, 490, L191 [Google Scholar]
- Dere, K. P., Brueckner, G. E., Howard, R. A., et al. 1997, Sol. Phys., 175, 601 [NASA ADS] [CrossRef] [Google Scholar]
- Dere, K. P., Brueckner, G. E., Howard, R. A., Michels, D. J., & Delaboudiniere, J. P. 1999, ApJ, 516, 465 [NASA ADS] [CrossRef] [Google Scholar]
- Delannée, C., Török, T., Aulanier, G., & Hochedez, J.-F. 2008, Sol. Phys., 247, 123 [NASA ADS] [CrossRef] [Google Scholar]
- Forbes, T. G. 2000, J. Geophys. Res., 105, 23153 [NASA ADS] [CrossRef] [Google Scholar]
- Forbes, T. G., Linker, J. A., Chen, J., et al. 2006, Space Sci. Rev., 123, 251 [NASA ADS] [CrossRef] [Google Scholar]
- Gallagher, P. T., Lawrence, G. R., & Dennis, B. R. 2003, ApJ, 588, L53 [Google Scholar]
- Garcia, H. A. 1994, Sol. Phys., 154, 275 [NASA ADS] [CrossRef] [Google Scholar]
- Gibson, S. E., Foster, D., Burkepile, J., de Toma, G., & Stanger, A. 2006, ApJ, 641, 590 [NASA ADS] [CrossRef] [Google Scholar]
- Green, L. M., Kliem, B., Török, T., van Driel-Gesztelyi, L., & Attrill, G. D. R. 2007, Sol. Phys., 246, 365 [NASA ADS] [CrossRef] [Google Scholar]
- Howard, R., Moses, J. D., Vourlidas, A., et al. 2008, Space Sci. Rev., 136, 67 [NASA ADS] [CrossRef] [Google Scholar]
- Isenberg, P. A., & Forbes, T. G. 2007, ApJ, 670, 1453 [NASA ADS] [CrossRef] [Google Scholar]
- Kaiser, M. L., Kucera, T. A., Davila, J. M., et al. 2008, Space Sci. Rev., 136, 5 [NASA ADS] [CrossRef] [Google Scholar]
- Klimchuk, J. A. 2001, in Space Weather (Geophysical Monograph 125), ed. P. Song, H. Singer, G. Siscoe (Washington: Am. Geophys. Un.) 125, 143 [Google Scholar]
- Kienreich, I. W., Temmer, M., & Veronig, A. M. 2009, ApJ, 703, L118 [Google Scholar]
- Krall, J., Chen, J., Duffin, R. T., Howard, R. A., & Thompson, B. J. 2001, ApJ, 562, 1045 [NASA ADS] [CrossRef] [Google Scholar]
- Lin, J., & Forbes, T. G. 2000, J. Geophys. Res., 105, 2375 [NASA ADS] [CrossRef] [Google Scholar]
- Lin, R. P., Dennis, B. R., Hurford, G. J., et al. 2002, Sol. Phys., 210, 3 [Google Scholar]
- Lynch, B. J., Antiochos, S. K., DeVore, C. R., Luhmann, J. G., & Zurbuchen, T. H. 2008, ApJ, 683, 1192 [NASA ADS] [CrossRef] [Google Scholar]
- Maia, D., Vourlidas, A., Pick, M., et al. 1999, J. Geophys. Res., 104, 12507 [Google Scholar]
- Maričić, D., Vršnak, B., Stanger, A. L., et al. 2007, Sol. Phys., 241, 99 [Google Scholar]
- Mikić, Z., & Lee, M. A. 2006, Space Sci. Rev., 123, 57 [Google Scholar]
- Mikić, Z., & Linker, J. A. 1994, ApJ, 430, 898 [Google Scholar]
- MacQueen, R. M., & Fisher, R. R. 1983, Sol. Phys., 89, 89 [NASA ADS] [CrossRef] [Google Scholar]
- Neupert, W. M., Thompson, B. J., Gurman, J. B., & Plunkett, S. P. 2001, J. Geophys. Res., 106, 25215 [Google Scholar]
- Ontiveros, V., & Vourlidas, A. 2009, ApJ, 693, 267 [NASA ADS] [CrossRef] [Google Scholar]
- Patsourakos, S., & Vourlidas, A. 2009, ApJ, 700, L182 [NASA ADS] [CrossRef] [Google Scholar]
- Patsourakos, S., Vourlidas, A., Wang, Y. M., Stenborg, G., Thernisien, A., et al. 2009, Sol. Phys., 259, 49 [NASA ADS] [CrossRef] [Google Scholar]
- Plunkett, S. P., Brueckner, G. E., Dere, K. P., et al. 1997, Sol. Phys., 175, 699 [NASA ADS] [CrossRef] [Google Scholar]
- Plunkett, S. P., Vourlidas, A., ?imberová, S., et al. 2000, Sol. Phys., 194, 371 [NASA ADS] [CrossRef] [Google Scholar]
- Reeves, K. K. 2006, ApJ, 644, 592 [NASA ADS] [CrossRef] [Google Scholar]
- Schrijver, C. J., Elmore, C., Kliem, B., Török, T., & Title, A. M. 2008, ApJ, 674, 586 [NASA ADS] [CrossRef] [Google Scholar]
- Sheeley, N. R., Walters, J. H., Wang, Y.-M., & Howard, R. A. 1999, J. Geophys. Res., 104, 24739 [Google Scholar]
- Sheeley, N. R., Jr., Warren, H. P., & Wang, Y.-M. 2007, ApJ, 671, 926 [NASA ADS] [CrossRef] [Google Scholar]
- Stenborg, G., Vourlidas, A., & Howard, R. A. 2008, ApJ, 674, 1201 [NASA ADS] [CrossRef] [Google Scholar]
- Subramanian, P., & Vourlidas, A. 2007, A&A, 467, 685 [NASA ADS] [CrossRef] [EDP Sciences] [Google Scholar]
- Temmer, M., Veronig, A. M., Vršnak, B., et al. 2008, ApJ, 673, L95 [Google Scholar]
- Temmer, M., Veronig, A. M., Kontar, E. P., Krucker, S., & Vršnak, B. 2010, ApJ, 712, 1410 [NASA ADS] [CrossRef] [Google Scholar]
- Thernisien, A. F. R., Howard, R. A., & Vourlidas, A. 2006, ApJ, 652, 763 [Google Scholar]
- Thernisien, A., Vourlidas, A., & Howard, R. A. 2009, Sol. Phys., 256, 111 [Google Scholar]
- Thompson, W. T. Davila, J. M., & Fisher, R. R., 2003, Innovative Telescopes and Instrumentation for Solar Astrophysics, SPIE, 4853, 1 [Google Scholar]
- Titov, V. S., Priest, E. R., & Demoulin, P. 1993, A&A, 276, 564 [NASA ADS] [Google Scholar]
- Török, T., & Kliem, B. 2003, A&A, 406, 1043 [NASA ADS] [CrossRef] [EDP Sciences] [Google Scholar]
- Török, T., & Kliem, B. 2005, ApJ, 630, L97 [Google Scholar]
- Török, T., & Kliem, B. 2007, Astron. Nachr., 328, 743 [NASA ADS] [CrossRef] [Google Scholar]
- Veronig, A. M., Muhr, N., Kienreich, I. W., Temmer, M., & Vršnak, B. 2010, ApJ, 716, L57 [Google Scholar]
- Vourlidas A., Subramanian P., Dere K. P., & Howard R. A. 2000, ApJ, 534, 456 [Google Scholar]
- Vršnak, B. 2001, J. Geophys. Res., 106, 25249 [Google Scholar]
- Vršnak, B., Sudar, D., & Ruždjak, D. 2005, A&A, 435, 1149 [Google Scholar]
- Williams, D. R., Török, T., Démoulin, P., van Driel-Gesztelyi, L., & Kliem, B. 2005, ApJ, 628, L163 [NASA ADS] [CrossRef] [Google Scholar]
- Wood, B. E., & Howard, R. A. 2009, ApJ, 702, 901 [Google Scholar]
- Wood, B. E., Karovska, M., Chen, J., et al. 1999, ApJ, 512, 484 [Google Scholar]
- Wuelser, J. P., Lemen, J. R., Tarbell, T. D., et al. 2004, Proc. SPIE, 5171, 111 [NASA ADS] [CrossRef] [Google Scholar]
- Zhang, J., & Dere, K. P. 2006, ApJ, 649, 1100 [Google Scholar]
- Zhang, M., & Low, B.-C. 2005, ARA&A, 43, 103 [Google Scholar]
- Zhang, J., Dere, K. P., Howard, R. A., Kundu, M. R., & White, S. M. 2001, ApJ, 559, 452 [Google Scholar]
All Figures
|
Fig. 1 Overview of the pre-eruption configuration at 18:38:30 UT on 25 March 2008 in STB (left column) and STA (right column). Wavelet-enhanced EUVI 171 Å images are shown. The images in the bottom row are enlargements of the erupting active region, which is marked by boxes in the upper panels. The temporal evolution is shown in the movie in the online edition (movie1.mpg). Solar north is on top. |
| In the text | |
|
Fig. 2 Selected EUVI 171 Å snapshots during the eruption sequence. Left column: STB, right column: STA. Time increases from bottom to top. The dash-dotted cicles in the 18:51 UT images show our identification of the EUV cavity (“bubble”). Also marked are deflected structures, which can be easily misidentified as part of the erupting bubble if no proper 3D analysis is performed (Sect. 3). The temporal evolution is shown in the movie in the online edition (movie2.mpg). |
| In the text | |
|
Fig. 3 Composite of EUVI 171 Å and COR1 white-light images from STA and STB showing the emergence of the EUVI bubble into the COR1 field of view, where it becomes the cavity of a typical three-part CME. |
| In the text | |
|
Fig. 4 Base-ratio images for representative snapshots during the event. Each EUVI 171 Å image is divided by the corresponding pre-event image taken at 18:39:45 UT. The resulting ratios are scaled into the range 0.2–1.8 for each frame. The pixel size is not rescaled, so that the solar radius differs slightly, because it is smaller by ≈5% for STB. The temporal evolution is shown in the movies in the online edition (movie3.mpg, movie4.mpg). |
| In the text | |
|
Fig. 5 Outlines of the envisioned croissant-shaped flux rope with a bubble-like enhancement in its center; left: STB view, right: STA view. Solid red lines represent edges of the erupting flux. Thick arcs indicate the bubble (edge of middle cross section for STA and edge of cross section in rear part for STB). Thin arcs indicate the croissant-shaped extensions of the bubble to the photospheric sources of the erupting flux. Dashed and dotted red lines indicate edges that are not visible (because they nearly coincide with other edges, are occulted, or are at different temperature). Dash-dotted yellow lines indicate the magnetic axis of the structure. See Sect. 3 for further explanations. |
| In the text | |
|
Fig. 6 Representative fits of the bubble by our 3D ice-cream cone model in EUVI 171 Å data from STA and STB. Each STA and STB image is shown twice: once without and once with the 3D model (red wireframe) overplotted. |
| In the text | |
|
Fig. 7 Similar to Fig. 6, but for the coronagraph images of the CME. |
| In the text | |
|
Fig. 8 Time evolution of bubble front height, h(t) + r(t), from EUVI and COR1 data (final two datapoints) and its fit by the function given in Eq. (1) (upper panel). Velocity (middle) and acceleration (bottom) of bubble front derived from the fit. Error bars show 1σ uncertainties obtained by Monte Carlo simulations (see Sects. 4 and 5 for detail). |
| In the text | |
|
Fig. 9 Time evolution of bubble center height h, radius r, and aspect ratio κ, as determined by the 3D ice-cream cone model from simultaneous fitting of the STA and STB EUVI and COR1 observations. |
| In the text | |
|
Fig. 10 Evolution of bubble aspect ratio (squares, from Fig. 9) and acceleration (dashed, from Fig. 8) compared to the 25–50 keV light curve (dotted) from RHESSI (Lin et al. 2002) and to the 1–8 Å light curve (dashed-dotted) from GOES (Garcia 1994). Normalized quantities are plotted. RHESSI was in spacecraft night prior to 18:45 UT (t < 240 s). |
| In the text | |
|
Fig. 11 Sequence of STA 171 Å base-ratio images at 18:49, 18:53:30, 18:56, and 18:59 UT, showing the launch of the EUV wave by the horizontal expansion of the CME cavity (which is far more strongly expressed in the southward direction due to the initially nonradial rise of the CME) and the subsequent detachment of the wave front from the cavity. Due to the upward rise of the cavity, its horizontal expansion at heights h ≲ (0.2–0.3)R⊙ in both northern and southern directions has terminated by the time of the final panel. The wave in the northern direction is much slower, but can be seen clearly in the corresponding animations in the online edition. |
| In the text | |
Current usage metrics show cumulative count of Article Views (full-text article views including HTML views, PDF and ePub downloads, according to the available data) and Abstracts Views on Vision4Press platform.
Data correspond to usage on the plateform after 2015. The current usage metrics is available 48-96 hours after online publication and is updated daily on week days.
Initial download of the metrics may take a while.