Fig. 1
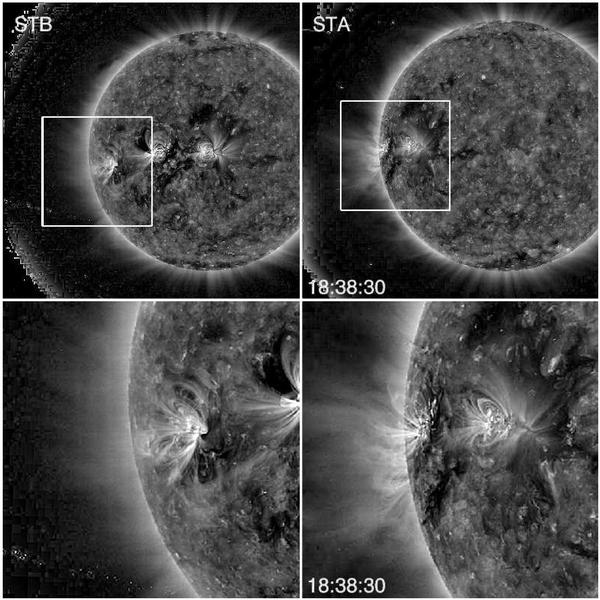
Overview of the pre-eruption configuration at 18:38:30 UT on 25 March 2008 in STB (left column) and STA (right column). Wavelet-enhanced EUVI 171 Å images are shown. The images in the bottom row are enlargements of the erupting active region, which is marked by boxes in the upper panels. The temporal evolution is shown in the movie in the online edition (movie1.mpg). Solar north is on top.
Current usage metrics show cumulative count of Article Views (full-text article views including HTML views, PDF and ePub downloads, according to the available data) and Abstracts Views on Vision4Press platform.
Data correspond to usage on the plateform after 2015. The current usage metrics is available 48-96 hours after online publication and is updated daily on week days.
Initial download of the metrics may take a while.