Free Access
Fig. 6
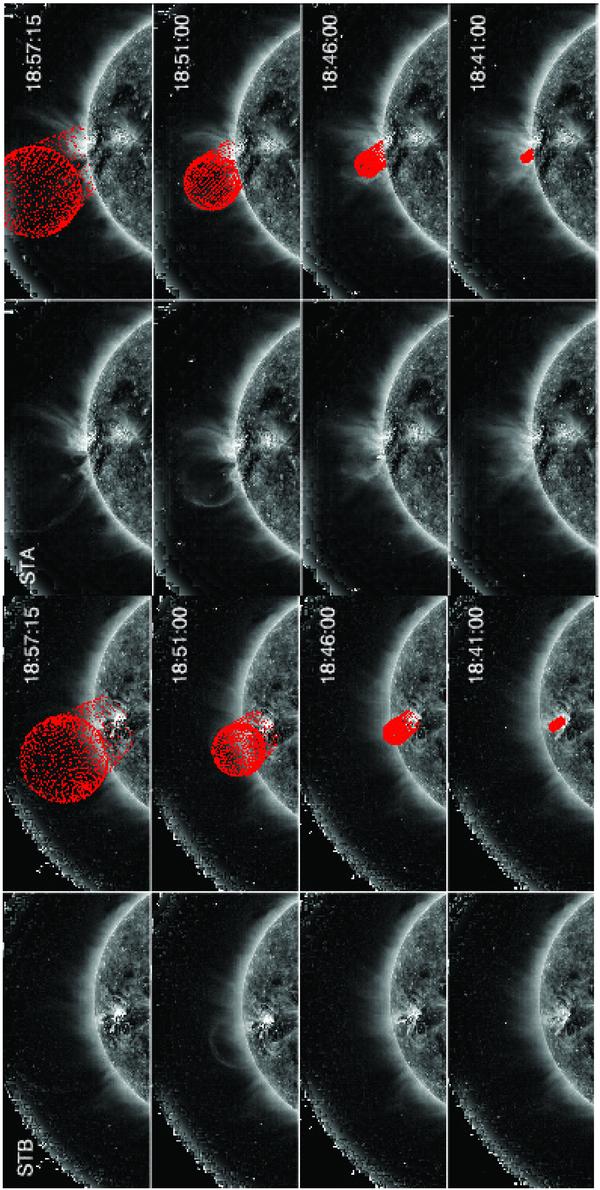
Representative fits of the bubble by our 3D ice-cream cone model in EUVI 171 Å data from STA and STB. Each STA and STB image is shown twice: once without and once with the 3D model (red wireframe) overplotted.
Current usage metrics show cumulative count of Article Views (full-text article views including HTML views, PDF and ePub downloads, according to the available data) and Abstracts Views on Vision4Press platform.
Data correspond to usage on the plateform after 2015. The current usage metrics is available 48-96 hours after online publication and is updated daily on week days.
Initial download of the metrics may take a while.