Fig. 2
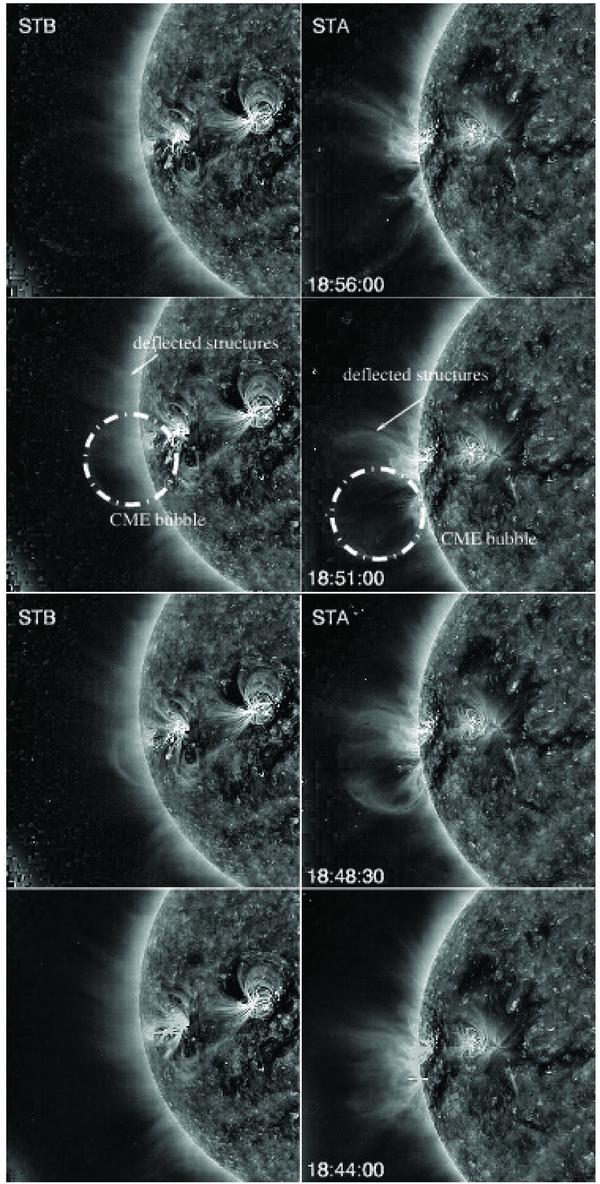
Selected EUVI 171 Å snapshots during the eruption sequence. Left column: STB, right column: STA. Time increases from bottom to top. The dash-dotted cicles in the 18:51 UT images show our identification of the EUV cavity (“bubble”). Also marked are deflected structures, which can be easily misidentified as part of the erupting bubble if no proper 3D analysis is performed (Sect. 3). The temporal evolution is shown in the movie in the online edition (movie2.mpg).
Current usage metrics show cumulative count of Article Views (full-text article views including HTML views, PDF and ePub downloads, according to the available data) and Abstracts Views on Vision4Press platform.
Data correspond to usage on the plateform after 2015. The current usage metrics is available 48-96 hours after online publication and is updated daily on week days.
Initial download of the metrics may take a while.