Fig. 5
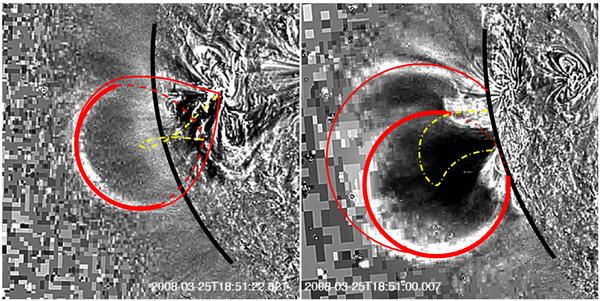
Outlines of the envisioned croissant-shaped flux rope with a bubble-like enhancement in its center; left: STB view, right: STA view. Solid red lines represent edges of the erupting flux. Thick arcs indicate the bubble (edge of middle cross section for STA and edge of cross section in rear part for STB). Thin arcs indicate the croissant-shaped extensions of the bubble to the photospheric sources of the erupting flux. Dashed and dotted red lines indicate edges that are not visible (because they nearly coincide with other edges, are occulted, or are at different temperature). Dash-dotted yellow lines indicate the magnetic axis of the structure. See Sect. 3 for further explanations.
Current usage metrics show cumulative count of Article Views (full-text article views including HTML views, PDF and ePub downloads, according to the available data) and Abstracts Views on Vision4Press platform.
Data correspond to usage on the plateform after 2015. The current usage metrics is available 48-96 hours after online publication and is updated daily on week days.
Initial download of the metrics may take a while.