| Issue |
A&A
Volume 709, May 2026
|
|
|---|---|---|
| Article Number | A114 | |
| Number of page(s) | 14 | |
| Section | Catalogs and data | |
| DOI | https://doi.org/10.1051/0004-6361/202452939 | |
| Published online | 07 May 2026 | |
Revealing unresolved white dwarf-main sequence binaries using Gaia DR3 and GALEX
I. A Volume limited study of 100 pc
Instituto de Astrofísica, Pontificia Universidad Católica de Chile,
Av. Vicuña MacKenna 4860,
7820436
Santiago,
Chile
★ Corresponding author: This email address is being protected from spambots. You need JavaScript enabled to view it.
; This email address is being protected from spambots. You need JavaScript enabled to view it.
Received:
9
November
2024
Accepted:
20
March
2026
Abstract
Context. Understanding the demographics of white dwarf-main sequence (WDMS) binaries is key to uncovering the formation of various stellar exotica and refining the details of binary stellar evolution. Despite several dedicated efforts to identify unresolved WDMS binaries, their population remains incomplete, even within a 100 pc volume-limited sample.
Aims. This study aims to identify WDMS binaries hidden within the MS of the optical color-magnitude diagram (CMD), improving the completeness of WDMS binaries within a volume-limited sample of 100 pc.
Methods. We used near-ultraviolet (NUV)-optical CMDs to distinguish unresolved WDMS binaries from the rest of the populations. High-precision astrometric and photometric data from Gaia DR3 and NUV data from GALEX GR6/7 were combined to construct CMDs. Using the binary spectral energy distribution (SED) fitting algorithm within the Virtual Observatory SED Analyzer (VOSA) tool, we estimated stellar parameters such as effective temperature, bolometric luminosity, and radii. The WD masses were determined using WD evolutionary models. As we used the sources that were only detected in the NUV band of GALEX, this study directly complements the majority of the previous studies.
Results. We identify 347 WDMS binary candidates within 100 pc, with 188 being newly reported. Our method predominantly identifies binaries with cooler WDs (≤10 000 K) compared to previous studies. The WD masses range from ∼0.2 and 1.3 M⊙, and most MS companions are of M spectral type.
Key words: binaries: general / white dwarfs / solar neighborhood / ultraviolet: general
© The Authors 2026
 Open Access article, published by EDP Sciences, under the terms of the Creative Commons Attribution License (https://creativecommons.org/licenses/by/4.0), which permits unrestricted use, distribution, and reproduction in any medium, provided the original work is properly cited.
This article is published in open access under the Subscribe to Open model. This email address is being protected from spambots. You need JavaScript enabled to view it. to support open access publication.
1 Introduction
A significant fraction of stellar sources form as components of binary or multiple systems (Iben 1991). Depending on the initial separation in a binary system, the massive star can significantly influence its companion’s evolution. Thus, studying binary stars plays a key role in understanding stellar evolution. However, the majority of them are photometrically unresolved binaries. In this context, multiwavelength approaches helped to identify several white dwarf-main sequence (WDMS) binaries (Rebassa-Mansergas et al. 2012a; Ren et al. 2018; Anguiano et al. 2022), yet the census remains far from complete, even within the solar neighborhood. (Rebassa-Mansergas et al. 2021, hereafter RM21). A large and homogeneous sample of WDMS binaries is also essential for informing binary population synthesis studies, providing meaningful constraints on several uncertain aspects of binary stellar evolution (Toonen et al. 2017; Torres et al. 2022).
Investigating compact WDMS binaries, where the systems go through a common envelope (CE) phase, is key to constraining the efficiency and energy budget of CE evolution (Zorotovic et al. 2010; Rebassa-Mansergas et al. 2012b; Camacho et al. 2014; Zorotovic et al. 2014), determining the critical mass ratio that governs stable versus unstable mass transfer (e.g., Bobrick et al. 2017), and refining the mass-radius relation of WDs (Parsons et al. 2017). In close compact binaries, mass accretion onto a WD can potentially trigger a Type Ia supernova, a key astronomical event (Wang & Han 2012). Conversely, mass loss from the WD progenitor, through either CE or Roche lobe overflow, can lead to the formation of extremely low-mass white dwarfs (ELM-WDs) with masses ≤0.3 M⊙ (Istrate et al. 2014b,a; Nandez et al. 2015). On the other hand, in wide-orbit WDMS binaries, both stars evolve independently without influencing each other’s evolution, leading the more massive star to eventually become a WD (García-Berro et al. 1997; Farihi et al. 2010). Analyzing these wide systems provides valuable insights into the age-metallicity relation in the solar neighborhood (Rebassa-Mansergas et al. 2016a, 2021), the secondary mass function (Ferrario 2012), and the relationship between age, activity, and rotation (Morgan et al. 2012; Rebassa-Mansergas et al. 2013b; Skinner et al. 2017). Therefore, studying WDMS binaries is essential for uncovering the formation of diverse stellar exotica and constraining the processes involved in binary stellar evolution.
There have been several previous attempts to search for a large number of WDMS binaries using various tools such as the UV color-temperature relation and UV-optical color-magnitude diagrams (CMDs) and using χ2 template-fitting techniques or wavelet-based spectral decomposition on observed spectra, where the hot WD contributes distinct H-Balmer lines or excess continuum features in the blue and/or UV region. A few thousand spectroscopic WDMS binaries with M dwarf companions have been detected using the Sloan Digital Sky Survey (SDSS; York et al. 2000; Eisenstein et al. 2011; Rebassa-Mansergas et al. 2012a, 2016b) and the Large Sky Area Multi-Object Fiber Spectroscopic Telescope Survey (LAMOST; Cui et al. 2012; Chen et al. 2012; Ren et al. 2018). The low resolution BP/RP (XP) spectra of Gaia data release 3 (DR3) have also been recently used to identify WDMS binaries (Rebassa-Mansergas et al. 2025; Pérez-Couto et al. 2025; Li et al. 2025). Several previous studies (Parsons et al. 2016; Rebassa-Mansergas et al. 2017; Anguiano et al. 2020; Ren et al. 2020) have used Teff versus the (FUV-NUV) color relation to distinguish WDMS binaries from the MS populations, where Teff values have been obtained from LAMOST or the Radial Velocity Experiment (RAVE; Kordopatis et al. 2013; Kunder et al. 2017) and UV data have been obtained from the Galaxy Evolution Explorer (GALEX; Martin et al. 2005). Recently, Nayak et al. (2024) and Jackim et al. (2024) used UV and optical CMDs as a tool to separate WDMS binary candidates from MS populations by combining Gaia and GALEX data. Astrometric solutions from the Tycho-Gaia astrometric solution (TGAS; Michalik et al. 2015), Gaia-DR2 (Evans et al. 2018), and Gaia DR3 (Gaia Collaboration 2023) have also been used to identify WDMS candidates (Andrews et al. 2022; Shahaf et al. 2023).
Despite several dedicated studies identifying unresolved WDMS binaries, their population is still incomplete even within a volume-limited sample of 100 pc (RM21). Through simulation, RM21 showed that ≈91% of WDMS binaries are hidden within the MS region of the optical CMD; however, their study focused on the remaining ≈9% of the WDMS binary populations within a 100 pc volume of the solar neighborhood located in the gap region between WD and MS regions in the optical CMD. As mentioned above, spectroscopic surveys in combination with UV photometric surveys were also used to find these hidden WDMS binaries in the MS, but all the current spectroscopic surveys are restricted by the magnitude limit. The binary candidates found by astrometric solutions also require further UV or spectroscopic observations to confirm their candidature (Ganguly et al. 2023).
Recently, Nayak et al. (2024, hereafter N24) targeted a volume-limited sample within 100 pc to reveal the hidden ≈91% of WDMS binaries. The authors used UV and optical CMDs by combining the data from GALEX and Gaia DR3 to identify the binaries. However, N24 considered only those sources with both FUV and NUV detections in GALEX, which led them to find WDMS binaries with relatively hotter WDs. Studies by RM21 and Rebassa-Mansergas et al. (2025, hereafter RM25) included sources where only a NUV observation or no GALEX UV observations were present; however, the sources were confined within the gap region between the WD and MS loci in the Gaia CMD. In a recent study on single and binary WDs using Gaia and GALEX, Jackim et al. (2024) also included the sources that were only detected in the NUV band. However, there are a few things that were not considered in their study and can be included for better estimation of WDMS parameters. The artifacts and spurious sources from the GALEX data were not removed. Primary selection of WD binary candidates using UV-optical CMDs does not include extinction correction. Though extinction was included in determining the parameters of WD binary candidates, the use of 2D extinction (Schlegel et al. 1998) led to larger values even for the sources located within a few 100 pc where the extinction is found to be negligible (RM21; N24). The parameter estimation of WD binaries mainly includes the data from GALEX and Gaia, and wherever SDSS data are available. Considering the majority of the MS companions in the binary samples are low-mass M dwarfs, a spectral energy distribution (SED) with a larger wavelength coverage including the near-infrared (NIR) observations is necessary for the better estimation of their parameters. Choosing the wrong extinction values and the noninclusion of NIR observations can make a WD binary appear as a single WD (N24). Therefore, better constraints on the selection of data with a longer wavelength coverage and the use of 3D extinction models are necessary to construct a homogeneous and complete sample of WDMS binaries and to improve the estimation of their parameters.
In this paper, we aim to identify the WDMS binaries that are hidden within the MS of the optical CMD within a volumelimited sample of 100 pc to improve the completeness of WDMS binaries. Within 100 pc, photometric and astrometric solutions are expected to be more accurate and less affected by Galactic extinction. We used Gaia DR3 and GALEX GR6/7 data for the initial selection of WDMS candidate binaries and implemented several cut-off criteria to remove artifacts and sources with bad photometry and astrometric solutions. Nevertheless, we decided to primarily focus on the GALEX sources with no FUV detection or with FUV detection with artifacts for this study, which makes this work complementary to the previous studies (Ren et al. 2020; Anguiano et al. 2022; Nayak et al. 2024) where sources with both FUV and NUV detections were considered. Identification and parameterization of WDMS binaries, where only NUV or no UV detections are available, are also present in the literature but the authors had studied either only the gap region of the Gaia CMD (RM21; RM25) or only the WD region (Pérez-Couto et al. 2025), or used the optical color-color diagram and CMDs (Li et al. 2025) to identify the WDMS binaries. Therefore, this work also complements the abovementioned studies. Our selection criteria also include the NUV bright MS sources located in the gap region between the WD and MS loci in the NUV-optical CMD, that were not included in the recent study by Jackim et al. (2024). In our sample selection, we also included the sources that have both FUV and NUV detection with good photometric detections as mentioned in N24, but we used only NUV data for identification and parameter estimations. Parameters of these sources are compared with the literature values from N24, RM21, RM25 and Ren et al. (2020), where both FUV and NUV data were used for parameter estimation, which gives confidence in our estimates and in implementing our method to the sources with only NUV detection. Finally, we examine the possibility of contamination from active M dwarfs in our catalog, which are also known for their excess UV emission due to stellar activity. However, the literature suggests that such contamination is found to be negligible in the UV and UV-optical CMDs (Anguiano et al. 2022; Nayak et al. 2024; Jackim et al. 2024).
In Section 2, we describe the data selection criteria, as well as the methods used to identify the WDMS binary candidates and to estimate their stellar parameters. In Section 3, we discuss our results and a separate method to estimate WD mass (Section 3.1, examine the contamination from chromospherically active MS stars in our catalog (Section 3.2), compare our catalog with previous studies (Section 3.3), compare our results with optical spectroscopic surveys (Section 3.4, and determine the completeness of our catalog (Section 3.5). We conclude our results in Section 4.
2 Data selection and characterization
In this section, we describe the cut-off criteria to select reliable Gaia DR3 and GALEX NUV data and the selection procedures of WDMS candidate binaries in this study. Furthermore, we also discuss the estimation of the stellar properties of both companions of these binaries.
Summary of the number of sources after each data selection criteria.
2.1 Data selection
First, we used Gaia DR3 to identify the sources within 100 pc. Then, we applied the following conditions to remove the sources with larger photometric (fluxes in G, BP and RP bands) and astrometric (parallax) errors1
ϖ/σϖ ≥ 10
IBP/σIBP ≥ 10
IRP/σIRP ≥ 10
IG/σIG ≥ 10,
where ϖ is the parallax in arcseconds, IG, IBP and IRP are the fluxes in the bandpass filters G, BP and RP, respectively, and σ are the standard errors of the corresponding parameters. We find 306 515 Gaia sources after applying the above selection criteria. Gaia provides source coordinates in J2016.5 epoch, whereas all the other archival UV, optical and NIR datasets are cataloged in J2000. Therefore, we used Gaia DR3's astrometric solutions to convert the coordinates from J2016.5 to J2000 epoch. We then cross-matched these sources with the GALEX GR6+7 catalog and found 50 985 sources in common (after removing duplicates matches) detected either in both the FUV and NUV bands or at least in the NUV. To ensure reliable photometry, we applied quality cuts to the GALEX data, retaining only point-like sources detected in the NUV band. Specifically, we selected sources flagged as Nafl = 0 and Nexf = 0, thereby removing artifacts (e.g., bright star near field edge, bad pixel etc.) and extended sources appeared in the NUV band of the GALEX catalog2. We did not impose any quality cuts on the FUV detections, as the FUV data were not used for identification or parameterization in the present analysis. Thus, the sample includes sources with both good and poor FUV data but reliable NUV measurements. Identification of WDMS binary candidates having reliable photometry in both FUV and NUV bands has already been studied by N24, therefore, this study directly complements that work. We notice that all the selected sources have NUV photometric errors ≤0.5 mags, so, we did not apply additional filtering criteria on NUV photometric errors. Applying these source selection criteria, we are left with 30486 sources. The summary of data selection is presented in Table 1.
2.2 Identification of candidates
We analyzed these 30 486 sources to construct optical and NUV-optical CMDs in absolute magnitudes plane after taking into account the distance modulus obtained from Gaia’s DR3 catalog (Bailer-Jones et al. 2021) and extinctions obtained from a three-dimensional (3D) Dust Map (MWDUST3; Drimmel et al. 2003; Marshall et al. 2006; Bovy et al. 2016; Green et al. 2019). We used these CMDs as a tool to identify WDMS binary candidates. The left panel of Figure 1 shows the NUV-optical CMD (NUV-BP versus NUV) of all the sources of interest. Cyan and black lines represent isochrones of ages 100 Myr and 1 Gyr, respectively, generated using the MIST isochrone package (Dotter 2016; Choi et al. 2016) to demonstrate the MS and post-MS (gray asterisks), and WD evolutionary sequences as references. The blue asterisks and green circles both indicate the NUV bright populations that include WD and the sources fall in the gap region between the WD and MS populations, separated by the red lines using the following photometric cuts:
NUVabs > 1.8 × (NUV - BP)abs + 3.0
NUVabs > 4.0 × (NUV - BP)abs – 14.0.
We marked these NUV bright sources in the optical CMD, as shown in the right panel of Figure 1, to check whether they are distributed in similar evolutionary sequences or not. We noticed that the hot NUV-bright population identified in the NUV-optical CMD divided into two distinct groups in the optical CMD separated by the red line defined as Gabs = 4.25 × (BP - RP)abs + 9.75. The blue asterisks represent the WD populations, while a large fraction (~65%) of the NUV-bright sources marked as green circles show up in the MS region and a few in the gap region between the MS and the WD cooling sequence. This suggests that the sources marked as green are the potential unresolved WDMS binary candidates. When the WD mainly contributes to the UV and the MS to the optical, the source appears among the hot WDs and in the gap region in the NUV-optical CMD, but shows up among the MS stars in the optical CMD. However, if the WD also contributes to the optical, the source might appear in the gap region between the MS and the WD cooling sequence in the optical CMD. We identified 6559 candidates based on this shift in CMDs within our sources of interest.
2.3 Characterization of WDMS binaries
To confirm whether these 6559 candidates are indeed WDMS binaries and to determine their stellar parameters, we further analyzed their SEDs. To construct observed SEDs of the WDMS candidates ranging from UV to NIR wavelengths, we first crossmatched them with following surveys: APASS DR9 (Henden et al. 2015), PanSTARRS-DR2 (Magnier et al. 2020) and SDSS DR16 for optical, and 2MASS (Skrutskie et al. 2006) and ALLWISE (Wright et al. 2010) for NIR observations. We did not get any crossmatch for only one source and we proceeded with 6558 candidates for SED analyses. We used the virtual observatory SED analyzer’s (VOSA; Bayo et al. 2008) in order to construct observational SEDs, to fit the observed SEDs with combined theoretical models of WD and MS using binary fit algorithm and to extract the best-fit stellar parameters for both companions simultaneously.
We used the BT-Settl-CIFIST models (Baraffe et al. 2015) for the MS star. For our purposes, we used the full range for Teff (1200-7000 K) available in VOSA but restrict ourselves to 4.5 ≤ log g ≤ 5.5 since MS stars are expected to have log g within this range. We used WD evolution models of Koester (2010) included in the VOSA toolkit which provides spectra for H-rich WDs. We considered the full range of Teff (500080 000 K) and log g (6.5-9.5) for WD models. Since our sources are all within 100 pc by selection, we considered solar metal-licity for all of them. VOSA performs multiple iterations by varying Teff, log g, and scaling factor (Md) to minimize χ2 to find the best-fit spectra to the observed flux distribution. The scaling factor Md ≡ (R/D)2 is used to scale the model flux to match the observed flux, where R and D denote the radius and distance of the source. In our exercise, since the distance is already known from Gaia, the scaling factor gives us the radius.
VOSA provided best-fit stellar parameters (Teff, log g, luminosity, radius of both the components) using a χ2 minimization technique for 6556 candidates and it was unable to provide a solution for only two candidates because of the small number of data points. However, unlike in the study of N24, where both FUV and NUV data (representing the WD component of a binary) were used for SED analyses, in the present work only a single data point, the NUV flux, is present in the UV region. Although, the presence of excess emission in the NUV band suggesting that these sources are most probable WDMS binary candidates, fitting WD theoretical model spectra mainly to one UV data point can lead to degenerate or poorly constrained of the WD parameters estimation, particularly when combined with the dominant optical-NIR flux from the main-sequence star. To reduce such degeneracies, we introduced a selection step. For each source, we examined the fractional residual flux (fresidue), defined as the fractional difference between the observed and model-predicted flux ((Fλ,obs - Fλ,model)/(Fλ,obs)), where Fλ is the observed flux at waveband λ and subscripts “obs” (“model”) denotes the observed (best-fit model) flux. We selected those candidates for which the fresidue exceeded 50% in both the NUV band and in the next bluest optical band with respect to the BT-Settl-CIFIST model spectra representing single main-sequence stars4.
However, we note that the implementation of the selection criterion on fresidue introduces a selection bias toward WDMS binaries hosting cooler white dwarfs and late-type MS companions (i.e., K and M dwarfs). The GALEX NUV band, with an effective wavelength of λeff ≈ 2316 Å, is primarily sensitive to blackbody temperatures of ~10 000-16 000 K, as inferred from Wien’s displacement law (λmaxT = 2.897 × 10⁻³, m, K). Consequently, our method is expected to detect WDs preferentially cooler than ~ 16 000 K, while the parameter estimation for hotter WDs is expected to carry larger uncertainties due to lack of FUV data point. In addition, this selection criterion requires that the bluest optical band remains dominated by WD flux, which in turn biases the MS companions toward later spectral types. Considering the bluest optical point to be the Pan-STARRS g band, with λeff ≈ 4810 Å (corresponding to blackbody temperatures of ~5300-7200 K via Wien’s law), the companion stars in our sample are expected to be cooler than ~5000 K, corresponding predominantly to K-M spectral types.
As reported in the literature (RM21 ; N24), smaller observational errors often lead to higher χ2 values despite the visual inspection suggesting them to be well-fitted SEDs. Conversely, visually inspected badly fitted SEDs can also have smaller χ2 due to larger photometric errors. Therefore, following RM21 and N24, we implemented two criteria for the goodness of the fit:
Vgfb < 15: Vgfb is called the visual goodness of fit, introduced in the VOSA by modifying the χ2red formula, where the error is considered to be at least 10% of its observed flux5.
|fresidue|< 0.5 absolute fractional residual flux (|fresidue|) is defined as |(Fλ,obs - Fλ,model)/(Fλ,obs)|. Here Fλ,model corresponds to best-fitted combined flux of WD and MS theoretical model spectra at the corresponding waveband λ. The NUV data and the next bluest optical optical band data must individually satisfy this criterion. In addition, in the optical-IR region, more than 80% of the data points must satisfy this criterion.
Therefore, we consider the SEDs to be well-fitted by the theoretical models when the sources satisfy both the Vgfb and the fresidue criteria simultaneously. We find that there are 361 candidates with well-fitted SEDs out of 1417. The SEDs of the other 1056 candidates could not be fitted well with WDMS composite model spectra using VOSA according to our criteria. The poor fit to the rest of the candidates to the WDMS binary model could be due to various factors, including, but not limited to, inaccurate cross-matching, UV excess originating from stellar activity of the MS star rather than a WD, or contamination from nearby stars in the optical/IR.
In Figure 2, we show the SEDs of two well-fitted WDMS binaries. Observed fluxes in different filters are represented as cyan points with blue error bars. The asterisks symbols denote bad photometric data points with artifacts or upper-limit flux values, and these data points are not included in the fit. The black and gray spectra represent the best-fit WD and MS models to the observed SEDs, respectively. The combined model fluxes in the respective filters are represented by red points and linked with a red dashed line. The best-fitted parameters for WD and MS are noted in the legend. Gaia DR3 source ID,  , Vgf, Vgfb, and AV values are also noted at the top of each plot. fresidue values in respective bands are shown in the bottom panel of each plot. The match between the cyan and red points, and fresidue of less than 50% in all the bands indicate goodness of fits based to our criteria. However, upon visual inspection of all 361 well-fitted SEDs, we find that some fits exhibit one of the following issues: the UV region is fitted with an MS SED model while the optical-NIR region is fitted with a WD SED model, leading to a hotter temperature for the MS companion than for the WD (left panel of Figure 3); the temperature difference between the MS and WD components is only a few 100 K, comparable to the uncertainty in temperature; only a few photometric points are used to fit the MS component of the SED (right panel of Figure 3); or the NIR photometric bands are over-fitted. We further excluded 14 such sources from well-fitted SEDs catalog due to one of the above reasons. The right panel of Figure 3 demonstrate a perfect example on the importance to the inclusion of NIR data in the SED analysis for proper estimation of parameters.
Therefore, we finally catalog 347 candidate WDMS binaries with well-fitted SEDs. The catalog of 347 candidates is available on Zenodo and at the CDS with the following information: Gaia DR3 and GALEX IDs, stellar parameters, and the values of  , Vgfb, and |fresidue| in the NUV and the next bluest optical bands. A representative part of the catalog is presented in Table A.1. We also provide the catalog of 1070 badly fitted candidates on Zenodo and at the CDS containing their positions, Gaia DR3 and GALEX IDs. SEDs of all the well-fitted WDMS binary candidates as well as badly fitted candidates are also available on Zenodo and at the CDS. We also provide a separate catalog of all the 6559 UV bright sources, identified based on shift in the CMDs (blue points in the Figure 1), that includes coordinates, IDs and magnitude of all photometric surveys used in this study.
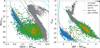 |
Fig. 1 CMDs for sources within 100 pc in the absolute plane after correcting for distance modulus and extinction, where the subscript “abs” stands for absolute magnitude. In both of the panels, isochrones of 100 Myr (cyan line) and 1 Gyr (black line) are overlaid to indicate the evolutionary sequences, and the gray asterisks indicate MS and post-MS populations. Left: UV-Optical CMD (NUV-BP versus NUV). The red line separates the hotter and NUV-bright sources (blue asterisks, green circles and orange plus) from the others (gray asterisks) on the NUV-optical CMD. Right: optical CMD (BP-RP versus G). The red line separates the blue asterisks (WD populations) from the rest of the NUV-bright sources (green circles and orange plus) that are located on the MS or with within the gap region between WD and MS. These green circles represent WDMS binary candidates. Orange plus highlights the candidates for which we could fit observed SED from UV to IR with WDMS composite model fluxes using the VOSA tool. |
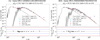 |
Fig. 2 Two examples of well-fitted SEDs of WDMS binaries. Index number as per Table A.1, Gaia DR3 source ID, the values of AV, |

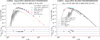 |
Fig. 3 Same as Figure 2 but for two representative examples of badly fitted SEDs of WDMS candidate binaries. Index number as per the online catalog at the CDS, Gaia DR3 source ID, the values of AV, |

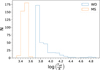 |
Fig. 4 Distribution of Teff for the WDs (blue) and MS (orange) stars in our candidate WDMS binaries. The median, 25th, and 75th percentiles for the MS s (WD) is |


3 Results and discussion
We could fit the observed SEDs using composite model spectra of WDMS binaries for 347 sources and are marked with orange plus signs in Figure 1. WDMS binary fits using the VOSA tool provide us with best-fit stellar parameters for both companions. In particular, Teff and radius estimates from SEDs are robust (Bayo et al. 2008). All stellar properties of each source are summarized in Table A.1. We show the distributions of Teff and radii for the MS stars (orange) and the WDs (blue) in Figure 4 and Figure 5. We find that in our sample, the MS (WD) stars have  . The corresponding numbers for the radii of the MS (WD) stars are
  6. We find that most of the MS components in our catalog of WDMS binaries are M spectral types based on the Teff versus spectral type relation (Pecaut & Mamajek 2013).
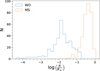 |
Fig. 5 Same as Figure 4, but showing the stellar radii for WDs (blue) and MS stars (orange). The median, 25th, and 75th percentiles for the MS stars (WDs) is |

3.1 WD mass
The SED fitting process is found to be less sensitive to log g7, however, mass estimation is dependent on log g. Therefore, a small change in the log g value can introduce a significant variation in mass estimations. Therefore, instead of directly using the log g values obtained from VOSA, we considered the WD evolutionary models created by Bédard et al. (2020) to calculate the masses of WDs. We assume that the WDs in our sample have CO cores with Hydrogen atmospheres. We used Teff and bolometric luminosity (LWD) of the WDs obtained from our SED fittings as inputs to the WD evolutionary models to estimate their masses and cooling ages.
In Figure 6, we show LWD as a function of Teff for the WDs in our sample with black dots. WD cooling tracks from models (Bédard et al. 2020) are overlaid. The cooling tracks are color-coded with WD mass. In general, for the same cooling age, lower-mass WDs would have lower Teff. On the other hand, over time, the WDs would cool along the sequences shown in the figure for any particular mass. We estimated the masses of the WDs from the model cooling tracks using linear interpolation.
We identify 121 candidate WDs in our sample with luminosities (LWD) exceeding the model evolutionary tracks. These WDs are likely to have lower masses than the 0.2 M⊙ limit in CO-core WD models by Bédard et al. (2020). Additionally, we find 56 candidate WDs with LWD below the model evolutionary tracks. Consequently, we were unable to estimate the masses of these WD candidates, as we chose not to extrapolate beyond the model limits.
We could estimate masses for 170 WDs and they are distributed in the range ~0.2-1.3 M⊙ (Figure 6). The individual masses of these candidate WDs are listed in Table A.1. Out of 170 candidates, we identify 16 (−9%) ELM-WDs with masses ≤0.3 M⊙. Detecting ELM-WDs is extremely challenging due to their low luminosity and low-mass companions. RM21 reported 35 (~31%) ELM-WDs and N24 reported 5 (~8%) ELM-WDs with MS companions in 100 pc volume. The fraction of ELM-WDs identified in this work (~9%) is consistent with the value reported by N24 (−8%), but significantly lower than the −31% reported by RM21. This discrepancy likely arises from differences in sample selection. RM21 focused exclusively on sources located in the gap region between the WD and MS in the optical CMD. In contrast, both this study and N24 include sources predominantly located on the MS with a small fraction residing in the gap region. Hence, differences in sensitivity to cooler WDs might have contributed to the variation in reported fractions.
Of the 16 ELM-WDs, only one (759601941671398272) was previously classified as DC+M4.5Ve WDMS binary based on SIMBAD. Nine out of 16 ELM-WDs have been previously identified by Jackim et al. (2024); Li et al. (2025), while seven ELM-WDMS binaries are newly identified in this study. We also find a single epoch spectroscopic observation of one source (2246676707976104960) in the SDSS-V survey. The spectrum shows H-Balmer emission lines with no prominent excess flux in the bluer part of the spectrum. Previous spectroscopic surveys, such as the SDSS magnitude-limited sample (Rebassa-Mansergas et al. 2010, 2012a, 2013b) cataloged only a few ELM-WDs with MS stars as their companion. A recent study by Jackim et al. (2024) cataloged more than 900 potential ELM-WDs within binary systems. Although many ELM-WD candidates have recently been detected (Jadhav et al. 2019, 2023; Subramaniam et al. 2020; Khurana et al. 2023; Sidharth et al. 2024), their formation channels remain poorly understood. Further spectroscopic follow-up and population studies are necessary to better understand their formation processes.
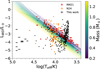 |
Fig. 6 Teff versus LWD. Model cooling sequences for CO WDs with a Hydrogen atmosphere are shown where the color code denotes WD mass Bédard et al. (2020). The black, orange and red points are the WDs identified in this work, N24 and in RM21, respectively. |
3.2 Contamination from active M dwarf stars
As shown in Figure 6, the WDs in several WDMS candidates lie outside the WD cooling sequence and their MS companions mostly belong to the M dwarf populations. Since M dwarf stars are known to have chromospheric activities that cause the presence of excess emission mainly in the UV regions (Martínez-Arnáiz et al. 2010; Boro Saikia et al. 2018; Gomes da Silva et al. 2021). The reconfiguration of strong magnetic fields in the outer atmosphere of these low-mass M dwarf stars can also lead to the release of large amounts of energy in X-rays and UV in the form of eruptions or flares (Vallée 2003; Samus’ et al. 2017). If the GALEX observations were obtained during the flaring event, we get the wrong estimations of the sources’ magnitudes. Therefore, active M dwarf stars can mimic WDMS binary candidates in the NUV-optical CMD. There have been extensive studies dedicated to understanding the phenomenon of stellar flares and chromospheric activities using X-ray, UV and optical observations (Martínez-Arnáiz et al. 2010; Boro Saikia et al. 2018; Gomes da Silva et al. 2021; Newton et al. 2017; Brasseur et al. 2019; Rekhi et al. 2023; Li et al. 2024). We compared our catalog with literature studies to find if we misclassified any active M dwarf as WDMS binary.
Boro Saikia et al. (2018) studied the chromospheric activity of 4454 cool stars, combining archival HARPS spectra and multiple other surveys. However, there are no crossmatch with our catalog. We did not find any match with the catalog by Gomes da Silva et al. (2021), where the authors studied the chromospheric activity of 1674 FGK stars using the HARPS archival data. We also did not find any match with Martínez-Arnáiz et al. (2010), which presented spectroscopic analysis of chromospheric activity for nearby (d<25pc) cool (spectral types F to K) stars. Newton et al. (2017) presented an optical spectroscopic study of 2202 low mass (between 0.1 and 0.6 M⊙) stars in the solar neighborhood to study their stellar flares activity and only one source is in common with our catalog. We found no match with Brasseur et al. (2019), where the authors detected short duration (<5 minutes) NUV flares of −1000 stars using GALEX data. We did not find any crossmatch with Yang et al. (2017), where the authors studied the flaring activity of 540 M dwarfs in the Kepler field. Medina et al. (2020) presented a spectroscopic study of stellar flares in 125 low mass stars (between 0.1 and 0.3 M⊙) within 15 pc volume, we did not find any common sources with our catalog. We find one match with Li et al. (2024) and no match with Rekhi et al. (2023) where the authors studied the flares and chromospheric activity of M dwarfs using GALEX data. Therefore, we find two sources in our catalog that are previously cataloged as active MS stars.
Active MS stars are also expected to have X-ray counterparts. We checked for their X-ray counterparts in various catalogs and found seven matches in Chandra (Evans et al. 2010), 13 matches in XMM-Newton (Saxton et al. 2008; Webb et al. 2020), and 12 matches in ROSAT all-sky survey data (Boller et al. 2016). In total, we get X-ray counterparts for 27 sources in our catalog. In Figure 7, we overlaid the active MS stars located within 100 pc from the catalogs by Boro Saikia et al. (2018); Newton et al. (2017); Gomes da Silva et al. (2021) and those 27 WDMS candidates with X-ray counterparts on NUV-optical CMD to investigate their location in the CMD and assess the potential contamination of these stars in our catalog. We also highlighted the WDMS candidates where we could not estimate the masses of WDs (blue open boxes). The figure shows that a large fraction of WDs with no mass estimations are located in the 5.5 ⪅ (NUV - BP) ⪅ 8 color range, close to the MS branch. Majority of WDMS candidates with X-ray counterparts are also located in this color range. While active MS stars are mainly located on the MS branch in NUV-optical CMDs as well with a few in the above color range. If we impose a cut-off on (NUV-optical) color and consider only the sources hotter than (NUV-BP)abs = 5.5, the number of binary candidates with well-fitted SEDs decreases to −54% than the original catalog (187 sources). The fraction of WDs without mass estimates decreases to −40% (74 out of 187), compared to −51% (177 out of 347) in the full sample. Similarly, the fraction of sources with X-ray counterparts decreases to −6% (11 out of 187) relative to −8% (27 out of 347) in the original catalog. We find that adopting a stricter (NUV-optical) color cut does not lead to a statistically significant reduction in contamination. Therefore, we conclude that a small fraction of WDMS candidates in our catalog might be contaminated by active MS stars.
Spectroscopic observations are required to better distinguish WDMS binaries from the active MS stars. We crossmatched these 27 X-ray detected sources with LAMOST DR11 catalog and found 12 in common. Gaia DR3 2560009007603950720 is categorized as DC+M WDMS binaries in the catalog. Ten out of the rest 11 sources exhibit strong H-Balmer emission lines (Hβ, Hγ, Hδ, Hε). Five of them appears to have variation in the emission strength in multi-epoch observations, suggesting that the emissions could be coming from close or interacting binaries. However, these emissions can also come from the active M dwarf due to flaring activity. A more dedicated spectroscopic study to quantify the strength, presence UV excess and period of variability is necessary. Followup deep FUV photometric observations will also be beneficial in separating these two populations (Anguiano et al. 2022). However, it is important to note that the presence of stellar activity in an M dwarf does not directly rule out the possibility of having a WDMS binary, as post-common envelop systems with active M-stars are reported in the literature (Muirhead et al. 2013).
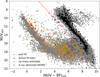 |
Fig. 7 Comparison of the location of WDMS binary candidates with active MS stars and X-ray-detected WDMS candidates in the NUV-optical CMD. |
3.3 Comparison with previous WDMS catalogs
The recent WDMS catalogs focused on a volume-limited sample of 100 pc within the solar neighborhood are provided by RM21 and N24. RM25 recently extended the study of RM21 to a few kpc to generate a magnitude-limited catalog of 1312 WDMS binaries having Gaia XP spectra and provided stellar parameters for 435. Out of 1312 sources, 90 are within 100 pc with stellar parameters provided for 19 sources. These studies also performed binary SED analyses to derive stellar parameters. While N24 focused on sources with both FUV and NUV observations, RM21 and RM25 also included sources with only NUV or without UV data. A comparison between our results and those from these works provides an additional check on the reliability of our estimates and methodology. We find 18 crossmatch with N24, 29 with RM21, and 31 (but parameters estimated for 16) with RM25. In Figure 8, we compared WD temperature (top panel), MS temperature (middle panel) and WD mass (bottom panel) of these common sources. The solid lines in all the panels correspond to 1:1 relation, while the dashed lines represent deviation boundaries to our estimates: ±0.05 in log scale for WD temperature, ±0.015 in log scale for MS temperature, and ±0.1 M⊙ for WD mass. We found that both WD and MS temperature estimations are in good agreement with literature estimates within the deviation boundaries. When we inspect SEDs of the sources having relatively larger deviation with RM21 in lower temperature regime, we noticed that observed SEDs are badly fitted in RM21 and do not satisfy the goodness criteria defined by us as well as by N248. Our SED fittings provided better results than RM21 for these sources, that could be due to the recent upgrade to fitting method in the VOSA tool, namely, detection of outliers among the photometric data before the SED fitting and improved calculation of the total flux in the chi-square fitting (details can be found on the VOSA website).
In the higher temperature regime, we have one source common with N24 that shows a significant deviation, with our analysis overestimating the WD temperature. This discrepancy highlights the importance of FUV observations for accurately constraining very hot WDs (Teff ≳ 20000 K; log T ≳ 4.3), whose SEDs peak at shorter wavelengths than NUV band. As mentioned earlier in the section 2.3, our selection method is intrinsically biased toward detecting the WDMS binaries with cooler WDs, due to relying solely on NUV band in the UV regime, which is primarily sensitive to temperatures of ~10 00016 000 K. As a result, we noticed that temperature estimates for hotter WDs are less well constrained and tend to be systematically overestimated. We identified 16 WDMS binary candidates in this regime whose WD parameters should be treated with caution and would benefit from follow-up FUV observations, which are sensitive to hotter WD temperatures (≲40000 K). As the deviation in the estimation of WD temperature also reflected in the estimation of WD mass, producing systematically higher masses with an average offset of ~0.1 M⊙, while temperatures of MS companions remain comparatively less affected. We infer that follow-up observations with upcoming UV missions like INdian Spectroscopic and Imaging Space Telescope (INSIST; Subramaniam 2022; Sriram et al. 2023), the Ultraviolet Explorer (UVEX; Kulkarni et al. 2021), and The Cosmological Advanced Survey Telescope for Optical and UV Research (CASTOR; Cote et al. 2019), which offer coverage in both FUV and NUV, will significantly improve in constraining the WD parameters. In addition, their deeper photometric limits (2-4 magnitudes beyond GALEX), in particular the UVEX in wide-field survey mode, will help us in detecting even fainter WDMS systems and improve sample completeness in the solar neighborhood.
In Figure 9, we compare the distribution of our estimated mass, radius, and Teff of the WDs with those found in RM21 (orange) and N24 (black). The figure shows that peak in Teff distribution in our study is found to be cooler than N24 while peak in the radii distribution is found to be similar to RM21 and N24. The figure also shows that our detected WDs have similar mass distribution to that found in N24 but more massive than those detected in RM21.
Recently, Jackim et al. (2024) provided the most extensive catalog of single and binary WD using Gaia and GALEX data, where the authors selected the WD from UV and NUV-optical CMDs and search for their companions in the non-WD regions on optical CMD. We find 154 common sources with their catalog, nine of them were reported as single WD. However, out of these nine, two sources Gaia DR3 2560009007603950720 and Gaia DR3830644063706298496 are categorized as DC+M and DA+M WDMS binaries, respectively, while Gaia DR3 704748371716051072 shows signature of WDMS binaries in one of the two epoch of observations in the LAMOST DR11 optical spectroscopic catalog (see Section 3.4). The SED corresponds to Gaia DR3 ID 2560009007603950720 is also shown in the right panel of Figure 2, which clearly shows the presence NIR excess and highlights the significance of multiwavelength studies in detecting and characterizing WDMS binaries. WD Teff for the common sources are found to be a good match following a 1:1 relation except for a few candidates, while WDs in our catalog appear relatively more massive than that estimated by Jackim et al. (2024). We notice that the use of higher extinction values and not inclusion of the NIR data points could be the reasons for the deviation in the estimated parameters and for defining the two binaries as single WDs. Since sources in this work are located within 100 pc, extinction is expected to be negligible as found in the MWDUST 3D extinction map solution. However, Jackim et al. (2024) used a 2D extinction map from Schlegel et al. (1998), which provides significantly larger extinctions for these solar neighborhood sources. As the UV region is more sensitive to extinction, the use of higher extinction values will make the intrinsic luminosity of the WD brighter and less massive on the WD cooling sequence track (see Fig. 6).
We did not find any match with the large surveys on WDMS binaries by Ren et al. (White Dwarf Binary Pathways Survey; 2020). Their sample primarily focuses on the selection of WDMS binaries with early type MS companions (i.e., AFGK type, with Teff > 4000 K), whereas the selection method adopted in this work prefers to identify WDMS binaries with later type companions (i.e., M dwarfs).
We find that nine WDMS candidates in our catalog match with the catalog of WDMS binaries detected using LAMOST (Ren et al. 2018) and ten matches with Anguiano et al. (2022). There are four WDMS binaries from our catalog that were previously identified by the SDSS spectroscopic catalog of WDMS binaries (Rebassa-Mansergas et al. 2010) and nine were previously cataloged in SDSS photometric catalog of WDMS binaries (Rebassa-Mansergas et al. 2013a). We find three matches with the catalog provided by Pérez-Couto et al. (2025), where the authors applied an unsupervised machine learning algorithm to Gaia XP spectra and identified 993 WDMS binary candidates. Li et al. (2025) recently studied approximately 30 000 WDMS binary candidates using Gaia XP spectra and 1700 of them are high-confidence systems confirmed through spectral fitting. We find 20 sources common with their catalog. We also crossmatched our catalog with that of single WD catalog based on Gaia-EDR3 by Gentile Fusillo et al. (2021) but did not find any match. Comparison with Gaia DR3 non-single star (NSS) catalog (Gaia Collaboration 2023) provides two match with our catalog. The match with the NSS catalog also highlights the importance of multiwavelength study from UV to IR to constrain the binary properties for sources in the NSS catalog (Ganguly et al. 2023). The overlap between our catalog and previously identified candidates confirm the validity of these candidates and supports the effectiveness of our method for identifying new WDMS candidates. In this study, we have identified and cataloged 347 WDMS binaries and 188 of them are newly detected and have not been classified as WDMS binaries or chromospherically active M stars in the literature.
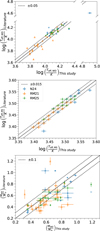 |
Fig. 8 Comparison of WD temperature, MS temperature, and WD mass with the literature estimations. The solid lines in all the panels represent 1:1 relation, while the dashed lines are deviation boundaries to our estimates. |
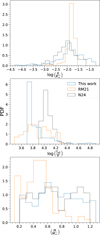 |
Fig. 9 Comparison of properties for WDs identified in this work (blue), RM21 (orange), and N24 (black). From top to bottom, we show distributions of radius, Teff, and mass, respectively. |
3.4 Comparison with spectroscopic surveys and SIMBAD
Gaia DR3 also provided low resolution BP/RP (XP) spectra of more than 200 million stars. We find that 208 sources have Gaia XP spectra, out of 347. In these spectra, we expect to see excess emission toward bluer part of the spectrum and/or presence of H-Balmer absorption lines (Hβ, Hγ, Hδ, Hε) (Rebassa-Mansergas et al. 2016b). Following the classification scheme introduced by RM25 (see their Fig. 2), we identified 23 sources showing the signatures of WDMS binary, as shown in the top panel of Figure 10. In the spectrum, H-Balmer absorption lines are also marked. A complete crossmatch catalog of these 208 sources along with their Gaia XP spectra are available on Zenodo.
We further compared our catalog with available spectroscopic surveys to find out the signatures of WDs. We have found 93 match with the optical spectroscopic survey LAMOST DR119. 16 of them show prominent detection of H-Balmer absorption lines and/or excess emission in the bluer part of the spectra, suggesting them to be confirmed WDMS binaries. An example spectrum is shown in the middle panel of Figure 10. Out of 16, five are classified as DA+M WDMS binaries (Gaia IDs: 3992861740235753216, 4437836226304032384, 704748371716051072, 830644063706298496, 881086019353249280) and one as DC+M WDMS binary (2560009007603950720) in the LAMOST catalog . Gaia DR3 704748371716051072 shows signatures of WDMS binary in one of the two epoch of observations, indicating eclipsing nature of this source. Two sources are classified as double stars (Gaia IDs: 1006621281985546240, 1911816151065187456). Spectral classification of majority of the LAMOST detected sources are M type, which matches with our finding using SED analyses. Gaia DR3 IDs, Teff for WD and MS from SED analyses, along with the combined Teff values and spectral type classification from LAMOST catalog are listed in Table B.1. A complete crossmatch catalog of 93 sources along with LAMOST spectra are available on Zenodo.
We find 22 match with optical spectroscopy survey SDSS DR1910. Nine of them show prominent H-Balmer absorption lines and presence of excess flux in the bluer part of the spectrum, suggesting them to be confirmed WDMS binaries. An example spectra of Gaia DR3 947545965334561280 is presented in the bottom panel of Figure 10. A dedicated spectroscopic study using all the available spectroscopic survey is necessary to examine the presence of small UV excess, estimation of temperature and log g parameters. A complete crossmatch catalog of 22 sources along with SDSS spectra are available on Zenodo.
We also matched our catalog with SIMBAD and found 274 common sources. Out of 274, 21 sources are classified as WDMS binaries, seven are WDs and 62 are single MS stars of M spectral type. Out of 21 WDMS binaries, two are classified as spectroscopic binaries and one of them is cataclysmic variable (CV). MS companions of 19 are M spectral type, one is K spectral type and for one binary it is not defined. The spectral types of MS stars are in good match with the estimates from our method. Gaia DR3 IDs, Teff for WD and MS from SED analyses, and source IDs and spectral type classification from SIMBAD catalog are listed in Table B.2. Out of seven common sources classified as WD in SIMBAD, one (2843374388402149632) is mentioned as CV, one (6461421956281723392) shows prominent binary signature in the Gaia XP spectra. A complete crossmatch catalog of 274 sources are available on Zenodo.
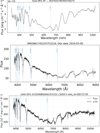 |
Fig. 10 Top panel: low-resolution Gaia XP spectrum of Gaia DR3 3547632785950758272. Middle panel: LAMOST spectrum of Gaia source id 3992861740235753216. This source is defined as DAZ+M WDMS binary in the LAMOST catalog. Lower panel: SDSS spectrum of Gaia DR3 947545965334561280. In all the panels, error in flux are represented as gray shaded region and H-Balmer lines are marked in blue. All the three spectra show the presence of strong H-Balmer emission lines and excess emission toward the bluer part of the spectrum, representing the signatures of a WD in binary with a MS star. |
3.5 Completeness of the catalog
Through simulation RM21 showed that −91% of total WDMS populations are hidden in the MS region of optical CMD. We cataloged and parameterized 347 WDMS binaries in this study, that are located either on the MS or gap region in optical Gaia CMD. Considering all the 6559 UV bright sources are probable binary candidates, we are able to retrieve 5.3% through multiwavelength SED analyses. However, GALEX survey covers only a fraction of the sky, mainly avoiding ± 10 degrees around the Galactic plane compared to all sky Gaia survey. We notice that −48% of 100 pc Gaia data are located ±10 degrees above the Galactic plane. Out of them, −83% have reliable photometric or astrometric solutions as per the conditions mentioned in Section 2.1. Therefore, considering the fractional sky coverage of GALEX survey, completeness of our catalog has a lower limit of ~2%.
The preferential coverage of intermediate and high Galactic latitudes by GALEX implies that our catalog is biased toward lower-extinction environments and relatively older stellar populations. However, this spatial incompleteness is unlikely to significantly affect our primary demographic result, the prevalence of WDs with M dwarf companions. The dominance of M dwarf companions in WDMS binaries is mainly driven by the initial mass function and stellar evolutionary timescales, which favor long-lived low-mass secondary companions. Since our analysis is restricted to the 100 pc volume within the solar neighborhood, the stellar populations are well mixed and not dominated by very young populations. So, we do not expect the companion-type distribution to differ substantially within the Galactic plane. Access to both FUV and NUV observations could potentially improve the completeness for WDMS binaries, however, the UV-optical selection method intrinsically favors WD systems with late-type (e.g., M dwarf) companions due to contrast effects. Therefore, while GALEX sky coverage primarily impacts absolute completeness of the catalog, it is unlikely to significantly alter the inferred companion-type demographics within the surveyed footprint.
Our study demonstrates how GALEX NUV and Gaia data can be used to identify those hidden WDMS populations and how multiwavelength SED analyses can be used to estimate their stellar parameters. As our study used those sources that are located mostly on the MS region of the optical CMD, and are detected majorly in GALEX NUV, this study is complementary to many previous studies where both FUV and NUV data are used to identify WDMS binaries (Ren et al. 2020; Anguiano et al. 2020; Nayak et al. 2024) or only the gap region in the optical CMD is targeted (RM21; RM25). We suggest a follow-up deep FUV observation of our catalog with Ultra-Violet Imaging Telescope (UVIT) on board AstroSat (Tandon et al. 2017b,a) which will be beneficial to better constrain the stellar parameters of WDMS binaries. However, a large number of candidates yet to be explored even within 100 pc, due to unavailability of deep UV observations or high-resolution spectroscopic observations in the Galactic plane. Given that obtaining high-resolution spectroscopic observations for a large number of sources will be challenging, our study illustrates a simple pathway using multiwavelength photometric data to identify WDMS binaries. We believe that implementing our method along with those demonstrated in the literature (Ren et al. 2020; Anguiano et al. 2020; Nayak et al. 2024; Jackim et al. 2024) on the upcoming UV missions such as INdian Spectroscopic and Imaging Space Telescope (INSIST; Subramaniam 2022), the Ultraviolet Explorer (UVEX; Kulkarni et al. 2021), will significantly advance the discovery of hidden WDMS binaries and contribute to completing a volume-limited WDMS sample. Once identified, a high-resolution spectroscopic follow-up study will help to improve their parameters as well as in better understanding their formation and evolutionary processes.
4 Conclusions
We have used NUV-optical CMDs as a tool to identify unresolved WDMS binaries within 100 pc. We have used Gaia DR3 for optical data and GALEX for NUV data to construct the NUV-optical CMDs;
We have identified 347 WDMS binaries within 100 pc and 188 of them are newly reported;
We have used a binary fitting algorithm available in the VOSA toolkit to determine Teff, bolometric luminosities, and radii of both the binary components. Our method predominantly identifies binaries with cooler WDs (<10000 K) compared to previous studies (RM21; N24; RM25). The MS components are found to be M spectral types;
We found a peak in the WD radii distribution at log(R/R⊙) =~ −1.82;
To determine the mass of WDs, we used the WD evolutionary models by Bédard et al. (2020) and considered the CO core and Hydrogen atmosphere. The WD masses range from ~0.2 and 1.3 M⊙. We have also identified 16 WDMS binaries with ELM-WDs (≤0.3 M⊙), that are likely formed due to mass loss from their progenitor stars;
This study presents a simple approach to identify and parameterize a large number of WDMS binaries combining multiwavelength data. We suggest that implementing our method along with those demonstrated in the literature (Ren et al. 2018; Anguiano et al. 2022; Rebassa-Mansergas et al. 2013a; Nayak et al. 2024) on upcoming optical (Gaia DR4) and UV (INSIST and UVEX) surveys will lead to the completeness of WDMS binaries in the solar neighborhood.
Data availability
The catalogs of 347 WDMS binaries with well-fitted SEDs, 1070 candidates with badly fitted SEDs and 6559 UV-bright sources are available on Zenodo and at the CDS via https://cdsarc.cds.unistra.fr/viz-bin/cat/J/A+A/709/A114. The SED figures for both well-fitted and badly fitted SEDs are shared on Zenodo and at the CDS via https://cdsarc.cds.unistra.fr/viz-bin/cat/J/A+A/709/A114. All archival spectra retrieved for the 347 WDMS binaries from Gaia, LAMOST, and SDSS are made available on Zenodo, along with the cross-match catalogs.
Acknowledgements
PKN acknowledges support from the Centro de Astrofisica y Tecnologías Afines (CATA) fellowship via grant Agencia Nacional de Investiga-cion y Desarrollo (ANID), BASAL FB210003. We thank the anonymous referee for an insightful and constructive review that significantly improved the clarity and quality of this work.
References
- Andrews, J. J., Taggart, K., & Foley, R. 2022, arXiv e-prints [arXiv:2207.00680] [Google Scholar]
- Anguiano, B., Lewis, H. M., Corcoran, K. A., et al. 2020, RNAAS, 4, 127 [Google Scholar]
- Anguiano, B., Majewski, S. R., Stassun, K. G., et al. 2022, AJ, 164, 126 [CrossRef] [Google Scholar]
- Bailer-Jones, C. A. L., Rybizki, J., Fouesneau, M., Demleitner, M., & Andrae, R. 2021, AJ, 161, 147 [Google Scholar]
- Baraffe, I., Homeier, D., Allard, F., & Chabrier, G. 2015, A&A, 577, A42 [NASA ADS] [CrossRef] [EDP Sciences] [Google Scholar]
- Bayo, A., Rodrigo, C., Barrado Y Navascués, D., et al. 2008, A&A, 492, 277 [NASA ADS] [CrossRef] [EDP Sciences] [Google Scholar]
- Bédard, A., Bergeron, P., Brassard, P., & Fontaine, G. 2020, ApJ, 901, 93 [Google Scholar]
- Belokurov, V., Penoyre, Z., Oh, S., et al. 2020, MNRAS, 496, 1922 [Google Scholar]
- Bobrick, A., Davies, M. B., & Church, R. P. 2017, MNRAS, 467, 3556 [NASA ADS] [CrossRef] [Google Scholar]
- Boller, T., Freyberg, M. J., Trümper, J., et al. 2016, A&A, 588, A103 [NASA ADS] [CrossRef] [EDP Sciences] [Google Scholar]
- Boro Saikia, S., Marvin, C. J., Jeffers, S. V., et al. 2018, A&A, 616, A108 [NASA ADS] [CrossRef] [EDP Sciences] [Google Scholar]
- Bovy, J., Rix, H.-W., Green, G. M., Schlafly, E. F., & Finkbeiner, D. P. 2016, ApJ, 818, 130 [Google Scholar]
- Brasseur, C. E., Osten, R. A., & Fleming, S. W. 2019, ApJ, 883, 88 [CrossRef] [Google Scholar]
- Camacho, J., Torres, S., García-Berro, E., et al. 2014, A&A, 566, A86 [NASA ADS] [CrossRef] [EDP Sciences] [Google Scholar]
- Chen, L., Hou, J.-L., Yu, J.-C., et al. 2012, Res. Astron. Astrophys., 12, 805 [Google Scholar]
- Choi, J., Dotter, A., Conroy, C., et al. 2016, ApJ, 823, 102 [Google Scholar]
- Cote, P., Abraham, B., Balogh, M., et al. 2019, in Canadian Long Range Plan for Astronomy and Astrophysics White Papers, 2020, 18 [Google Scholar]
- Cui, X.-Q., Zhao, Y.-H., Chu, Y.-Q., et al. 2012, Res. Astron. Astrophys., 12, 1197 [Google Scholar]
- Dotter, A. 2016, ApJS, 222, 8 [Google Scholar]
- Drimmel, R., Cabrera-Lavers, A., &López-Corredoira, M. 2003, A&A, 409, 205 [NASA ADS] [CrossRef] [EDP Sciences] [Google Scholar]
- Eisenstein, D. J., Weinberg, D. H., Agol, E., et al. 2011, AJ, 142, 72 [Google Scholar]
- Evans, I. N., Primini, F. A., Glotfelty, K. J., et al. 2010, ApJS, 189, 37 [NASA ADS] [CrossRef] [Google Scholar]
- Evans, D. W., Riello, M., De Angeli, F., et al. 2018, A&A, 616, A4 [NASA ADS] [CrossRef] [EDP Sciences] [Google Scholar]
- Farihi, J., Hoard, D. W., & Wachter, S. 2010, ApJS, 190, 275 [NASA ADS] [CrossRef] [Google Scholar]
- Ferrario, L. 2012, MNRAS, 426, 2500 [NASA ADS] [CrossRef] [Google Scholar]
- Gaia Collaboration (Arenou, F., et al.) 2023, A&A, 674, A34 [CrossRef] [EDP Sciences] [Google Scholar]
- Ganguly, A., Nayak, P. K., & Chatterjee, S. 2023, ApJ, 954, 4 [Google Scholar]
- García-Berro, E., Ritossa, C., & Iben, Icko, J. 1997, ApJ, 485, 765 [CrossRef] [Google Scholar]
- Gentile Fusillo, N. P., Tremblay, P. E., Cukanovaite, E., et al. 2021, MNRAS, 508, 3877 [NASA ADS] [CrossRef] [Google Scholar]
- Gomes da Silva, J., Santos, N. C., Adibekyan, V., et al. 2021, A&A, 646, A77 [NASA ADS] [CrossRef] [EDP Sciences] [Google Scholar]
- Green, G. M., Schlafly, E., Zucker, C., Speagle, J. S., & Finkbeiner, D. 2019, ApJ, 887, 93 [NASA ADS] [CrossRef] [Google Scholar]
- Henden, A. A., Levine, S., Terrell, D., & Welch, D. L. 2015, in American Astronomical Society Meeting Abstracts, 225, 336.16 [Google Scholar]
- Iben, Icko, J. 1991, ApJS, 76, 55 [Google Scholar]
- Istrate, A. G., Tauris, T. M., & Langer, N. 2014a, A&A, 571, A45 [NASA ADS] [CrossRef] [EDP Sciences] [Google Scholar]
- Istrate, A. G., Tauris, T. M., Langer, N., & Antoniadis, J. 2014b, A&A, 571, L3 [NASA ADS] [CrossRef] [EDP Sciences] [Google Scholar]
- Jackim, R., Heyl, J., & Richer, H. 2024, arXiv e-prints [arXiv:2404.07388] [Google Scholar]
- Jadhav, V. V., Sindhu, N., & Subramaniam, A. 2019, ApJ, 886, 13 [NASA ADS] [CrossRef] [Google Scholar]
- Jadhav, V. V., Subramaniam, A., & Sagar, R. 2023, A&A, 676, A47 [NASA ADS] [CrossRef] [EDP Sciences] [Google Scholar]
- Khurana, A., Chawla, C., & Chatterjee, S. 2023, ApJ, 949, 102 [NASA ADS] [CrossRef] [Google Scholar]
- Koester, D. 2010, Mem. Soc. Astron. Italiana, 81, 921 [NASA ADS] [Google Scholar]
- Kordopatis, G., Gilmore, G., Steinmetz, M., et al. 2013, AJ, 146, 134 [Google Scholar]
- Kulkarni, S. R., Harrison, F. A., Grefenstette, B. W., et al. 2021, arXiv e-prints [arXiv:2111.15608] [Google Scholar]
- Kunder, A., Kordopatis, G., Steinmetz, M., et al. 2017, AJ, 153, 75 [Google Scholar]
- Li, X., Wang, S., Han, H., et al. 2024, ApJ, 966, 69 [Google Scholar]
- Li, J., Ting, Y.-S., Rix, H.-W., et al. 2025, ApJS, 279, 47 [Google Scholar]
- Magnier, E. A., Schlafly, E. F., Finkbeiner, D. P., et al. 2020, ApJS, 251, 6 [NASA ADS] [CrossRef] [Google Scholar]
- Marshall, D. J., Robin, A. C., Reylé, C., Schultheis, M., & Picaud, S. 2006, A&A, 453, 635 [NASA ADS] [CrossRef] [EDP Sciences] [Google Scholar]
- Martin, D. C., Fanson, J., Schiminovich, D., et al. 2005, ApJ, 619, L1 [Google Scholar]
- Martínez-Arnáiz, R., Maldonado, J., Montes, D., Eiroa, C., & Montesinos, B. 2010, A&A, 520, A79 [NASA ADS] [CrossRef] [EDP Sciences] [Google Scholar]
- Medina, A. A., Winters, J. G., Irwin, J. M., & Charbonneau, D. 2020, ApJ, 905, 107 [Google Scholar]
- Michalik, D., Lindegren, L., & Hobbs, D. 2015, A&A, 574, A115 [NASA ADS] [CrossRef] [EDP Sciences] [Google Scholar]
- Morgan, D. P., West, A. A., Garcés, A., et al. 2012, AJ, 144, 93 [CrossRef] [Google Scholar]
- Muirhead, P. S., Vanderburg, A., Shporer, A., et al. 2013, ApJ, 767, 111 [Google Scholar]
- Nandez, J. L. A., Ivanova, N., & Lombardi, J. C. J. 2015, MNRAS, 450, L39 [Google Scholar]
- Nayak, P. K., Ganguly, A., & Chatterjee, S. 2024, MNRAS, 527, 6100 [Google Scholar]
- Newton, E. R., Irwin, J., Charbonneau, D., et al. 2017, ApJ, 834, 85 [Google Scholar]
- Parsons, S. G., Rebassa-Mansergas, A., Schreiber, M. R., et al. 2016, MNRAS, 463, 2125 [Google Scholar]
- Parsons, S. G., Gänsicke, B. T., Marsh, T. R., et al. 2017, MNRAS, 470, 4473 [Google Scholar]
- Pecaut, M. J., & Mamajek, E. E. 2013, ApJS, 208, 9 [Google Scholar]
- Pérez-Couto, X., Manteiga, M., & Villaver, E. 2025, ApJ, 988, 51 [Google Scholar]
- Rebassa-Mansergas, A., Gänsicke, B. T., Schreiber, M. R., Koester, D., & Rodríguez-Gil, P. 2010, MNRAS, 402, 620 [Google Scholar]
- Rebassa-Mansergas, A., Nebot Gómez-Morán, A., Schreiber, M. R., et al. 2012a, MNRAS, 419, 806 [NASA ADS] [CrossRef] [Google Scholar]
- Rebassa-Mansergas, A., Zorotovic, M., Schreiber, M. R., et al. 2012b, MNRAS, 423, 320 [NASA ADS] [CrossRef] [Google Scholar]
- Rebassa-Mansergas, A., Agurto-Gangas, C., Schreiber, M. R., Gänsicke, B. T., & Koester, D. 2013a, MNRAS, 433, 3398 [Google Scholar]
- Rebassa-Mansergas, A., Schreiber, M. R., & Gänsicke, B. T. 2013b, MNRAS, 429, 3570 [NASA ADS] [CrossRef] [Google Scholar]
- Rebassa-Mansergas, A., Anguiano, B., García-Berro, E., et al. 2016a, MNRAS, 463, 1137 [NASA ADS] [CrossRef] [Google Scholar]
- Rebassa-Mansergas, A., Ren, J. J., Parsons, S. G., et al. 2016b, MNRAS, 458, 3808 [NASA ADS] [CrossRef] [Google Scholar]
- Rebassa-Mansergas, A., Ren, J. J., Irawati, P., et al. 2017, MNRAS, 472, 4193 [NASA ADS] [CrossRef] [Google Scholar]
- Rebassa-Mansergas, A., Solano, E., Jiménez-Esteban, F. M., et al. 2021, MNRAS, 506, 5201 [NASA ADS] [CrossRef] [Google Scholar]
- Rebassa-Mansergas, A., Solano, E., Brown, A. J., et al. 2025, A&A, 699, A153 [NASA ADS] [CrossRef] [EDP Sciences] [Google Scholar]
- Rekhi, P., Ben-Ami, S., Perdelwitz, V., & Shvartzvald, Y. 2023, ApJ, 955, 24 [Google Scholar]
- Ren, J. J., Rebassa-Mansergas, A., Parsons, S. G., et al. 2018, MNRAS, 477, 4641 [NASA ADS] [CrossRef] [Google Scholar]
- Ren, J. J., Raddi, R., Rebassa-Mansergas, A., et al. 2020, ApJ, 905, 38 [NASA ADS] [CrossRef] [Google Scholar]
- Samus’, N. N., Kazarovets, E. V., Durlevich, O. V., Kireeva, N. N., & Pastukhova, E. N. 2017, Astron. Rep., 61, 80 [Google Scholar]
- Saxton, R. D., Read, A. M., Esquej, P., et al. 2008, A&A, 480, 611 [NASA ADS] [CrossRef] [EDP Sciences] [Google Scholar]
- Schlegel, D. J., Finkbeiner, D. P., & Davis, M. 1998, ApJ, 500, 525 [Google Scholar]
- Shahaf, S., Bashi, D., Mazeh, T, et al. 2023, MNRAS, 518, 2991 [Google Scholar]
- Sidharth, A. V., Shridharan, B., Mathew, B., et al. 2024, A&A, 690, A68 [NASA ADS] [CrossRef] [EDP Sciences] [Google Scholar]
- Skinner, J. N., Morgan, D. P., West, A. A., Lépine, S., & Thorstensen, J. R. 2017, AJ, 154, 118 [NASA ADS] [CrossRef] [Google Scholar]
- Skrutskie, M. F., Cutri, R. M., Stiening, R., et al. 2006, AJ, 131, 1163 [NASA ADS] [CrossRef] [Google Scholar]
- Sriram, S., Valsan, V., Subramaniam, A., et al. 2023, J. Astrophys. Astron., 44, 55 [Google Scholar]
- Subramaniam, A. 2022, J. Astrophys. Astron., 43, 80 [Google Scholar]
- Subramaniam, A., Pandey, S., Jadhav, V. V., & Sahu, S. 2020, J. Astrophys. Astron., 41, 45 [NASA ADS] [CrossRef] [Google Scholar]
- Tandon, S. N., Hutchings, J. B., Ghosh, S. K., et al. 2017a, J. Astrophys. Astron., 38, 28 [Google Scholar]
- Tandon, S. N., Subramaniam, A., Girish, V., et al. 2017b, AJ, 154, 128 [NASA ADS] [CrossRef] [Google Scholar]
- Toonen, S., Hollands, M., Gänsicke, B. T., & Boekholt, T. 2017, A&A, 602, A16 [NASA ADS] [CrossRef] [EDP Sciences] [Google Scholar]
- Torres, S., Canals, P., Jiménez-Esteban, F. M., Rebassa-Mansergas, A., & Solano, E. 2022, MNRAS, 511, 5462 [NASA ADS] [CrossRef] [Google Scholar]
- Vallée, J. P. 2003, New A Rev., 47, 85 [Google Scholar]
- Wang, B., & Han, Z. 2012, New A Rev., 56, 122 [CrossRef] [Google Scholar]
- Webb, N. A., Coriat, M., Traulsen, I., et al. 2020, A&A, 641, A136 [NASA ADS] [CrossRef] [EDP Sciences] [Google Scholar]
- Wright, E. L., Eisenhardt, P. R. M., Mainzer, A. K., et al. 2010, AJ, 140, 1868 [Google Scholar]
- Yang, H., Liu, J., Gao, Q., et al. 2017, ApJ, 849, 36 [NASA ADS] [CrossRef] [Google Scholar]
- York, D. G., Adelman, J., Anderson, John E. J., et al. 2000, AJ, 120, 1579 [NASA ADS] [CrossRef] [Google Scholar]
- Zorotovic, M., Schreiber, M. R., Gänsicke, B. T., & Nebot Gómez-Morán, A. 2010, A&A, 520, A86 [NASA ADS] [CrossRef] [EDP Sciences] [Google Scholar]
- Zorotovic, M., Schreiber, M. R., García-Berro, E., et al. 2014, A&A, 568, A68 [NASA ADS] [CrossRef] [EDP Sciences] [Google Scholar]
Cut-offs in the renormalized unit weight error (RUWE) and astrometric excess noise (AEN) are often used in the literature for source selection. We intentionally avoided using these parameters since it has been shown that binarity may lead to high values of RUWE and AEN (Belokurov et al. 2020).
VOSA output provides best-fitted model fluxes for both WD and MS model spectra. It also provides best-fitted combined flux from WD and MS model spectra. In this case, we used Fλ,model as MS model (BT-Settl-CIFIST) spectra for respective bands, NUV and the next bluer optical band to NUV. Using this criterion, we identified 1417 sources that exhibit significant flux excess relative to the single-star MS model. These sources likely contain an additional hot component, consistent with a WD and therefore cannot be explained by a single main-sequence star spectrum alone. In this way, we got at least two data points included the WD model spectra fitting.
The numbers in all cases denote the median. The lower and upper errors denote the 25th and 75th percentiles, respectively.
Check the Section 5.1 in VOSA help page https://svo2.cab.inta-csic.es/theory/vosa/helpw4.php?otype=star&what=intro#
Check out the SEDs of these Gaia DR3 IDs (2155188926705745536, 2630815357409558400, 3668430081179262208, 4384149753578863744, 6182278665776280320, in http://svocats.cab.inta-csic.es/wdw4/index.php?action=search
Appendix A A representative table of online WDMS catalog
The catalog of WDMS binaries and their stellar properties.
A comparison of estimated stellar parameters of WDMS binaries with LAMOST catalog.
A comparison of estimated stellar parameters of WDMS binaries with SIMBAD.
All Tables
A comparison of estimated stellar parameters of WDMS binaries with LAMOST catalog.
All Figures
|
Fig. 1 CMDs for sources within 100 pc in the absolute plane after correcting for distance modulus and extinction, where the subscript “abs” stands for absolute magnitude. In both of the panels, isochrones of 100 Myr (cyan line) and 1 Gyr (black line) are overlaid to indicate the evolutionary sequences, and the gray asterisks indicate MS and post-MS populations. Left: UV-Optical CMD (NUV-BP versus NUV). The red line separates the hotter and NUV-bright sources (blue asterisks, green circles and orange plus) from the others (gray asterisks) on the NUV-optical CMD. Right: optical CMD (BP-RP versus G). The red line separates the blue asterisks (WD populations) from the rest of the NUV-bright sources (green circles and orange plus) that are located on the MS or with within the gap region between WD and MS. These green circles represent WDMS binary candidates. Orange plus highlights the candidates for which we could fit observed SED from UV to IR with WDMS composite model fluxes using the VOSA tool. |
| In the text | |
|
Fig. 2 Two examples of well-fitted SEDs of WDMS binaries. Index number as per Table A.1, Gaia DR3 source ID, the values of AV, |
| In the text | |
|
Fig. 3 Same as Figure 2 but for two representative examples of badly fitted SEDs of WDMS candidate binaries. Index number as per the online catalog at the CDS, Gaia DR3 source ID, the values of AV, |
| In the text | |
|
Fig. 4 Distribution of Teff for the WDs (blue) and MS (orange) stars in our candidate WDMS binaries. The median, 25th, and 75th percentiles for the MS s (WD) is |
| In the text | |
|
Fig. 5 Same as Figure 4, but showing the stellar radii for WDs (blue) and MS stars (orange). The median, 25th, and 75th percentiles for the MS stars (WDs) is |
| In the text | |
|
Fig. 6 Teff versus LWD. Model cooling sequences for CO WDs with a Hydrogen atmosphere are shown where the color code denotes WD mass Bédard et al. (2020). The black, orange and red points are the WDs identified in this work, N24 and in RM21, respectively. |
| In the text | |
|
Fig. 7 Comparison of the location of WDMS binary candidates with active MS stars and X-ray-detected WDMS candidates in the NUV-optical CMD. |
| In the text | |
|
Fig. 8 Comparison of WD temperature, MS temperature, and WD mass with the literature estimations. The solid lines in all the panels represent 1:1 relation, while the dashed lines are deviation boundaries to our estimates. |
| In the text | |
|
Fig. 9 Comparison of properties for WDs identified in this work (blue), RM21 (orange), and N24 (black). From top to bottom, we show distributions of radius, Teff, and mass, respectively. |
| In the text | |
|
Fig. 10 Top panel: low-resolution Gaia XP spectrum of Gaia DR3 3547632785950758272. Middle panel: LAMOST spectrum of Gaia source id 3992861740235753216. This source is defined as DAZ+M WDMS binary in the LAMOST catalog. Lower panel: SDSS spectrum of Gaia DR3 947545965334561280. In all the panels, error in flux are represented as gray shaded region and H-Balmer lines are marked in blue. All the three spectra show the presence of strong H-Balmer emission lines and excess emission toward the bluer part of the spectrum, representing the signatures of a WD in binary with a MS star. |
| In the text | |
Current usage metrics show cumulative count of Article Views (full-text article views including HTML views, PDF and ePub downloads, according to the available data) and Abstracts Views on Vision4Press platform.
Data correspond to usage on the plateform after 2015. The current usage metrics is available 48-96 hours after online publication and is updated daily on week days.
Initial download of the metrics may take a while.