Fig. 2
Download original image
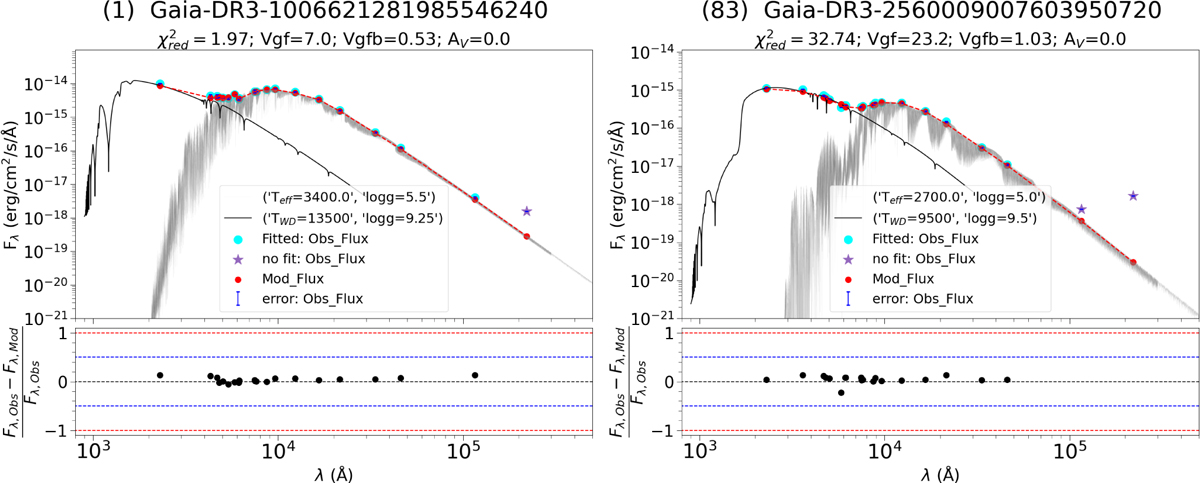
Two examples of well-fitted SEDs of WDMS binaries. Index number as per Table A.1, Gaia DR3 source ID, the values of AV, ![]() , Vgf and Vgfb are mentioned on top of each panel. Top panel: cyan points (with blue errors) denote the observed flux from UV to IR. The observed data points with upper-limit on flux or unreliable detections are marked as asterisks, and they are not included in the fit. The black (gray) line represents the best-fit synthetic spectra of WD (MS). The red points indicate the expected combined model fluxes from the best-fit synthetic spectra. Bottom panel: fractional residue fluxes are shown in different bands. The blue and red dashed lines represent 50% and 100% residue flux, while the black line represents zero residue. There is excellent agreement between the cyan and red points, and less than 50% residue fluxes in every band indicating a well-fitted SED.
, Vgf and Vgfb are mentioned on top of each panel. Top panel: cyan points (with blue errors) denote the observed flux from UV to IR. The observed data points with upper-limit on flux or unreliable detections are marked as asterisks, and they are not included in the fit. The black (gray) line represents the best-fit synthetic spectra of WD (MS). The red points indicate the expected combined model fluxes from the best-fit synthetic spectra. Bottom panel: fractional residue fluxes are shown in different bands. The blue and red dashed lines represent 50% and 100% residue flux, while the black line represents zero residue. There is excellent agreement between the cyan and red points, and less than 50% residue fluxes in every band indicating a well-fitted SED.
Current usage metrics show cumulative count of Article Views (full-text article views including HTML views, PDF and ePub downloads, according to the available data) and Abstracts Views on Vision4Press platform.
Data correspond to usage on the plateform after 2015. The current usage metrics is available 48-96 hours after online publication and is updated daily on week days.
Initial download of the metrics may take a while.