Fig. 10
Download original image
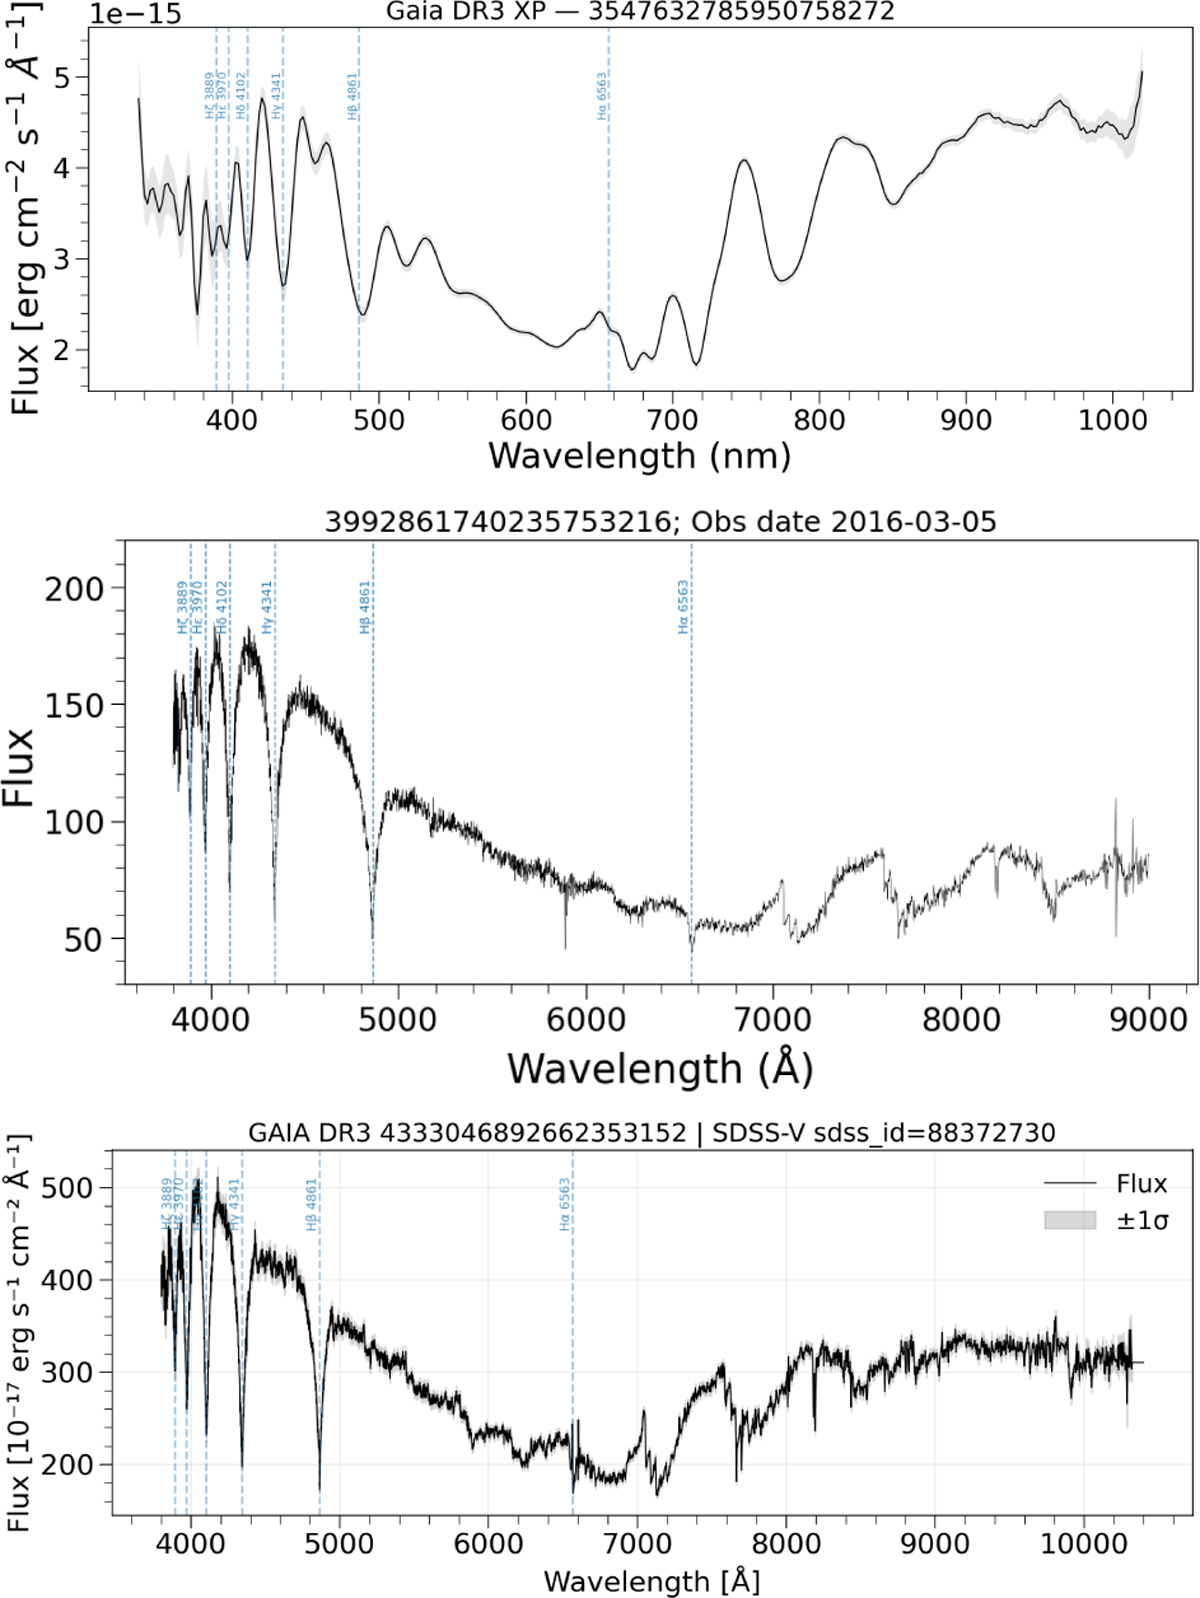
Top panel: low-resolution Gaia XP spectrum of Gaia DR3 3547632785950758272. Middle panel: LAMOST spectrum of Gaia source id 3992861740235753216. This source is defined as DAZ+M WDMS binary in the LAMOST catalog. Lower panel: SDSS spectrum of Gaia DR3 947545965334561280. In all the panels, error in flux are represented as gray shaded region and H-Balmer lines are marked in blue. All the three spectra show the presence of strong H-Balmer emission lines and excess emission toward the bluer part of the spectrum, representing the signatures of a WD in binary with a MS star.
Current usage metrics show cumulative count of Article Views (full-text article views including HTML views, PDF and ePub downloads, according to the available data) and Abstracts Views on Vision4Press platform.
Data correspond to usage on the plateform after 2015. The current usage metrics is available 48-96 hours after online publication and is updated daily on week days.
Initial download of the metrics may take a while.