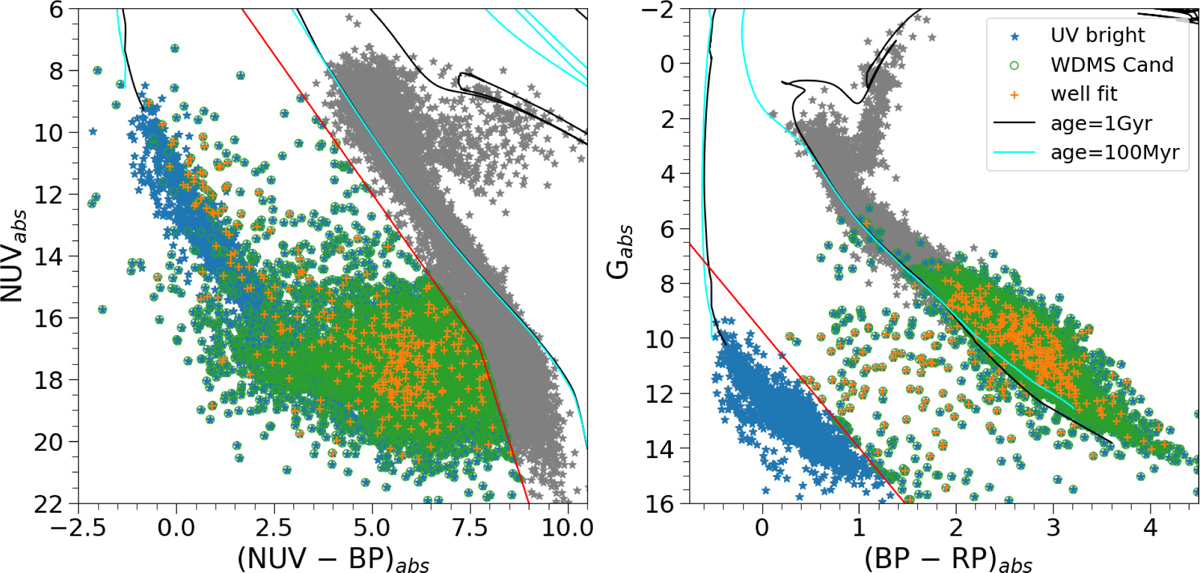
Fig. 1
Download original image
CMDs for sources within 100 pc in the absolute plane after correcting for distance modulus and extinction, where the subscript “abs” stands for absolute magnitude. In both of the panels, isochrones of 100 Myr (cyan line) and 1 Gyr (black line) are overlaid to indicate the evolutionary sequences, and the gray asterisks indicate MS and post-MS populations. Left: UV-Optical CMD (NUV-BP versus NUV). The red line separates the hotter and NUV-bright sources (blue asterisks, green circles and orange plus) from the others (gray asterisks) on the NUV-optical CMD. Right: optical CMD (BP-RP versus G). The red line separates the blue asterisks (WD populations) from the rest of the NUV-bright sources (green circles and orange plus) that are located on the MS or with within the gap region between WD and MS. These green circles represent WDMS binary candidates. Orange plus highlights the candidates for which we could fit observed SED from UV to IR with WDMS composite model fluxes using the VOSA tool.
Current usage metrics show cumulative count of Article Views (full-text article views including HTML views, PDF and ePub downloads, according to the available data) and Abstracts Views on Vision4Press platform.
Data correspond to usage on the plateform after 2015. The current usage metrics is available 48-96 hours after online publication and is updated daily on week days.
Initial download of the metrics may take a while.