| Issue |
A&A
Volume 690, October 2024
|
|
|---|---|---|
| Article Number | A17 | |
| Number of page(s) | 22 | |
| Section | Stellar structure and evolution | |
| DOI | https://doi.org/10.1051/0004-6361/202348548 | |
| Published online | 25 September 2024 | |
The story of SN 2021aatd: A peculiar 1987A-like supernova with an early-phase luminosity excess
1
Department of Experimental Physics, Institute of Physics, University of Szeged, Dóm tér 9, 6720 Szeged, Hungary
2
HUN-REN–SZTE Stellar Astrophysics Research Group, Szegedi út, Kt. 766, 6500 Baja, Hungary
3
MTA-ELTE Lendület “Momentum” Milky Way Research Group, Szent Imre H. st. 112, 9700 Szombathely, Hungary
4
HUN-REN Research Centre for Astronomy and Earth Sciences, Konkoly Observatory, Konkoly Th. M. út 15-17., 1121 Budapest, Hungary
5
CSFK, MTA Centre of Excellence, Konkoly Thege Miklós út 15-17, 1121 Budapest, Hungary
6
ELTE Eötvös Loránd University, Gothard Astrophysical Observatory, 9400 Szombathely, Hungary
7
Center for Astrophysics | Harvard & Smithsonian, 60 Garden Street, Cambridge, MA 02138-1516, USA
8
The NSF AI Institute for Artificial Intelligence and Fundamental Interactions, USA
9
The School of Physics and Astronomy, Tel Aviv University, Tel Aviv 6997801, Israel
10
CIFAR Azrieli Global Scholars Program, CIFAR, Toronto, Canada
11
Department of Astronomy, University of Washington, 3910 15th Avenue NE, Seattle, WA 98195-0002, USA
12
Las Cumbres Observatory, 6740 Cortona Drive, Suite 102, Goleta, CA 93117-5575, USA
13
Department of Physics, University of California, Santa Barbara, CA 93106-9530, USA
14
Center for Interdisciplinary Exploration and Research in Astrophysics and Department of Physics and Astronomy, Northwestern University, 1800 Sherman Ave., 8th Floor, Evanston, IL 60201, USA
15
Space Telescope Science Institute, 3700 San Martin Dr, Baltimore, MD 21218, USA
16
Baja Astronomical Observatory of University of Szeged, Szegedi út, Kt. 766, 6500 Baja, Hungary
17
SETI Institute, 339 N. Bernardo Ave., Ste. 200, Mountain View, CA 94043, USA
18
Department of Physics and Astronomy, Seoul National University, Gwanak-ro 1, Gwanak-gu, Seoul 08826, South Korea
19
ELTE Eötvös Loránd University, Institute of Physics and Astronomy, Pázmány Péter sétány 1/A, 1117 Budapest, Hungary
Received:
10
November
2023
Accepted:
1
June
2024
Abstract
Context. There is a growing number of peculiar events that cannot be assigned to any of the main classes. SN 1987A and a handful of similar objects, thought to be explosive outcomes of blue supergiant stars, is one of them: while their spectra closely resemble those of H-rich (IIP) SNe, their light curve (LC) evolution is very different.
Aims. Here we present the detailed photometric and spectroscopic analysis of SN 2021aatd, a peculiar Type II explosion. While its early-time evolution resembles that of the slowly evolving double-peaked SN 2020faa (although at a lower luminosity scale), after ∼40 days its LC shape becomes similar to that of SN 1987A-like explosions.
Methods. In addition to comparing LCs, color curves, and spectra of SN 2021aatd to those of SNe 2020faa, 1987A, and other objects, we compared the observed spectra with our own SYN++ models and with the outputs of published radiative transfer models. We also carried out a detailed modeling of the pseudo-bolometric LCs of SNe 2021aatd and 1987A with a self-developed semi-analytical code, assuming a two-component ejecta (core + shell), and involving the rotational energy of a newborn magnetar in addition to radioactive decay.
Results. We find that the photometric and the spectroscopic evolution of SN 2021aatd can be well described with the explosion of a ∼15 M⊙ blue supergiant star. Nevertheless, SN 2021aatd shows higher temperatures and weaker Na I D and Ba II 6142 Å lines than SN 1987A, which is instead reminiscent of IIP-like atmospheres. With the applied two-component ejecta model (accounting for decay and magnetar energy), we can successfully describe the bolometric LC of SN 2021aatd, including the first ∼40-day phase showing an excess compared to 87A-like SNe, but being strikingly similar to that of the long-lived SN 2020faa. Nevertheless, finding a unified model that also explains the LCs of more luminous events (e.g., SN 2020faa) is still a matter of debate.
Key words: stars: massive / supernovae: general / supernovae: individual: SN 2021aatd / supernovae: individual: SN 1987A / supernovae: individual: SN 2020faa
Corresponding author; This email address is being protected from spambots. You need JavaScript enabled to view it. .
© The Authors 2024
 Open Access article, published by EDP Sciences, under the terms of the Creative Commons Attribution License (https://creativecommons.org/licenses/by/4.0), which permits unrestricted use, distribution, and reproduction in any medium, provided the original work is properly cited.
This article is published in open access under the Subscribe to Open model. This email address is being protected from spambots. You need JavaScript enabled to view it. to support open access publication.
1. Introduction
Type II supernovae (SNe), the cataclysmic endings of H-rich massive stars, constitute a significant fraction of all detected SN explosions (reaching ∼35–40% in galaxies closer than z ∼ 0.05; see, e.g., Perley et al. 2020). Based on their spectral and light curve (LC) properties, which seem to strongly connect to the rate of lost H envelopes prior to explosion, Type II SNe are divided into various subgroups.
Progenitors of Type IIP events, showing a plateau in their LC, are thought to be red supergiant (RSG) stars with most of their H envelope preserved, while Type IIL SNe show a linear decline from peak magnitude, probably due to the lower amount of H that could be ionized and recombined after explosion (see, e.g., Patat et al. 1994; Hiramatsu et al. 2021). However, despite some obvious photometric and spectral differences, there are doubts on whether Type IIL and IIP SNe truly originate from different types of progenitors (see, e.g., Anderson et al. 2014; Valenti et al. 2016).
Another kind of these explosions, Type IIb, constitute an intermediate subgroup between Type II and the H-poor, stripped envelope Type Ib/c SNe; they can be recognized by the prominent He features that appear in their spectra after a few days, and by the double-peaked shape of their LC; we note, however, that the first peak is not always detectable. Moreover, we also define Type IIn SN explosions showing narrow lines in their spectra, indicating interaction between the SN ejecta and a dense circumstellar medium (CSM; see, e.g., Schlegel 1990; Filippenko 1997). More recently, extremely bright events, called superluminous (SL)SNe, have also been found; those showing a H-rich spectrum are called SLSNe-II (Gal-Yam 2012; Branch & Wheeler 2017). While their origin is still unclear, it has been already revealed that some of them also show signs of strong CSM interaction (similar to Type IIn SN), while in other cases alternatives are necessary to explain the extremely high luminosity of these events.
While it is challenging to handle this classification scheme itself, there is a growing number of peculiar events that cannot be assigned to any of the groups described above. SN 1987A, the closest and best-studied extragalactic SN that appeared in the Large Magellanic Cloud (LMC), is a typical example. While its spectra closely resemble those of SNe IIP, its LC evolution is very different (reaching its primary LC peak in almost three months after a short and rapid rise, without any plateaus, see, e.g., Hamuy et al. 1988; Whitelock et al. 1988; Catchpole et al. 1988). Shortly after the first studies, it was revealed that the progenitor of SN 1987A was a compact blue supergiant (BSG), contradicting the stellar evolutionary models developed until that time (e.g., Woosley et al. 1988; Podsiadlowski et al. 1992). Since the discovery of SN 1987A, extended efforts have been made to find the reason for exploding BSG stars, including low metallicity, strong mixing of atmospheric layers, rapid rotation, binary interaction, or stellar mergers (see a recent study on modeling strategies in Dessart & Hillier 2019). To date, only a handful of similar events have been found; however, their number is growing, thanks to the effective analysis of data obtained during transient sky surveys (see, e.g., Arcavi et al. 2012; González-Gaitán et al. 2015; Taddia et al. 2016; Sit et al. 2023).
Currently, also thanks to the expanding capacities for long-term follow-up of ever more transient events, researchers have the chance to focus on a similarly exciting phenomenon: the existence of SNe with long-lasting, sometimes multipeaked LCs. A strong motivation to look for this kind of events was the discovery of the luminous, extraordinarily long-lived, Type II iPTF14hls that has showed at least five LC peaks and an extremely slow spectral evolution (reaching the nebular phase after more than 600 days; Arcavi et al. 2017; Sollerman et al. 2019). Among others factors, enhanced CSM interaction, magnetar formation, fall-back accretion, common-envelope jets, and pulsational pair-instability SNe have been invoked to explain this unique phenomenon (see Woosley 2018, for a review). During the extended analysis of Zwicky Transient Facility (ZTF) data, Soraisam et al. (2022) identified almost 40 SNe of various types showing multipeaked LCs, including SN 2020xkx, a true photometric analog of iPTF14hls (unfortunately, without a well-sampled spectroscopic follow-up). Another ZTF object was SN 2020faa, which also seems to be quite similar to iPTF14hls (at least, during the first ∼200 days of its evolution) and has been analyzed in detail by Yang et al. (2021) and Salmaso et al. (2023).
In this work, we present the detailed photometric and spectroscopic analysis of SN 2021aatd, another peculiar Type II explosion. While its early-time evolution resembles that of SN 2020faa and iPTF14hls (although at a lower luminosity scale), after ∼40 days, its LC shape becomes definitely similar to that of SN 1987A-like explosions. This paper is organised as follows. First we present our ground-based photometric and spectroscopic observations in Sect. 2. Then we describe the steps of comparative LC and spectral modeling analysis in Section 3. Finally, we discuss the results and provide our concluding remarks in Section 4.
2. Observations
SN 2021aatd (ATLAS21bjwk) was discovered by the Asteroid Terrestrial-impact Last Alert System (ATLAS, Tonry et al. 2018; Smith et al. 2020) on 2021 October 7.38 UT (MJD 59494.38), at an apparent brightness of mo = 18.35 ± 0.10 mag (Chen et al. 2021), with an epoch of last non-detection on 2021 October 5.51 UT (MJD 59492.51). The SN is offset by 2.1 arcsec south, 5.7 arcsec west from its likely host galaxy GALEXASCJ005904.40-001210.0. The first spectroscopic classification was reported by Wyatt et al. (2021), who found the object was consistent with a young peculiar Type II SN (showing the best match with the spectrum of SN 1987A).
The redshift of the host galaxy is given as z = 0.01524 ± 0.00004 in NASA/IPAC Extragalactic Database (NED1), corresponding to a Hubble-flow distance of d = 62.6±4.4 Mpc (assuming H0 = 67.8 ± 4.7 km s−1 Mpc−1). The Galactic extinction of E(B − V) = 0.025 was also adopted from NED (Schlafly & Finkbeiner 2011). Because of the lack of early-time high-resolution spectra, we do not have any information on the extinction in the host galaxy; however, based on the position of the SN, host reddening is probably not significant.
2.1. Photometry
We performed optical Johnson BV and Sloan gri (hereafter BVgri) photometry of SN 2021aatd with follow-up observations from Las Cumbres Observatory (LCO) utilizing a world-wide network of telescopes under the Global Supernova Project (GSP, Howell 2019), and with the 0.8m Ritchey-Chrétien telescope at the Baja Observatory, Hungary (Barna et al. 2023). The median combination and the aperture photometry of LCO data was carried out applying self-written pipelines using the fitsh software (Pál 2012). The data obtained at Baja Observatory were processed with standard IRAF2 routines, including basic corrections. Then we co-added three images per filter per night aligned with the wcsxymatch, geomap and geotran tasks. We obtained PSF photometry on the co-added frames using the daophot package in IRAF, and image subtraction photometry based on other IRAF tasks (e.g., psfmatch and linmatch, respectively). For the image subtraction we applied a template image taken at a sufficiently late phase, when the transient was no longer detectable on our frames.
The photometric calibration was carried out using stars from Data Release 1 of Pan-STARRS1 (PS1 DR1)3 In order to obtain reference magnitudes for our B- and V-band frames, the PS1 magnitudes were transformed into the Johnson BVRI system based on equations and coefficients found in Tonry et al. (2012). Finally, the instrumental magnitudes were transformed into standard BVgri magnitudes by applying a linear color term (using g − i) and wavelength-dependent zero points. Since the reference stars fell within a few arcminutes around the target, no atmospheric extinction correction was necessary. S-corrections were not applied. The BVgri photometry of SN 2021aatd obtained from LCO sites and from Baja Observatory are collected in Tables A.1 and A.2, respectively; the light curves (LCs) are plotted in Fig. 1.
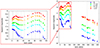 |
Fig. 1. BVgri photometry of SN 2021aatd. The filled and empty circles denote measurements from LCO sites and from Baja Observatory, respectively. The dotted vertical lines mark the epochs of spectroscopic observations shown in Table A.3. |
2.2. Spectroscopy
We obtained 11 sets of optical spectra at the LCO with the FLOYDS spectrographs mounted on the 2m Faulkes Telescope North (FTN) at Haleakala (USA) and the identical 2m Faulkes Telescope South (FTS) at Siding Spring (Australia), through the GSP, between 2021 October 9 and 2022 January 13. A 2″ wide slit was placed on the target at the parallactic angle (Filippenko 1982). We extracted, reduced, and calibrated the 1D spectra following the standard procedures using the FLOYDS pipeline (Valenti et al. 2014).
One late-time spectrum was obtained on 2022 July 26 with the Low Dispersion Survey Spectrograph 3 (LDSS-3) on the 6.5m Magellan Clay telescope at Las Campanas Observatory in Chile. Standard reductions were carried out using IRAF, including bias subtraction, flat-fielding, cosmic-ray rejection, local sky subtraction, and extraction of one-dimensional spectra. The slit was aligned along the parallactic angle to minimize differential light losses, and flux calibration was done using a spectrophotometric standard taken that night at similar airmass. The log and a summarizing plot of our spectroscopic observations on SN 2021aatd are shown in Table A.3 and in Fig. 2, respectively.
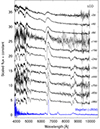 |
Fig. 2. Optical spectra of SN 2021aatd obtained from LCO sites (black) and with Magellan (blue). |
3. Analysis and results
3.1. Light curve and color evolution
SN 2021aatd shows a double-peak LC in all filters. We fit single-Gaussian functions to the brightness values around the peaks to obtain proper estimations of the peak magnitudes and epochs (see Table 1). Blue-band LCs peak systematically earlier than redder bands; we note that the B-peak is very close to the epoch of our first observation. After the initial peak, the SN shows a declining phase up to ∼40 days when it starts to brighten again. In all filters, except B-band, the SN reaches a second peak magnitude higher than the previous one. The second peak of the LC is monitored with a higher cadence; instead, considering the mean values of the second peak times, there is a two-day shift from B- to i-band maximum; their uncertainty ranges actually overlap. After the second peak, the LCs of SN 2021aatd show a rapid decline of about 0.6−1.1 mag (from the longest to the shortest wavelength, respectively) in ∼20 days before the SN disappeared behind the Sun. Observations continued from ∼240 d up to ∼400 d after discovery; in this phase, the SN showed a slow linear declining tail.
Peak times and magnitudes in the LCs of SN 2021aatd.
The late-time LC evolution of SN 2021aatd (peak brightness reached about three months after explosion, followed by a rapid decline and, finally, by a linear declining tail) resembles quite closely the behavior of 1987A-like SNe. Nevertheless, neither SN 1987A nor the few known similar events assumed to be explosions of blue supergiant stars show the first peak in their LCs (see a recent overview in Xiang et al. 2023). This suggests that, during the first several weeks of the evolution, a different LC powering mechanism may exist in the case of SN 2021aatd. We searched objects with a similar early-time behavior in recently published studies focusing on optically rebrightening SNe. As we show in detail below, the early-phase LC evolution of SN 2021aatd is very similar to that of special Type II SN 2020faa (Yang et al. 2021; Salmaso et al. 2023); however, SN 2020faa was a more luminous event.
In Fig. 3 we present the comparison of the early- and late-time r-band photometric evolution of SN 2021aatd to those of SN 2020faa, SN 1987A (R filter, Hamuy et al. 1988; Whitelock et al. 1988; Catchpole et al. 1988, 1989), the 87A-like event SN 2006au (Taddia et al. 2012), the low-luminosity Type IIP SN 2005cs (Pastorello et al. 2009), as well as the rebrightening objects iPTF14hls (r + R filters, Arcavi et al. 2017) and SN 2020xkx (Soraisam et al. 2022, downloaded from the ALeRCE ZTF Explorer4). The basic data of the SNe used for generating absolute magnitudes are shown in Table 2. We note in the case of SN 2006au and iPTF14hls that there is a large uncertainty regarding the date of explosion; thus, their LCs are shifted to match the LC maxima of SNe 1987A and 2020faa, respectively (following the method of Taddia et al. 2012; Yang et al. 2021).
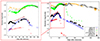 |
Fig. 3. Comparison of the early- and late-time r-band photometric evolution of SN 2021aatd to that of iPTF14hls (r + R filters, Arcavi et al. 2017), SNe 1987A (R filter, Hamuy et al. 1988; Whitelock et al. 1988; Catchpole et al. 1988, 1989), 2005cs (Pastorello et al. 2009), 2006au (Taddia et al. 2012), 2020faa (Yang et al. 2021; Salmaso et al. 2023), and 2020xkx (Soraisam et al. 2022, downloaded from the ALeRCE ZTF Explorer). In the cases of SN 2006au and iPTF14hls, there is a large uncertainty regarding the date of explosion; thus, their LCs are shifted to match the LC maxima of SNe 1987A and 2020faa, respectively (following the method of Taddia et al. 2012; Yang et al. 2021). |
Basic data of Type II SNe used for comparison.
As can be seen in Fig. 3, 87A-like and rebrightening SNe (iPTF14hls, 2020faa, 2020xkx) form two distinct luminosity groups. We note, however, that the LC of SN 2020faa starts to quickly decline ∼200 days after explosion, unlike the other two objects (see Salmaso et al. 2023). SN 2021aatd, apparently, belongs to the group of 87A-like events. At the same time, the first ∼40 days of its LC evolution closely resembles that of bright slowly evolving SNe, especially of 2020faa. Early-phase LC similarities of SNe 2021aatd and 2020faa can be seen even better in Fig. 4, which shows the comparison of early-phase absolute LCs, not only in the r filter, but also in the g and i filters. To obtain an almost perfect match, the LCs of SN 2021aatd should be shifted by ∼1.8 mag.
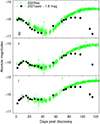 |
Fig. 4. Comparison of early-phase absolute magnitudes of SNe 2020faa and 2021aatd. The latter values are shifted by −1.8 mag. |
SN 2006au seems to also show some early-phase flux excess compared to the LC shape of SN 1987A (in general, SN 2006au was a slightly more luminous event). Unfortunately, the earliest part of the LC of SN 2006au is probably missing (the discovery of the object occurred more than one year after the previous non-detection; see Taddia et al. 2012); thus, it is difficult to use this object for a detailed comparative analysis. We also omitted iPTF14hls and SN 2020xkx from the further LC analysis since their late-time evolution is completely different from that of SN 2021aatd. Therefore, we only show a detailed comparison of the light and color curves of SN 2021aatd to those of SNe 1987A and 2020faa (based on B, V, R/r, and g, r, i data, respectively; see Fig. 5).
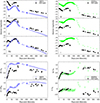 |
Fig. 5. Comparison of the light curves and color curves of SN 2021aatd to those of SNe 1987A and 2020faa. |
SN 2021aatd, as already presented in Fig. 4, shows a very similar early-time LC evolution to that of SN 2020faa, but at lower luminosities, which can also be clearly seen in the g − r and the r − i curves (Fig. 5, bottom right panel). We also discuss above the general differences between the late-time LCs of the two events. Moreover, taking another look at the right panels of Fig. 5, the slope of the LCs of SNe 2020faa and 2021aatd again seem to be quite similar in i-band, while this is not the case in the g- and r-bands; however, the very late-time g- and r-band data of SN 2020faa are close to the detection limits (see Salmaso et al. 2023). After comparing the light and color curves of SN 2021aatd with those of SN 1987A, we see a similar evolution after the first ∼50 days. However, SN 2021aatd seems to be a bit bluer in general, but we note again that we have no information on the host-galaxy extinction in the direction of SN 2021aatd.
3.2. Spectral analysis
After the detailed comparative LC analysis, in Fig. 6 we present a set of spectra of SNe 2021aatd, 2020faa, and 1987A obtained at both a very early epoch (6–8 days after explosion) and around the second LC peak of SN 2021aatd (+83–88 days). For a further comparison, we also plot the same-age spectra of SN 2017eaw, one of the best-studied Type IIP explosions.
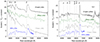 |
Fig. 6. Comparison of early- (left panel) and later-phase (right panel) spectra of SN 2021aatd to that of SNe 2020faa (Yang et al. 2021), 2017eaw (IIP, Szalai et al. 2019), and 1987A (Pun et al. 1995), respectively. All the spectra are corrected for redshift and extinction. The spectra of SNe 1987A and 2020faa are from the WISeREP database. |
As can be seen, in agreement with the color evolution shown in Fig. 5, SNe 2021aatd and 2020faa have basically the same temperature evolution up to the peak brightness, while SN 1987A has a redder spectrum at both epochs. SN 2017eaw shows the bluest spectrum at early time, but at +83–88 days its temperature becomes definitely lower than that of SNe 2021aatd and 2020faa. The slow spectral evolution is a well-known characteristic of multiple LC-peaked SNe, such as iPTF14hls or SN 2020faa (Arcavi et al. 2017; Sollerman et al. 2019; Yang et al. 2021; Salmaso et al. 2023); up to ∼100 days after explosion (when its last photospheric spectrum was obtained), 2021aatd seems to also belong to this group. At both earlier and later epochs, the spectra of SN 2021aatd show strong H Balmer lines, similarly to the spectra of SNe IIP and 1987A. At the same time, one can see differences in the cases of Na I D and Ba II 6142 Å, two other spectral features definitely worth analyzing during the comparison of Type II SNe. In the case of SNe 1987A and 2017eaw, Na I D has a deep P Cygni profile at +83–88 days, while SNe 2021aatd and 2020faa shows only weak Na I D lines. In the spectra of SN 1987A, Ba II 6142 Å is also a dominant line, while this is not the case in the spectra of the other three objects. It has been described in several works that there is a diversity in the strength of Ba II 6142 Å line among 87A-like SNe, and the weakness of this line is a characteristic of IIP-like SN atmospheres (see, e.g., Takáts et al. 2016; Dessart & Hillier 2019; Xiang et al. 2023).
Using our optical spectra, following the general method also used in the cases of SN 2020faa (Yang et al. 2021; Salmaso et al. 2023) and of 87A-like SNe (e.g., Xiang et al. 2023), we determined the Hα and Fe II 5169Å line velocities for SN 2021aatd. Taking advantage of the adequate signal-to-noise ratio of our spectra, we fit single-Gaussian profiles to the regions of the absorption minima of the two lines for calculating the line velocities (vHα and vFeII). The velocity curves of SN 2021aatd, together with that of SNe 1987A, 2020faa, and Type IIP 2012aw (also used for comparison by Salmaso et al. 2023), are shown in Fig. 7. We note that, due to the lack of spectra for SN 2012aw around +80–90 days, we used the data of its spectral twin SN 2017eaw (Szalai et al. 2019) for the spectral comparison shown in Fig. 6.
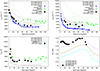 |
Fig. 7. Measured Hα (top left) and Fe II 5169 Å (top right) line velocities of SN 2021aatd compared to those of SNe 1987A (Xiang et al. 2023), 2020faa (Yang et al. 2021), and Type IIP 2012aw (Bose et al. 2013). The calculated line velocities from a3, a4, and a5 explosion models of Dessart & Hillier (2019) (DH19), as well as photospheric velocities of SNe 2021aatd and 2020faa determined from our SYN++ models, are also plotted (see text for further details). Bottom left: Calculated photospheric temperatures (Tphot) from DH19 a3, a4, and a5 models compared to Tphot values of SNe 2021aatd and 2020faa determined from our SYN++ models. Bottom right: Calculated V-band absolute magnitudes (MV) from DH19 a3, a4, and a5 models compared to the measured values of SN 2021aatd. |
In order to monitor the chemical composition, as well as the evolution of the (photospheric) temperatures and velocities in more detail, we carried out SYN++ modeling for the spectra of SNe 2021aatd and 2020faa; moreover, we also compared our observational data to the outcomes of models published by Dessart & Hillier (2019).
3.2.1. SYN++ modeling of the photospheric spectra
We applied the parameterized resonance scattering code SYN++5 (Thomas et al. 2011) for the analysis of 2−98d spectra of SN 2021aatd. We note that the code can be used for analyzing photospheric spectra; however, because of its slow spectral evolution, SN 2021aatd can be still considered in the photospheric phase at +98 days. The code allows us to make estimations on some global parameters, such as the photospheric temperature (Tph), and the velocity at the photosphere (vph). The contribution of the single ions can be taken into account by setting some local parameters for each identified ion: the optical depth (τ), the minimum and maximum velocity of the line forming region (vmin and vmax), the scale height of the optical depth above the photosphere (aux), and the excitation temperature (Texc). Since we did not find any similar analyses for SN 2020faa in the literature, we involved its photospheric spectra in our modeling process. Moreover, as a consistency check, we also fit SYN++ models on the +84d spectrum of SN 1987A.
Figure B.1 shows the results of SYN++ modeling carried out on all the 11 spectra of SN 2021aatd obtained during approximately the first three months after explosion. The observed spectra were corrected for extinction and redshift before plotting. The values of the best-fit global and local parameters are collected in Table B.1. At the earliest epochs, H I and He II lines dominate the spectrum of SN 2021aatd, which can be best described with the global parameters of vph ∼ 18 000 km s−1 and Tph ∼ 6500 K. At later phases (after ∼20 days), lines of Na I, Mg I, Mg II, Ca II, Ti II, Sr II, and Ba II emerge as well and give a significant contribution to the spectrum formation. By +98 days (the last observed epoch of the photospheric phase), vph decreases to 5000 km s−1, while Tph shows a flat, nearly constant evolution around 5000 K. We note that there is a known inconsistency during the parallel fitting of both the absorption and emission components of the strong Hα line profile, which is probably due to the basic assumption of the SYN++ code of using local thermodynamic equilibrium (LTE) for calculating level populations (see, e.g., Szalai et al. 2016).
For comparison, we also modeled the spectra of SN 2020faa (obtained at 13 different epochs from +6 to +165 days, published by Yang et al. 2021) with SYN++. The plots and parameters are shown in Fig. B.2 and in Table B.2, respectively, in the same way as in the case of SN 2021aatd. The list of identified ions and the overall chemical evolution of SN 2020faa (at least during the first three months) shows a great resemblance to that of SN 2021aatd, even though SN 2020faa was a more luminous event.
In Fig. 8 we highlight the complete SYN++ models and elemental contributions calculated for +83–88 day spectra of SNe 2021aatd and 2020faa (also used for comparison in Fig. 6), respectively. We also generated a SYN++ model for the +84d spectrum of SN 1987A. The identified ions are broadly similar in all three cases; however, modeling the blue part of the spectrum of SN 2020faa is complicated because of its lower quality. In the spectrum of SN 1987A, as mentioned above, Na I D and Ba II 6142 Å have significantly deeper profiles than in the cases of SNe 2021aatd and 2020faa. We added two further ions, N II and O I, to the model of SN 1987A to describe its +84d spectrum.
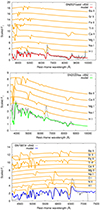 |
Fig. 8. Ion contributions from SYN++ models calculated for spectra at +83, +88, and +84 days of SNe 2021aatd, 2020faa, and 1987A, respectively. |
In Fig. 7, in addition to the Hα and Fe II 5169Å line velocities, the photospheric velocity (vphot) evolution of both SNe 2021aatd and 2020faa, determined from SYN++ models, is also shown. In the case of SN 2020faa, the first two months are poorly covered by spectra; however, it can be clearly seen at later phases that its photospheric and line velocities are both much higher than those of the other two objects. SN 2021aatd has, at the same time, higher line velocities than that of SN 1987A (especially in the case of the Fe II 5169Å line). It can also be seen that vphot values are definitely higher than that of vFeII in both SNe 2021aatd and 2020faa. In SNe IIP, vFeII is thought to be a good indicator of the photospheric velocity (vphot) after ∼20 days since the minimum of the Fe II 5169Å absorption profile tends to form near the photosphere (see Branch et al. 2003). However, the detailed investigation of Takáts & Vinkó (2012) showed that the true vphot may significantly differ from single line velocities. In the cases of SNe 2021aatd and 2020faa, as our SYN++ models suggest, Fe II lines can be blended with Mg I, for example.
3.2.2. Comparison of spectral data with Dessart & Hillier (2019) models
We also compare our spectral dataset and the determined velocities and temperatures to the outputs of radiative transfer (cmfgen) models published by Dessart & Hillier (2019, hereafter DH19). DH19 presented various sets of model spectra (covering the first ∼250–300 days after explosion), representing the final outcomes of the explosion of a single MZAMS = 15 M⊙ low-metallicity progenitor that dies as a BSG, in order to study in detail the origin of 87A-like SNe. As the authors state, their model set was not designed to properly reproduce the observations; however, model outputs can be used for giving constraints on certain physical parameters.
We selected three of the DH19 models (a3, a4, a5), whose main parameters (ejecta masses, kinetic energies, and initial 56Ni masses) are shown in Table 3. A comparison of these DH19 model spectra to the observed +83–84d spectra of SNe 2021aatd and 1987A are shown in Fig. 9. As DH19 has already shown, the spectra of SN 1987A can be best described with the a4 model. At the same time, the a3 and a5 models reproduce the main features and shape of the spectra; we note however that the a5 model definitely seems to be too energetic.
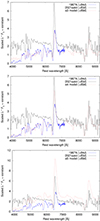 |
Fig. 9. Comparison of +83 and +84d spectra of SNe 2021aatd and 1987A to the a3 (top), a4 (middle), and a5 (bottom) model spectra published by Dessart & Hillier (2019); see details in text. All spectra are normalized to the flux values at 6000 Å. |
Ejecta masses, kinetic energies, and initial 56Ni masses in the adopted Dessart & Hillier (2019) explosion models.
Unfortunately, the available photospheric spectra of SN 1987A have a cutoff at ∼7200Å ; nevertheless, the selected DH19 models seem to describe the red part of the spectrum of SN 2021aatd quite well. At the same time, SN 2021aatd shows a clear blue-part excess (i.e., higher temperature) that was also discussed in Sect. 3.1 regarding the comparison of both color curves and observed spectra (Figs. 5 and 6, respectively). All DH19 models give much lower photospheric temperatures (∼4300−4700 K) at ∼83 days than the value of Tphot = 6300 K we determined from the observed data using SYN++ (see Fig. 7). However, the model velocity curves published by DH19 (also shown in Fig. 7) strengthen the picture that both the a3 and a4 models can be valid descriptions of the event of SN 2021aatd. We note that, at the same time, the a5 velocity curves are in quite good agreement with that of SN 2020faa.
Furthermore, as DH19 have already described in detail, the LCs calculated from their spectral models do not give back the proper shape of 87A-like events: the model LCs are overall too broad and, specifically for SN1987A, the a4 model LC shows a slower rise to a fainter maximum. Comparing the value of the observed (second) V-peak magnitude of SN 2021aatd (Vmax = −16.60 ± 0.16 mag, see Table 1) with the calculated V-peak magnitudes in DH19, there is an even larger difference: this value is much larger than that of the a3 and a4 model LCs (Vmax ≈ −15.0 and −15.6 mag, respectively), and even slightly larger than that of the a5 model (Vmax ≈ −16.4 mag) (see bottom right panel of Fig. 7). We note that the V-band LC calculated from the 56Ni-enhanced a4ni model of DH19 actually reaches the observed peak brightness of SN 2021aatd; however, its shape is even broader than that of a4 and a5 model LCs.
Dessart & Hillier (2019) list several possible explanations for resolving the LC problem at the given 15 M⊙ progenitor configuration (clumping of ejecta matter, weaker 56Ni mixing, or a greater He-to-H abundance ratio), and we also note that a lower ejecta mass would result in a faster rise to maximum and a brighter peak. In the cases of both SNe 2021aatd and 2020faa, the remarkable early-phase flux excess needs a further explanation. We discuss the potential explanations of the LC evolution in Sect. 3.3.
3.2.3. Progenitor mass from the nebular spectrum
In addition to the comparison with the DH19 models, we can also use our single nebular (+293d) spectrum of SN 2021aatd for the estimation of the initial progenitor mass adopting the spectral models published by Jerkstrand et al. (2012, 2014). Based on their works, a monotonic relation exists between the intensity of the [OI] doublet (λλ6300, 6364) and the mass of the progenitor star. Here we compare the observed [O I] emission line using the model spectra presented in Jerkstrand et al. (2012, 2014). The adopted synthesized spectra were produced for MZAMS = 12, 15, 19, and 25 M⊙ at an epoch of 306 days for the 12, 15, and 25 M⊙ models and at 332 days for the 19 M⊙ model. These models were originally generated for the Type IIP SN 2004et using a nickel mass of M56Ni,mod = 0.062 M⊙ and dmod = 5.5 Mpc. To apply these models to SN 2021aatd, the synthetic spectra are scaled to the inferred distance (62.6 Mpc) and nickel mass (0.056 M⊙, see Table 4) via the relation (described in, e.g., Szalai et al. 2019)
 (1)
(1)
Parameters of the best-fit two-component bolometric LC models for SNe 2021aatd and 1987A.
where Fobs and Fmod are the observed and model fluxes, dobs and dmod are the observed and model distances, and M56Ni,obs and M56Ni,mod are the observed and model nickel masses synthesized during the explosion (see Fig. 10).
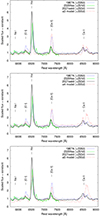 |
Fig. 10. Comparison of nebular spectra of SNe 2021aatd, 2020faa, and 1987A to the a3 (top), a4 (middle), and a5 (bottom) model spectra published by Dessart & Hillier (2019); see details in text. All spectra are normalized to the flux values at 6000 Å. |
The result of this comparison can be seen in Fig. 11. We find that both the shape and the intensity level of the observed line profile resemble most closely those of the 15 M⊙ model, suggesting that the initial mass of the progenitor is close to this value. This supports our previous findings (Section 3.2.2) showing that spectral observables of SN 2021aatd can be well described with the explosion of a MZAMS ∼ 15 M⊙ star. We note, however, that instead of cases of Type IIP SNe 2004et (Jerkstrand et al. 2012) and 2017eaw (Szalai et al. 2019) assumed to also arise from a MZAMS ∼ 15 M⊙ star, the general match between the model and the observed spectra is not perfect. A potential reason for this could be that Jerkstrand et al. developed these models not for studying exploding BSG stars, but for RSG stars.
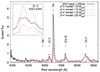 |
Fig. 11. Comparison of the +293d nebular spectrum of SN 2021aatd to the model spectra published by Jerkstrand et al. (2012, 2014). Model spectra with the closest epochs to that of the observed one (+306 days for the 12, 15, and 25 M⊙ models, and +332 days for the 19 M⊙ model) were selected; see details in text. All spectra are normalized to the flux values at 6000 Å. The [O I] line doublet (λλ6300, 6364) for the model and the observed spectra is shown in the inset; the observed line profile resembles most closely the 15 M⊙ model, suggesting that the initial mass of the progenitor is close to this value. |
3.3. Bolometric LC modeling
3.3.1. Constructing the bolometric LC of SN 2021aatd
In principle, generating the bolometric luminosities requires sampling the spectral energy distribution along the whole electromagnetic spectrum. However, proper observational coverage in all photometric bands is not the case for SN 2021aatd.
The bolometric LC of SN 2021aatd was constructed using the SuperBol code (Nicholl 2018). As a first step, we generated a pseudobolometric LC due to the simple integration of the observed fluxes measured in the BVgri bands. To this end, we used only those epochs where we had data measured in all the filters (29 out of 35 nights in total), corrected the magnitudes for extinction, and converted them to flux densities. For the integration of the flux densities, the code uses a simple trapezoidal rule and assumes zero flux below and above the limit defined by the filter equivalent width of the bluest and reddest filter, respectively. Finally, the measured BVgri flux was converted into luminosity using the host distance given in Table 2.
Next, we made efforts to calculate the flux contribution from the unobserved ultraviolet (UV) and infrared (IR) regimes. A basic step is to fit a blackbody (BB) function to the observed flux densities to estimate the UV/IR part of the spectral energy distributions (SEDs). Generally, as presented in Salmaso et al. (2023), among others, the IR contribution can be closely estimated with the integration of the Rayleigh-Jeans tail of the fitted BB function.
This is not the case in the UV. As also noted by Salmaso et al. (2023) (and described in detail previously by Dessart & Hillier 2005), strong depletion caused by metal lines leads to depressed UV fluxes with respect to the BB function. In the case of SN 2021aatd, no observational UV data are available to directly estimate the degree of this suppression. While atmospheric models of 87A-like explosions calculated by Dessart & Hillier (2019) also cover the UV regime, they probably cannot be reliably used for estimating the UV contribution in the case of SN 2021aatd. As we show in Figs. 5 and 6, early-time (≲40 d) spectral properties and color evolution of SN 2021aatd differ very much from those of 1987A, especially in the blue region. At the same time, in this earliest phase, SN 2021aatd seems to be very similar to the special Type II SN 2020faa regarding both their color curves and spectra, just at a lower luminosity scale (as we also described in detail above).
Thus, we followed a method somewhat similar to that of Salmaso et al. (2023) in the case of SN 2020faa. Based on their Fig. 2, we adopted the UV photometry of Type II-P SN 2012aw obtained at an epoch of +28 days, which shows a definite suppression regarding the BB function (TBB = 6500K) fitted to its optical-near-IR flux densities. We also adopted the +30 day UV spectrum of SN 1987A.6 We used the option in SuperBol taking into account line blanketing at UV wavelengths applying the formula LUV(λ < λcutoff) = LBB(λ)*(λ/λcutoff)x, where users can choose the values of the cutoff wavelength (λcutoff) and of the suppression index (x). We found that applying values of λcutoff = 4000 Å and x = 4.0 results in a reliable shape for the suppressed BB curve compared to the measured UV SED and/or spectrum of SNe 2012aw and 1987A.
Thus, the final bolometric LC of SN 2021aatd was constructed using this approximation. We note, however, that this final luminosity curve only slightly differs from the one calculated via full BB correction after the first two weeks (when the largest part of the SED of the SN shifts to the optical regime). The final bolometric LC of SN 2021aatd, together with the results of the other approximations used in SuperBol, are shown in Fig. 12. A comparison of the final bolometric LC of SN 2021aatd to that of SN1987A and 2020faa are in agreement with the trends seen in the filtered LCs of these objects (see Fig. 5).
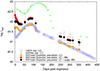 |
Fig. 12. BVgri (pseudo)bolometric LCs of SN 2021aatd calculated with the SuperBol code. The orange and red filled circles denote respectively the “pure” pseudo-bolometric LC (i.e., the integration of BVgri fluxes) and the LC corrected after the integration of a blackbody (BB) function fitting of the available photometry. The black circles show the final bolometric LC of SN 2021aatd calculated from a suppressed BB estimation (see details in the text). Bolometric LCs of SNe 1987A and 2020faa (adopted from Nagy & Vinkó 2016 and Salmaso et al. 2023, respectively) are also shown. |
3.3.2. Two-component semi-analytic modeling of the bolometric LCs of SNe 1987A and 2021aatd
To estimate the physical properties of SN explosions, we use a semi-analytical diffusion model originally introduced by Arnett & Fu (1989), which assumes a homologous expanding and spherically symmetric SN ejecta with a uniform density profile and also takes into account the effect of recombination. However, the LC of SN 2021aatd shows a double peak that cannot be fitted by the Arnett model. To deal with this cooling phase of the shock breakout, we assume a two-component structure for the SN ejecta (applying a model developed by some of our group; see Nagy et al. 2014; Nagy & Vinkó 2016). Here, the first peak of the LC is dominated by the adiabatic cooling of the shock-heated, H-rich envelope (referred to as the shell), and the second peak is powered by radioactive decay deposited in the denser inner region (the core). Thus, the main difference between the two components is that the outer, low-density shell is assumed to be powered only by shock heating (and not by radioactive decay).
As a starting point, we adopted the model parameters we used for modeling the bolometric LC of SN 1987A in Nagy & Vinkó (2016) (hereafter NV16) assuming a moderate value of ejecta mass (Mej ∼ 8 M⊙) and a recombination temperature of Trec = 5500K. Nevertheless, we note that our original model presented in NV16 is unable to fit the second (main) LC peak of SN 1987A properly. To model the observed LCs as closely as possible, we apply here an improved version of our previously published LC fitting method: we involve an alternative energy source in addition to the radioactive decay, which considers the energy deposition of the rotational energy of a newborn magnetar (just as applied by Salmaso et al. 2023, in the case of SN 2020faa). The magnetar model has the advantage of reducing the required nickel mass as well as altering the slope of the late-time LC. Figure 13 shows the comparison of the original (NV16) and the improved model without and with the magnetar contribution, respectively. It can be seen that the late decreasing part of the LC of SN 1987A can be nicely explained with pure Ni-Co decay, but involving the magnetar energy source (i) results in a successful modeling of the main LC peak at roughly +90 days, (ii) does not affect the early-time LC fit (shell component), and (iii) allows the fine-tuning of the fit of the late-time LC.
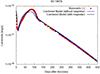 |
Fig. 13. Bolometric LC of SN 1987A (circles) with the best-fit two-component Arnett-Fu models, assuming either only radioactive energy input (blue line, Nagy & Vinkó 2016) or Ni-Co decay with an additional magnetar power source (black line, Model I from this work). |
Thus, we decided to continue the LC modeling process applying this improved method (hereafter Model I). The main model parameters, in addition to recombination temperature (Trec) and ejecta mass (Mej) as mentioned above, are the progenitor radius R0 (in 1011 cm units), the initial mass of the radioactive 56Ni (MNi, in M⊙), the total energy (Etot, in 1051 erg), the ratio of the kinetic to thermal energies of the ejecta (Ekin/ETh), the average opacity of the ejecta (κ, in cm2/g), and the spin-down energy of the magnetar (Ep, in 1051 erg) and its characteristic timescale (tp, in days). As can be seen in Table 4, the Model I LC parameter set of SN 1987A shows some differences with that previously published in NV16. The most significant changes are in the values of Trec (7000 vs. 5500 K), and in the core parameters R0, core (2.8 vs. 29.0 ×1011 cm) and Ekin, core/ETh, core (3.2 vs. 11.7). At the same time, it was not necessary to change any shell parameters.
As a next step, we fit Model I to the final bolometric LC of SN 2021aatd calculated with SuperBol (see above). In Fig. 14 we present two slightly different solutions assuming recombination temperatures of Trec = 6500 K and 7000 K (left and right panels, respectively). The reason for this is the presence of a modest re-brightening on the bolometric LC at around +300 days, which may be a hint for CSM interaction, but the late part of the LC is not well-covered enough to consider it as strong evidence. Nevertheless, late-time LC evolution of SN 2021aatd is not linear and cannot be perfectly described with one model. Thus, we decided to take into account both cases: the left panel of Fig. 14 (Trec = 6500 K) shows the best fit for data up to ∼300 days, while the right panel (Trec = 7000 K) is the best solution including the latest data points as well. We note, however, that both parameter sets represent hydrogen-depleted ejecta, and that they are quite similar; there are only small differences in some core parameters but no changes in shell parameters at all (see Table 4). In both panels of Fig. 14, we also present the contributions of both the radioactive decay and magnetar energy input to the core luminosity component.
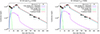 |
Fig. 14. Bolometric LC of SN 2021aatd (black circles) with the best-fit two-component Model I curves (red line). The left and right panels show the results of our model fitting assuming a recombination temperature of Trec = 6500 and 7000 K, respectively. The contributions of the core and the shell parts of the ejecta are plotted as blue and green lines, respectively. The light blue and magenta lines represent respectively the contribution of the radioactive decay and magnetar energy input to the luminosity evolution of the core component. Details and parameter values can be found in the text and in Table 4. |
The best-fit parameter sets of Model I for the data of both SNe 1987A and 2021aatd give an ejecta mass of Mej ∼ 8 M⊙, similarly to the original conclusion of NV16. However, taking into account both our findings on comparing observed and model spectra (Sections 3.2.2 and 3.2.3) and the results of previous works on stellar evolution and explosion processes of BSG stars (e.g., Blinnikov et al. 2000; Utrobin et al. 2015; Dessart & Hillier 2019; Xiang et al. 2023), it seems to be plausible to assume a higher ejecta mass. This problem was already discussed in NV16; from the point of view of the applied LC modeling method, the key is the degeneration of ejecta mass (Mej) and average opacity (κ). As described in detail in NV16 (and references therein), for H-rich CCSNe the potential range of the average opacity in the core is κcore ≈ 0.2 ± 0.1 cm2/g; if we let κcore vary within the whole interval, value of Mej, core (and thus the mass of the progenitor) may be constrained within a factor of ∼2. There is the same relation between κshell ≈ 0.3 − 0.4 and Mej, shell; however, since Mej, shell has a much lower value, it contributes less to the mass of the progenitor star.
Thus, as a next step, we defined Model II, fixing Trec = 7000 K and Mej, core = 14.35 M⊙ for both SNe 2021aatd and 1987A; these values, together with Mej, shell ≈ 0.1 − 0.2 M⊙, are in very good agreement with the assumptions of the atmospheric models a3 and a4 of Dessart & Hillier (2019). As Model II seems to be the more plausible solution, we estimated the uncertainty of the model parameters for SN 2021aatd. To do so, we created models and fit them to not only the average values, but also to the upper and lower limits of the bolometric luminosities. At the same time, it was necessary to change the shell parameters for both SNe 2021aatd and 1987A to get similarly good fits as in the case of Model I (see Fig. 15 and Table 4 for the results). During the fitting of Model II, we used a power-law density profile (using an index of n = 1.8) for SN 2021aatd, while we obtained a better fit by assuming a constant density profile for SN 1987A. While core Ni-mass and magnetar parameters remain unchanged, we get smaller values for the radius and higher values for the total energy of the core component; κcore, being 0.24 and 0.21 cm2/g for SN 2021aatd and 1987A, respectively, is still in the desired range.
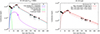 |
Fig. 15. Results of fitting Model II to the bolometric LC of SN 2021aatd. The left panel shows all the core and shell components of the best-fit Model II curve. The right panel shows the best-fit Model II curves fitted to the average values and to the upper and lower limits of the bolometric luminosities. Details and parameter values can be found in the text and in Table 4. |
Overall, the core parameters of SNe 2021aatd and 1987A seem to be similar using either the Model I or Model II configurations; this is exactly what is expected from the similar late-time LC evolution of the two objects. However, SN 2021aatd was a more luminous event than SN 1987A, which is reflected in the values of Ni-mass (0.13 vs. 0.06 M⊙) and, in Model II, also of the total energy (6.4 vs. 3.6 ×1051 erg). At the same time, the core radius of SN 2021aatd seems to be significantly smaller than that of SN 1987A.
Looking at the final shell parameters, we see that the differences between the two events are more remarkable, just as suggested by the differences in their early-time luminosity and spectral properties (the shapes of the shell LC components of both SNe can be seen better in Fig. 16). This is especially true, if we compare the Model II shell parameters of the objects. Based on that parameter set, we definitely see a more massive and more energetic shell in the case of SN 2021aatd. Further evidence of the reliability of Model II is that we obtain a higher kinetic energy (and thus higher ejecta velocities) in the shell for SN 2021aatd than for SN 1987A, in agreement with the results we received from the analysis of the spectral datasets (see Sect. 3.2), while this is not the case if we apply Model I.
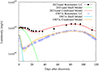 |
Fig. 16. Comparison of the early-phase Model II bolometric LC fits of SNe 2021aatd and 1987A. |
4. Discussion and conclusions
Based on our detailed spectral and LC analysis, the LC evolution of SN 2021aatd after the first ∼40 days is very similar to that of SN 1987A. We found that this phase can be well described with the explosion of a MZAMS ∼ 15 M⊙ BSG star, as was previously assumed and investigated in detail for 87A-like explosions by Dessart & Hillier (2019). However, as we note above, the photospheric temperatures are considerably higher for SN 2021aatd than for SN 1987A. Moreover, the Na I D and Ba II 6142 Å lines, which appear as dominant lines in the spectra of SN 1987A, are very weak in the case of SN 2021aatd. These properties of SN 2021aatd, just as the relatively high vHα and vFeII velocity curves shown in Fig. 7, instead resemble SN IIP-like atmospheres. Nevertheless, such transitions between 1987A-like and IIP-like SNe have been already described in several works (e.g., Takáts et al. 2016; Dessart & Hillier 2019; Xiang et al. 2023).
As described in Sect. 3.2.2, the proper explanation of the LC evolution of 87A-like SNe based on the outcomes of radiative transfer spectral models is challenging. Extended efforts have been made for modeling bolometric LC of 1987A and of similar events using hydrodynamic codes, taking into account various aspects like rotation, mixing of 56Ni, clumping of ejecta matter, or the presence of a binary companion (see a review in Dessart & Hillier 2019, and even more recent results in, e.g., Dessart & Audit 2019, Menon et al. 2019, or Utrobin et al. 2021).
In this work (see Sect. 3.3) we present a simpler semi-analytical model assuming a two-component ejecta developed by some of our group (Nagy et al. 2014; Nagy & Vinkó 2016) and based on the method originally introduced by Arnett & Fu (1989), which seems to also be appropriate for describing the bolometric LC of 87A-like SNe. While this kind of LC modeling of SN 1987A has been already published in Nagy & Vinkó (2016), to achieve an even better fit, here we apply an improved version of the LC model. Involving the rotational energy of a newborn magnetar in addition to radioactive decay allows us to fine-tune the fitting both around the peak and at later phases.
In the case of the primary object of this study, SN 2021aatd, we can also successfully apply this improved bolometric LC model. While, as mentioned, its late-time LC evolution is very similar to that of SN 1987A (which leads to very similar model parameters regarding the core ejecta component), the early-time peculiar LC of SN 2021aatd can be also well described with changing the outer (shell) parameters towards a higher ejecta mass and total energy than in the case of SN 1987A, choosing our Model II configuration (which has a fixed recombination temperature of Trec = 7000 K and a fixed core ejecta mass of Mej, core = 14.35 M⊙ for both SNe 2021aatd and 1987A). Using this parameter set, we find that summed (core + shell) values of key parameters (Mej ≈ 14.6 M⊙, MNi ≈ 0.13 M⊙, and Ekin = 3.7× 1051 erg) harmonize well with those used in the adopted DH19 spectral models for the case of SN 2021aatd (see Table 3).
We also note that the parameter set that belongs to Model I (assuming a lower total ejecta mass of ∼8 M⊙, but a somewhat larger core radius but lower energies, without any change in shell parameters) also gives a proper LC solution for SN 2021aatd (and also for SN 1987A, but with modified shell parameters, see Table 4). This is probably due to the known degeneration of our model between the mass and the average opacity of the ejecta (see Nagy & Vinkó 2016). Furthermore, as noted by Dessart & Hillier (2019), assuming a low ejecta mass (and thus a progenitor mass of < 15 M⊙) could solve the LC fitting problems of their radiative transfer models. However, we note that the shell parameters resulted by fitting Model I do not reflect the true energy–velocity relations between SNe 2021aatd and 1987A, while Model II parameters do. Moreover, providing another argument in favor of a ∼15 M⊙ progenitor, we refer here to the results of the comparison of the nebular spectrum of SN 2021aatd with the models of Jerkstrand et al. (2012, 2014) (see Sect. 3.2.3).
We also showed that both spectral and early-time LC evolution of SN 2021aatd (i.e., before ∼90 days) remarkably resembles that of the long-lived SN 2020faa (see Sect. 3.1). Looking again at Figs. 3−5, we see that the striking similarity of light and color curves of these two events during roughly the first three months calls for a similar physical background, and even that the luminosity scales of the two SNe differ by a factor of ∼5–10. For describing the pseudo-bolometric (g′+r′+i′) LC of SN 2020faa, Salmaso et al. (2023) also apply the Nagy & Vinkó (2016) model with the built-in magnetar energy component, just as we do in the case of SNe 2021aatd and 1987A. They successfully model the early LC of SN 2020faa, however, assuming a more massive (Mej ≈ 23 M⊙) and larger (R0, shell ≈ 1014 cm) progenitor. At the same time, this model does not provide a satisfactory power explanation for the peak without an unphysically large value of Ni-mass or assuming magnetar spin-down parameters that are in contrast with the rapid drop of LC after the peak (which, as can be seen in Figs. 3 and 5, is quite different from the post-peak evolution of both SNe 2021aatd and 1987A). Thus, in order to describe the peak luminosity, Salmaso et al. (2023) involved further potential explanations (hidden interaction with an inner disk or effects of a delayed choked jet); however, proving these alternatives requires further investigations.
Nevertheless, our analysis of 2021aatd, and of SNe 1987A and 2020faa, seems to strengthen the idea that we do see a similar kind of explosions, which all can be described with a two-component ejecta (assuming extra luminosity source(s) in the case of SN 2020faa). Currently, only a handful of 1987A-like SNe and even fewer long-lived multipeaked SNe are known; thus, their connection is not yet clear. However, ongoing and near-future large-scale transient surveys are expected to find more and more objects similar to SN 2021aatd, helping to give a clearer view of the reason behind the similarities and diversity of exploding H-rich massive stars.
IRAF is distributed by the National Optical Astronomy Observatories, which are operated by the Association of Universities for Research in Astronomy, Inc., under cooperative agreement with the National Science Foundation.
The spectrum is from WISeREP (https://www.wiserep.org/)
Acknowledgments
We used WISeREP (https://www.wiserep.org/) for downloading previously published spectra. We gratefully thank Irene Salmaso for sharing the nebular spectra of SN 2020faa with us. This work makes use of the Las Cumbres Observatory global telescope network. The LCO group is supported by NSF grants AST-1911151 and AST-1911225. This project has been supported by the GINOP-2-3-2-15-2016-00033 project of the National Research, Development and Innovation (NRDI) Office of Hungary funded by the European Union, as well as by NKFIH OTKA FK-134432, PD-134434 and K-142534 grants, and from the HUN-REN Hungarian Research Network. T.S. is supported by the János Bolyai Research Scholarship of the Hungarian Academy of Sciences. R.K.T., T.S., and D.B. are supported by the ÚNKP 22-4 and ÚNKP 22-5 New National Excellence Programs of the Ministry for Culture and Innovation from the source of the NRDI Fund of Hungary, respectively.
References
- Anderson, J. P., González-Gaitán, S., Hamuy, M., et al. 2014, ApJ, 786, 67 [Google Scholar]
- Arcavi, I., Gal-Yam, A., Cenko, S. B., et al. 2012, ApJ, 756, L30 [NASA ADS] [CrossRef] [Google Scholar]
- Arcavi, I., Howell, D. A., Kasen, D., et al. 2017, Nature, 551, 210 [Google Scholar]
- Arnett, W. D., & Fu, A. 1989, ApJ, 340, 396 [NASA ADS] [CrossRef] [Google Scholar]
- Barna, B., Nagy, A. P., Bora, Z., et al. 2023, A&A, 677, A183 [NASA ADS] [CrossRef] [EDP Sciences] [Google Scholar]
- Blinnikov, S., Lundqvist, P., Bartunov, O., Nomoto, K., & Iwamoto, K. 2000, ApJ, 532, 1132 [NASA ADS] [CrossRef] [Google Scholar]
- Bose, S., Kumar, B., Sutaria, F., et al. 2013, MNRAS, 433, 1871 [Google Scholar]
- Branch, D., & Wheeler, J. C. 2017, Supernova Explosions (Springer) [CrossRef] [Google Scholar]
- Branch, D., Baron, E. A., & Jeffery, D. J. 2003, in Supernovae and Gamma-Ray Bursters, ed. K. Weiler (Lecture Notes in Physics), 598, 47 [CrossRef] [Google Scholar]
- Catchpole, R. M., Whitelock, P. A., Feast, M. W., et al. 1988, MNRAS, 231, 75P [NASA ADS] [CrossRef] [Google Scholar]
- Catchpole, R. M., Whitelock, P. A., Menzies, J. W., et al. 1989, MNRAS, 237, 55P [NASA ADS] [CrossRef] [Google Scholar]
- Chen, T. W., Cai, L., Smith, K. W., et al. 2021, Trans. Name Ser. AstroNote, 262, 1 [NASA ADS] [Google Scholar]
- Dessart, L., & Audit, E. 2019, A&A, 629, A17 [NASA ADS] [CrossRef] [EDP Sciences] [Google Scholar]
- Dessart, L., & Hillier, D. J. 2005, A&A, 437, 667 [NASA ADS] [CrossRef] [EDP Sciences] [Google Scholar]
- Dessart, L., & Hillier, D. J. 2019, A&A, 622, A70 [NASA ADS] [CrossRef] [EDP Sciences] [Google Scholar]
- Filippenko, A. V. 1982, PASP, 94, 715 [Google Scholar]
- Filippenko, A. V. 1997, ARA&A, 35, 309 [NASA ADS] [CrossRef] [Google Scholar]
- Gal-Yam, A. 2012, Science, 337, 927 [Google Scholar]
- González-Gaitán, S., Tominaga, N., Molina, J., et al. 2015, MNRAS, 451, 2212 [CrossRef] [Google Scholar]
- Hamuy, M., Suntzeff, N. B., Gonzalez, R., & Martin, G. 1988, AJ, 95, 63 [NASA ADS] [CrossRef] [Google Scholar]
- Hiramatsu, D., Howell, D. A., Moriya, T. J., et al. 2021, ApJ, 913, 55 [CrossRef] [Google Scholar]
- Howell, D. 2019, Am. Astron. Soc. Meeting Abstr., 233, 25816 [NASA ADS] [Google Scholar]
- Jerkstrand, A., Fransson, C., Maguire, K., et al. 2012, A&A, 546, A28 [NASA ADS] [CrossRef] [EDP Sciences] [Google Scholar]
- Jerkstrand, A., Smartt, S. J., Fraser, M., et al. 2014, MNRAS, 439, 3694 [Google Scholar]
- Menon, A., Utrobin, V., & Heger, A. 2019, MNRAS, 482, 438 [NASA ADS] [CrossRef] [Google Scholar]
- Nagy, A. P., & Vinkó, J. 2016, A&A, 589, A53 [NASA ADS] [CrossRef] [EDP Sciences] [Google Scholar]
- Nagy, A. P., Ordasi, A., Vinkó, J., & Wheeler, J. C. 2014, A&A, 571, A77 [NASA ADS] [CrossRef] [EDP Sciences] [Google Scholar]
- Nicholl, M. 2018, Res. Notes Am. Astron. Soc., 2, 230 [NASA ADS] [Google Scholar]
- Pál, A. 2012, MNRAS, 421, 1825 [Google Scholar]
- Pastorello, A., Valenti, S., Zampieri, L., et al. 2009, MNRAS, 394, 2266 [Google Scholar]
- Patat, F., Barbon, R., Cappellaro, E., & Turatto, M. 1994, A&A, 282, 731 [NASA ADS] [Google Scholar]
- Perley, D. A., Fremling, C., Sollerman, J., et al. 2020, ApJ, 904, 35 [NASA ADS] [CrossRef] [Google Scholar]
- Podsiadlowski, P., Joss, P. C., & Hsu, J. J. L. 1992, ApJ, 391, 246 [Google Scholar]
- Pun, C. S. J., Kirshner, R. P., Sonneborn, G., et al. 1995, ApJS, 99, 223 [NASA ADS] [CrossRef] [Google Scholar]
- Salmaso, I., Cappellaro, E., Tartaglia, L., et al. 2023, A&A, 673, A127 [NASA ADS] [CrossRef] [EDP Sciences] [Google Scholar]
- Schlafly, E. F., & Finkbeiner, D. P. 2011, ApJ, 737, 103 [Google Scholar]
- Schlegel, E. M. 1990, MNRAS, 244, 269 [NASA ADS] [Google Scholar]
- Sit, T., Kasliwal, M. M., Tzanidakis, A., et al. 2023, ApJ, 959, 142 [NASA ADS] [CrossRef] [Google Scholar]
- Smith, K. W., Smartt, S. J., Young, D. R., et al. 2020, PASP, 132, 085002 [Google Scholar]
- Sollerman, J., Taddia, F., Arcavi, I., et al. 2019, A&A, 621, A30 [NASA ADS] [CrossRef] [EDP Sciences] [Google Scholar]
- Soraisam, M., Matheson, T., Lee, C.-H., et al. 2022, ApJ, 926, L11 [NASA ADS] [CrossRef] [Google Scholar]
- Szalai, T., Vinkó, J., Nagy, A. P., et al. 2016, MNRAS, 460, 1500 [NASA ADS] [CrossRef] [Google Scholar]
- Szalai, T., Vinkó, J., Könyves-Tóth, R., et al. 2019, ApJ, 876, 19 [Google Scholar]
- Taddia, F., Stritzinger, M. D., Sollerman, J., et al. 2012, A&A, 537, A140 [NASA ADS] [CrossRef] [EDP Sciences] [Google Scholar]
- Taddia, F., Sollerman, J., Fremling, C., et al. 2016, A&A, 588, A5 [NASA ADS] [CrossRef] [EDP Sciences] [Google Scholar]
- Takáts, K., & Vinkó, J. 2012, MNRAS, 419, 2783 [CrossRef] [Google Scholar]
- Takáts, K., Pignata, G., Bersten, M., et al. 2016, MNRAS, 460, 3447 [CrossRef] [Google Scholar]
- Thomas, R. C., Nugent, P. E., & Meza, J. C. 2011, PASP, 123, 237 [NASA ADS] [CrossRef] [Google Scholar]
- Tonry, J. L., Stubbs, C. W., Kilic, M., et al. 2012, ApJ, 745, 42 [Google Scholar]
- Tonry, J. L., Denneau, L., Heinze, A. N., et al. 2018, PASP, 130, 064505 [Google Scholar]
- Utrobin, V. P., Wongwathanarat, A., Janka, H. T., & Müller, E. 2015, A&A, 581, A40 [NASA ADS] [CrossRef] [EDP Sciences] [Google Scholar]
- Utrobin, V. P., Wongwathanarat, A., Janka, H. T., et al. 2021, ApJ, 914, 4 [NASA ADS] [CrossRef] [Google Scholar]
- Valenti, S., Sand, D., Pastorello, A., et al. 2014, MNRAS, 438, L101 [Google Scholar]
- Valenti, S., Howell, D. A., Stritzinger, M. D., et al. 2016, MNRAS, 459, 3939 [NASA ADS] [CrossRef] [Google Scholar]
- Whitelock, P. A., Catchpole, R. M., Menzies, J. W., et al. 1988, MNRAS, 234, 5P [NASA ADS] [CrossRef] [Google Scholar]
- Woosley, S. E. 2018, ApJ, 863, 105 [NASA ADS] [CrossRef] [Google Scholar]
- Woosley, S. E., Pinto, P. A., & Ensman, L. 1988, ApJ, 324, 466 [NASA ADS] [CrossRef] [Google Scholar]
- Wyatt, S., Sand, D., Andrews, J., Daly, P., & Hosseinzedah, G. 2021, Transient Name Server Classification Report 2021-3458, 1 [Google Scholar]
- Xiang, D., Wang, X., Zhang, X., et al. 2023, MNRAS, 520, 2965 [NASA ADS] [CrossRef] [Google Scholar]
- Yang, S., Sollerman, J., Chen, T. W., et al. 2021, A&A, 646, A22 [NASA ADS] [CrossRef] [EDP Sciences] [Google Scholar]
Appendix A: Observational data
BVgri photometry of SN 2021aatd obtained from LCO sites
BVgri photometry of SN 2021aatd obtained from the Baja Observatory
Log of spectroscopic observations
Appendix B: Results of SYN++ modeling
B.1. SN 2021aatd
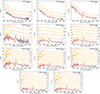 |
Fig. B.1. Modeling of the available spectra of SN 2021aatd using the SYN++ code. The observed spectra (black) were corrected for redshift and interstellar reddening before plotting. Their best-fit models are in red, while the vertically shifted orange lines represent the single-ion contributions to the spectra. |
Best-fit SYN++ parameter values of the modeled spectra of SN 2021aatd. The global parameters are Tph (1000K) and vph (103 km s−1). The local parameters are log τ (–), vmin (103 km s−1), vmax (103 km s−1), aux (103 km s−1), and Texc (1000 K).
B.2. SN 2020faa
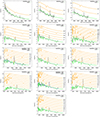 |
Fig. B.2. Spectrum modeling of SN 2020faa, the comparison object of SN 2021aatd. The redshift- and reddening corrected spectra (black) are plotted together with the best-fit model obtained in SYN++ (green), and the single-ion contributions (orange) similarly to Fig. B.1. |
Best-fit parameters of the SYN++ modeling of SN 2020faa in the same way as in Table B.1.
B.3. SN 1987A
Best-fit parameters of the SYN++ modeling of SN 1987A in the same way as in Table B.1.
All Tables
Ejecta masses, kinetic energies, and initial 56Ni masses in the adopted Dessart & Hillier (2019) explosion models.
Parameters of the best-fit two-component bolometric LC models for SNe 2021aatd and 1987A.
Best-fit SYN++ parameter values of the modeled spectra of SN 2021aatd. The global parameters are Tph (1000K) and vph (103 km s−1). The local parameters are log τ (–), vmin (103 km s−1), vmax (103 km s−1), aux (103 km s−1), and Texc (1000 K).
Best-fit parameters of the SYN++ modeling of SN 2020faa in the same way as in Table B.1.
Best-fit parameters of the SYN++ modeling of SN 1987A in the same way as in Table B.1.
All Figures
|
Fig. 1. BVgri photometry of SN 2021aatd. The filled and empty circles denote measurements from LCO sites and from Baja Observatory, respectively. The dotted vertical lines mark the epochs of spectroscopic observations shown in Table A.3. |
| In the text | |
|
Fig. 2. Optical spectra of SN 2021aatd obtained from LCO sites (black) and with Magellan (blue). |
| In the text | |
|
Fig. 3. Comparison of the early- and late-time r-band photometric evolution of SN 2021aatd to that of iPTF14hls (r + R filters, Arcavi et al. 2017), SNe 1987A (R filter, Hamuy et al. 1988; Whitelock et al. 1988; Catchpole et al. 1988, 1989), 2005cs (Pastorello et al. 2009), 2006au (Taddia et al. 2012), 2020faa (Yang et al. 2021; Salmaso et al. 2023), and 2020xkx (Soraisam et al. 2022, downloaded from the ALeRCE ZTF Explorer). In the cases of SN 2006au and iPTF14hls, there is a large uncertainty regarding the date of explosion; thus, their LCs are shifted to match the LC maxima of SNe 1987A and 2020faa, respectively (following the method of Taddia et al. 2012; Yang et al. 2021). |
| In the text | |
|
Fig. 4. Comparison of early-phase absolute magnitudes of SNe 2020faa and 2021aatd. The latter values are shifted by −1.8 mag. |
| In the text | |
|
Fig. 5. Comparison of the light curves and color curves of SN 2021aatd to those of SNe 1987A and 2020faa. |
| In the text | |
|
Fig. 6. Comparison of early- (left panel) and later-phase (right panel) spectra of SN 2021aatd to that of SNe 2020faa (Yang et al. 2021), 2017eaw (IIP, Szalai et al. 2019), and 1987A (Pun et al. 1995), respectively. All the spectra are corrected for redshift and extinction. The spectra of SNe 1987A and 2020faa are from the WISeREP database. |
| In the text | |
|
Fig. 7. Measured Hα (top left) and Fe II 5169 Å (top right) line velocities of SN 2021aatd compared to those of SNe 1987A (Xiang et al. 2023), 2020faa (Yang et al. 2021), and Type IIP 2012aw (Bose et al. 2013). The calculated line velocities from a3, a4, and a5 explosion models of Dessart & Hillier (2019) (DH19), as well as photospheric velocities of SNe 2021aatd and 2020faa determined from our SYN++ models, are also plotted (see text for further details). Bottom left: Calculated photospheric temperatures (Tphot) from DH19 a3, a4, and a5 models compared to Tphot values of SNe 2021aatd and 2020faa determined from our SYN++ models. Bottom right: Calculated V-band absolute magnitudes (MV) from DH19 a3, a4, and a5 models compared to the measured values of SN 2021aatd. |
| In the text | |
|
Fig. 8. Ion contributions from SYN++ models calculated for spectra at +83, +88, and +84 days of SNe 2021aatd, 2020faa, and 1987A, respectively. |
| In the text | |
|
Fig. 9. Comparison of +83 and +84d spectra of SNe 2021aatd and 1987A to the a3 (top), a4 (middle), and a5 (bottom) model spectra published by Dessart & Hillier (2019); see details in text. All spectra are normalized to the flux values at 6000 Å. |
| In the text | |
|
Fig. 10. Comparison of nebular spectra of SNe 2021aatd, 2020faa, and 1987A to the a3 (top), a4 (middle), and a5 (bottom) model spectra published by Dessart & Hillier (2019); see details in text. All spectra are normalized to the flux values at 6000 Å. |
| In the text | |
|
Fig. 11. Comparison of the +293d nebular spectrum of SN 2021aatd to the model spectra published by Jerkstrand et al. (2012, 2014). Model spectra with the closest epochs to that of the observed one (+306 days for the 12, 15, and 25 M⊙ models, and +332 days for the 19 M⊙ model) were selected; see details in text. All spectra are normalized to the flux values at 6000 Å. The [O I] line doublet (λλ6300, 6364) for the model and the observed spectra is shown in the inset; the observed line profile resembles most closely the 15 M⊙ model, suggesting that the initial mass of the progenitor is close to this value. |
| In the text | |
|
Fig. 12. BVgri (pseudo)bolometric LCs of SN 2021aatd calculated with the SuperBol code. The orange and red filled circles denote respectively the “pure” pseudo-bolometric LC (i.e., the integration of BVgri fluxes) and the LC corrected after the integration of a blackbody (BB) function fitting of the available photometry. The black circles show the final bolometric LC of SN 2021aatd calculated from a suppressed BB estimation (see details in the text). Bolometric LCs of SNe 1987A and 2020faa (adopted from Nagy & Vinkó 2016 and Salmaso et al. 2023, respectively) are also shown. |
| In the text | |
|
Fig. 13. Bolometric LC of SN 1987A (circles) with the best-fit two-component Arnett-Fu models, assuming either only radioactive energy input (blue line, Nagy & Vinkó 2016) or Ni-Co decay with an additional magnetar power source (black line, Model I from this work). |
| In the text | |
|
Fig. 14. Bolometric LC of SN 2021aatd (black circles) with the best-fit two-component Model I curves (red line). The left and right panels show the results of our model fitting assuming a recombination temperature of Trec = 6500 and 7000 K, respectively. The contributions of the core and the shell parts of the ejecta are plotted as blue and green lines, respectively. The light blue and magenta lines represent respectively the contribution of the radioactive decay and magnetar energy input to the luminosity evolution of the core component. Details and parameter values can be found in the text and in Table 4. |
| In the text | |
|
Fig. 15. Results of fitting Model II to the bolometric LC of SN 2021aatd. The left panel shows all the core and shell components of the best-fit Model II curve. The right panel shows the best-fit Model II curves fitted to the average values and to the upper and lower limits of the bolometric luminosities. Details and parameter values can be found in the text and in Table 4. |
| In the text | |
|
Fig. 16. Comparison of the early-phase Model II bolometric LC fits of SNe 2021aatd and 1987A. |
| In the text | |
|
Fig. B.1. Modeling of the available spectra of SN 2021aatd using the SYN++ code. The observed spectra (black) were corrected for redshift and interstellar reddening before plotting. Their best-fit models are in red, while the vertically shifted orange lines represent the single-ion contributions to the spectra. |
| In the text | |
|
Fig. B.2. Spectrum modeling of SN 2020faa, the comparison object of SN 2021aatd. The redshift- and reddening corrected spectra (black) are plotted together with the best-fit model obtained in SYN++ (green), and the single-ion contributions (orange) similarly to Fig. B.1. |
| In the text | |
Current usage metrics show cumulative count of Article Views (full-text article views including HTML views, PDF and ePub downloads, according to the available data) and Abstracts Views on Vision4Press platform.
Data correspond to usage on the plateform after 2015. The current usage metrics is available 48-96 hours after online publication and is updated daily on week days.
Initial download of the metrics may take a while.