Fig. 15.
Download original image
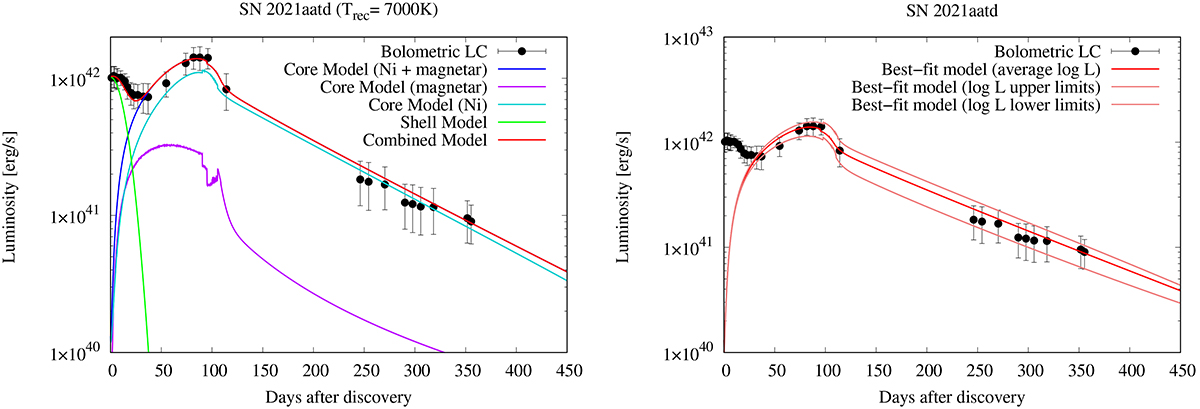
Results of fitting Model II to the bolometric LC of SN 2021aatd. The left panel shows all the core and shell components of the best-fit Model II curve. The right panel shows the best-fit Model II curves fitted to the average values and to the upper and lower limits of the bolometric luminosities. Details and parameter values can be found in the text and in Table 4.
Current usage metrics show cumulative count of Article Views (full-text article views including HTML views, PDF and ePub downloads, according to the available data) and Abstracts Views on Vision4Press platform.
Data correspond to usage on the plateform after 2015. The current usage metrics is available 48-96 hours after online publication and is updated daily on week days.
Initial download of the metrics may take a while.