Fig. 14.
Download original image
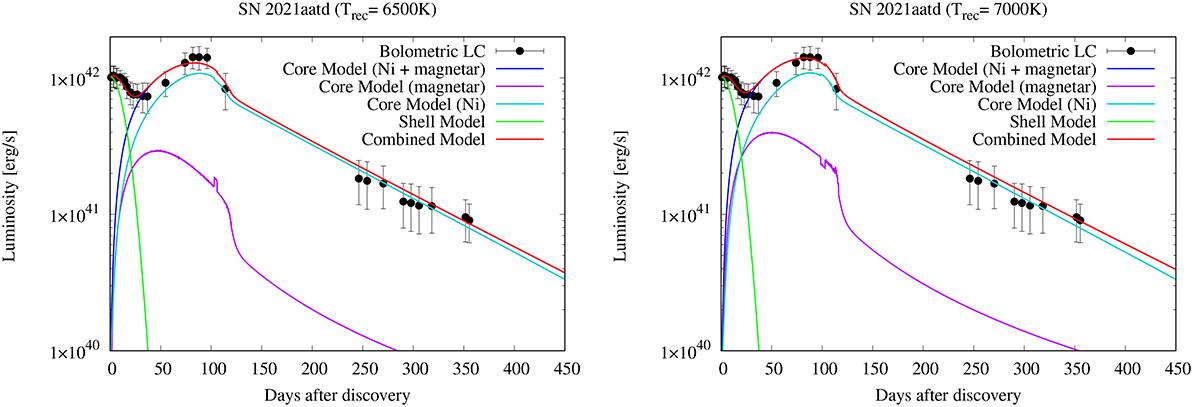
Bolometric LC of SN 2021aatd (black circles) with the best-fit two-component Model I curves (red line). The left and right panels show the results of our model fitting assuming a recombination temperature of Trec = 6500 and 7000 K, respectively. The contributions of the core and the shell parts of the ejecta are plotted as blue and green lines, respectively. The light blue and magenta lines represent respectively the contribution of the radioactive decay and magnetar energy input to the luminosity evolution of the core component. Details and parameter values can be found in the text and in Table 4.
Current usage metrics show cumulative count of Article Views (full-text article views including HTML views, PDF and ePub downloads, according to the available data) and Abstracts Views on Vision4Press platform.
Data correspond to usage on the plateform after 2015. The current usage metrics is available 48-96 hours after online publication and is updated daily on week days.
Initial download of the metrics may take a while.