Open Access
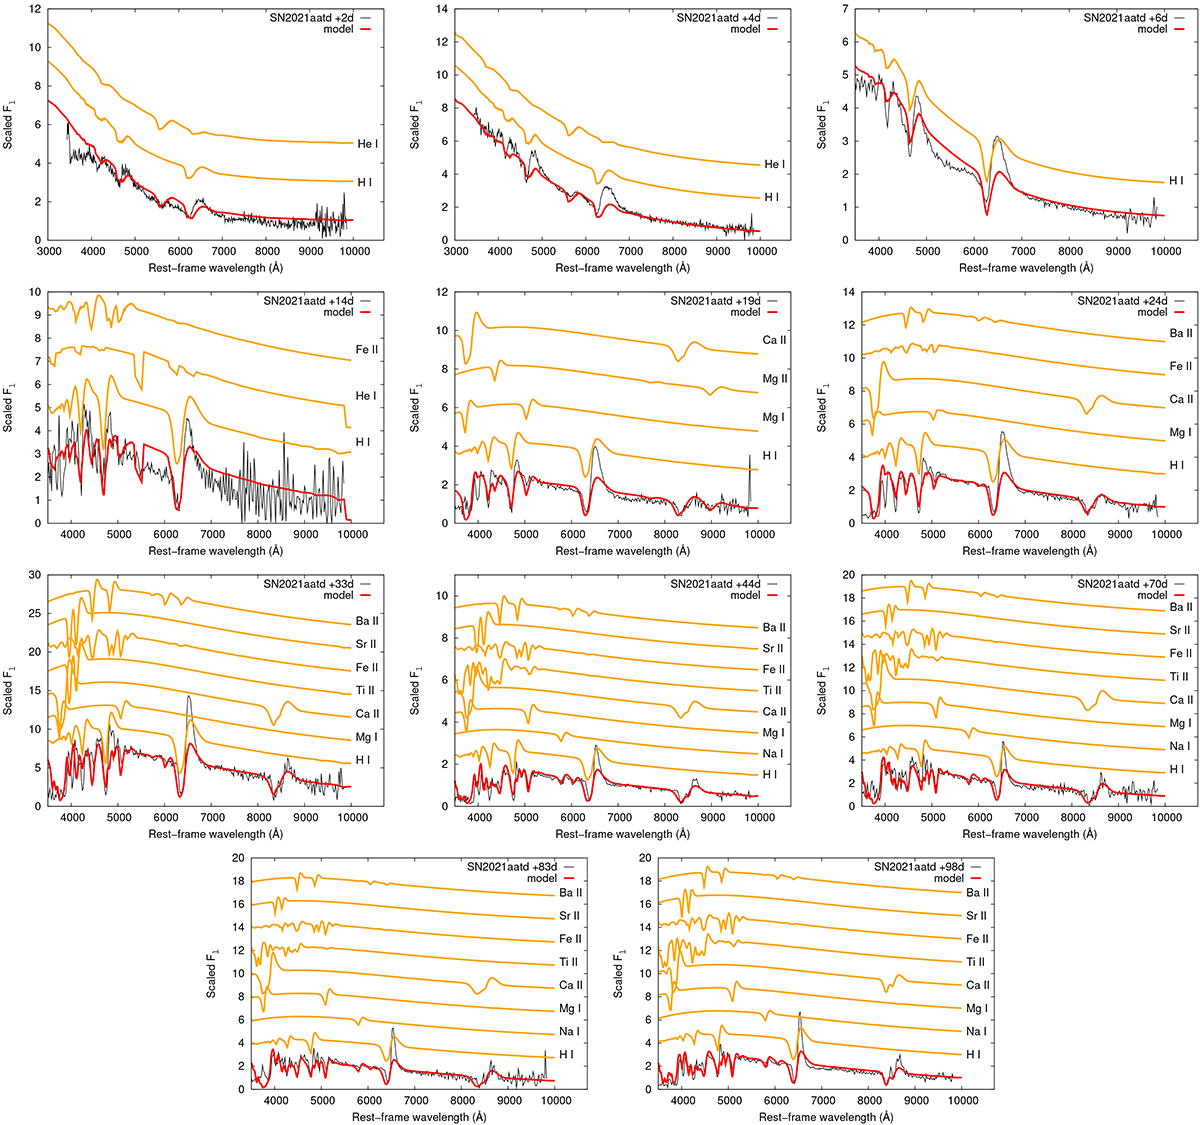
Fig. B.1.
Download original image
Modeling of the available spectra of SN 2021aatd using the SYN++ code. The observed spectra (black) were corrected for redshift and interstellar reddening before plotting. Their best-fit models are in red, while the vertically shifted orange lines represent the single-ion contributions to the spectra.
Current usage metrics show cumulative count of Article Views (full-text article views including HTML views, PDF and ePub downloads, according to the available data) and Abstracts Views on Vision4Press platform.
Data correspond to usage on the plateform after 2015. The current usage metrics is available 48-96 hours after online publication and is updated daily on week days.
Initial download of the metrics may take a while.